145)
A corporation reports the following year-end balance sheet data. The company’s acid-test ratio
equals:
Cash $ 40,000 Current liabilities $ 75,000
Accounts receivable 55,000 Long-term liabilities 35,000
Inventory 60,000 Common stock 100,00
0
Equipment 145,00
0
Total assets $ 300,00
0
Retained earnings 90,000
Total liabilities and equity $ 300,00
0
A) 2.07 B) 0.37 C) 0.58 D) 1.27 E) 0.63
146)
A corporation reports the following year-end balance sheet data. The company’s current ratio equals:
Cash $ 40,000 Current liabilities $ 75,000
Accounts receivable 55,000 Long-term liabilities 35,000
Inventory 60,000 Common stock 100,00
0
Equipment 145,00
0
Total assets $ 300,00
0
Retained earnings 90,000
Total liabilities and equity $ 300,00
0
A) 0.37 B) 0.58 C) 0.63 D) 1.27 E) 2.07
147)
A corporation reports the following year-end balance sheet data. The company’s debt ratio equals:
Cash
$40,000
Current liabilities
$75,000
Accounts receivable
55,000
Long-term liabilities
35,000
Inventory
60,000
Common stock
100,000
Equipment
145,000
Retained earnings
90,000
Total assets
$300,000
Total liabilities and equity
$300,000
A) 0.37 B) 0.58 C) 0.63 D) 1.27 E) 2.07
148)
A corporation reports the following year-end balance sheet data. The company’s equity ratio equals:
Cash
$40,000
Current liabilities
$75,000
Accounts receivable
55,000
Long-term liabilities
35,000
Inventory
60,000
Common stock
100,000
Equipment
145,000
Retained earnings
90,000
Total assets
$300,000
Total liabilities and equity
$300,000
A) 0.58 B) 2.07 C) 0.63 D) 1.27 E) 0.37
149)
A corporation reports the following year-end balance sheet data. The company’s debt-to-equity ratio
equals:
Cash
$40,000
Current liabilities
$75,000
Accounts receivable
55,000
Long-term liabilities
35,000
Inventory
60,000
Common stock
100,000
Equipment
145,000
Retained earnings
90,000
Total assets
$300,000
Total liabilities and equity
$300,000
A) 0.58 B) 1.27 C) 0.37 D) 0.63 E) 2.07
150)
Selected current year company information follows:
Net income
$15,953
Net sales
712,855
Total liabilities, beginning-year
83,932
Total liabilities, end-of-year
103,201
Total stockholders’ equity, beginning-year…..
198,935
Total stockholders’ equity, end-of-year
121,851
The total asset turnover is:
A)
2.81 times B) 6.28 times C) 3.64 times D) 2.24 times E) 4.67 times
Net income
$15,953
Net sales
712,855
Total liabilities, beginning–year
83,932
Total liabilities, end–of-year
103,201
Total stockholders‘ equity, beginning–year…...
198,935
151)
Selected current year company information follows:
67
Total stockholders’ equity, beginning–year…… 198,935
Total stockholders’ equity, end–of-year 121,851
The return on total assets is:
A) 2.81% B) 3.64% C) 6.28% D) 4.67% E) 2.24%
152)
All of the following statements regarding a business segment are true except:
A)
A company’s gain or loss from selling or closing down a segment is reported separately.
B)
A business segment is a part of a company’s operations that serves a particular product line.
C)
A segment has assets, liabilities, and financial results of operations that can be distinguished
from those of other parts of the company.
D)
A segment’s income for the period prior to the disposal and the gain or loss resulting from
disposing of the segment’s assets are reported separately.
E)
The income tax effects of a discontinued segment are combined with income tax from
continuing operations.
153)
Use the following selected information from Wheeler, LLC to determine the 2017 and 2016 common
size percentages for cost of goods sold using Net sales as the base.
2017
2016
Net sales
$276,200
$231,400
Cost of goods sold
151,900
129,590
Operating expenses
55,240
53,240
Net earnings
27,820
19,820
A) 119.4% for 2017 and 100.0% for 2016.
B) 65.1% for 2017 and 56.0% for 2016.
C) 36.4% for 2017 and 41.1% for 2016.
D) 55.0% for 2017 and 56.0% for 2016.
E) 117.2% for 2017 and 100.0% for 2016.
154)
Use the following selected information from Wheeler, LLC to determine the 2017 and 2016 common
size percentages for operating expenses using Net sales as the base.
2017
2016
Net sales
$276,200
$231,400
Cost of goods sold
151,900
129,590
Operating expenses
55,240
53,240
Net earnings
27,820
19,820
A) 23.9% for 2017 and 23.0% for 2016.
B) 103.8% for 2017 and 100.0% for 2016.
C) 36.4% for 2017 and 41.1% for 2016.
D) 55.0% for 2017 and 56.0% for 2016.
E) 20.0% for 2017 and 23.0% for 2016.
155)
Use the following selected information from Wheeler, LLC to determine the 2017 and 2016 trend
percentages for net sales using 2016 as the base.
2017
2016
Net sales
$276,200
$231,400
Cost of goods sold
151,900
129,590
Operating expenses
55,240
53,240
Net earnings
27,820
19,820
A) 117.2% for 2017 and 100.0% for 2016.
B) 55.0% for 2017 and 56.0% for 2016.
C) 65.1% for 2017 and 64.6% for 2016.
D) 36.4% for 2017 and 41.1% for 2016.
E) 119.4% for 2017 and 100.0% for 2016.
156)
Use the following selected information from Wheeler, LLC to determine the 2017 and 2016 trend
percentages for cost of goods sold using 2016 as the base.
2017
2016
Net sales
$276,200
$231,400
Cost of goods sold
151,900
129,590
Operating expenses
55,240
53,240
Net earnings
27,820
19,820
A) 117.2% for 2017 and 100.0% for 2016.
B) 119.4% for 2017 and 100.0% for 2016.
C) 55.0% for 2017 and 56.0% for 2016.
D) 36.4% for 2017 and 41.1% for 2016.
E) 65.1% for 2017 and 64.6% for 2016.
157)
Refer to the following selected financial information from McCormik, LLC. Compute the company’s
working capital for Year 2.
Year 2
Year 1
Cash
$37,500
36,850
Short-term investments
90,000
90,000
Accounts receivable, net
85,500
86,250
Merchandise inventory
121,000
117,000
Prepaid expenses
12,100
13,500
Plant assets
388,000
392,000
Accounts payable
113,400
111.750
Net sales
711,000
706,000
Cost of goods sold
390,000
385,500
A) $111,700. B) $220,600. C) $147,200. D) $142,700. E) $232,700.
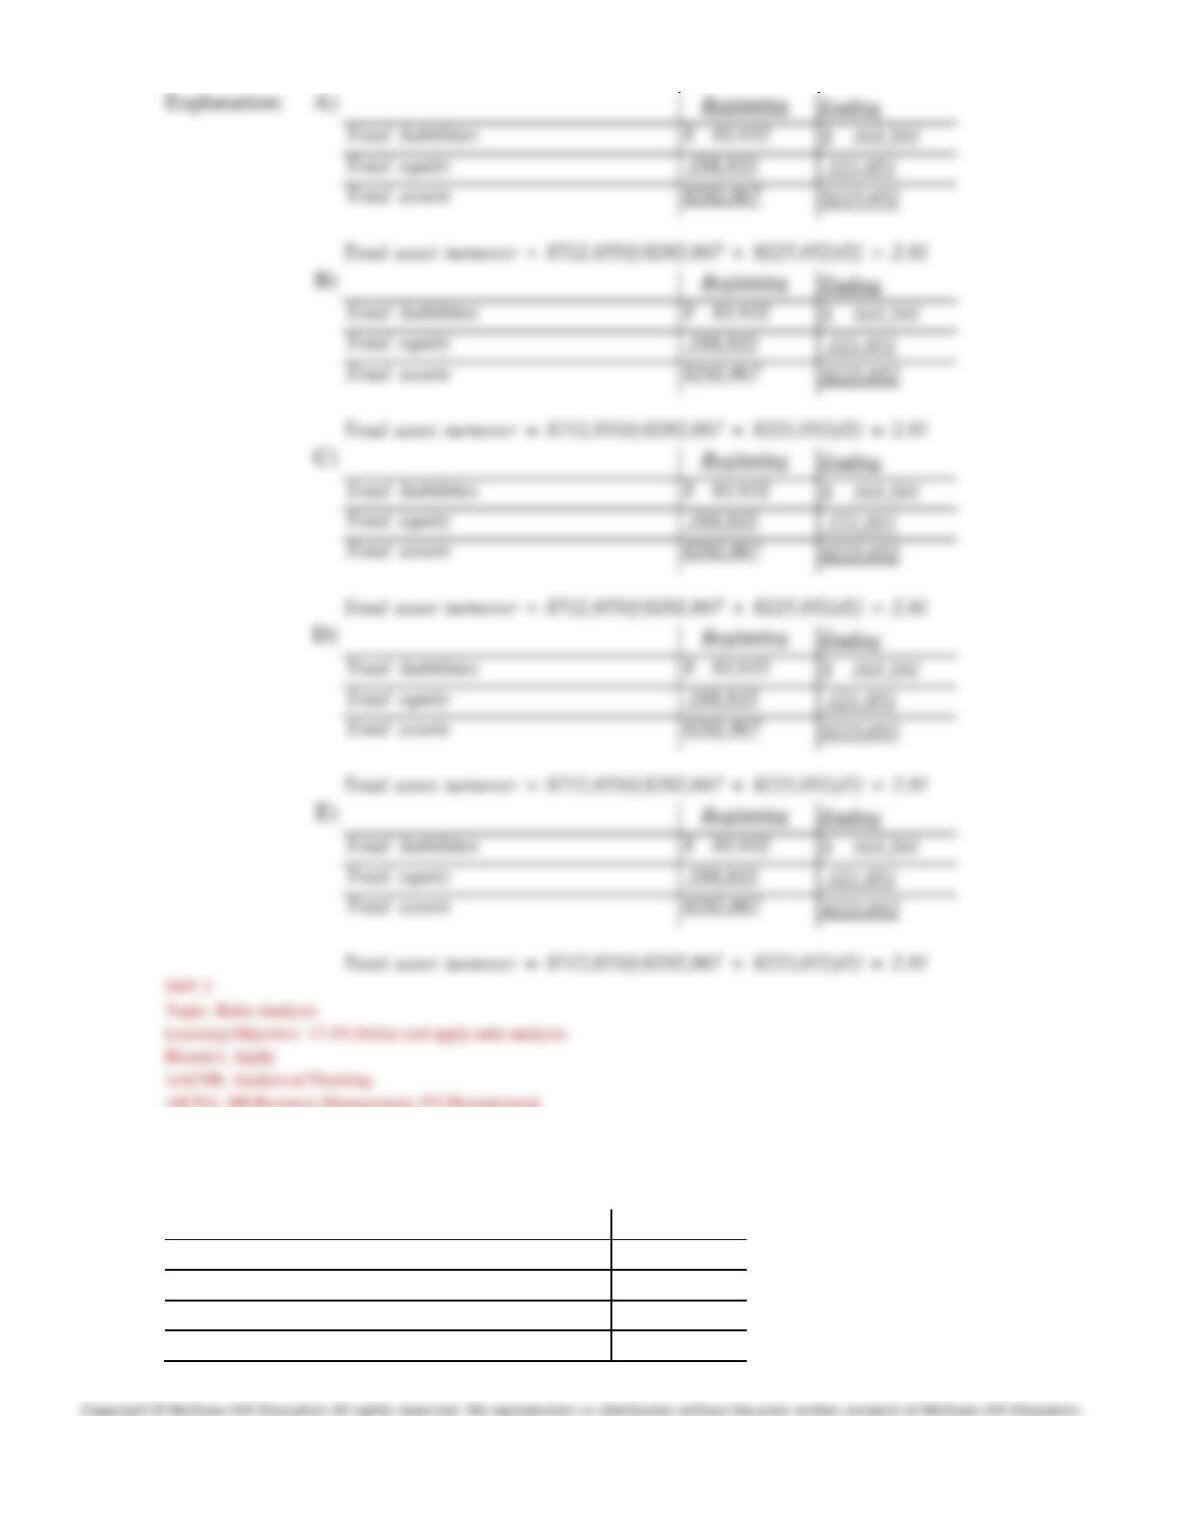
158)
Refer to the following selected financial information from McCormik, LLC. Compute the company’s
current ratio for Year 2.
Year 2
Year 1
Cash
$37,500
36,850
Short-term investments
90,000
90,000
Accounts receivable, net
85,500
86,250
Merchandise inventory
121,000
117,000
Prepaid expenses
12,100
13,500
Plant assets
388,000
392,000
Accounts payable
113,400
111.750
Net sales
711,000
706,000
Cost of goods sold
390,000
385,500
A) 2.95. B) 2.26. C) 1.88. D) 3.05. E) 1.98.
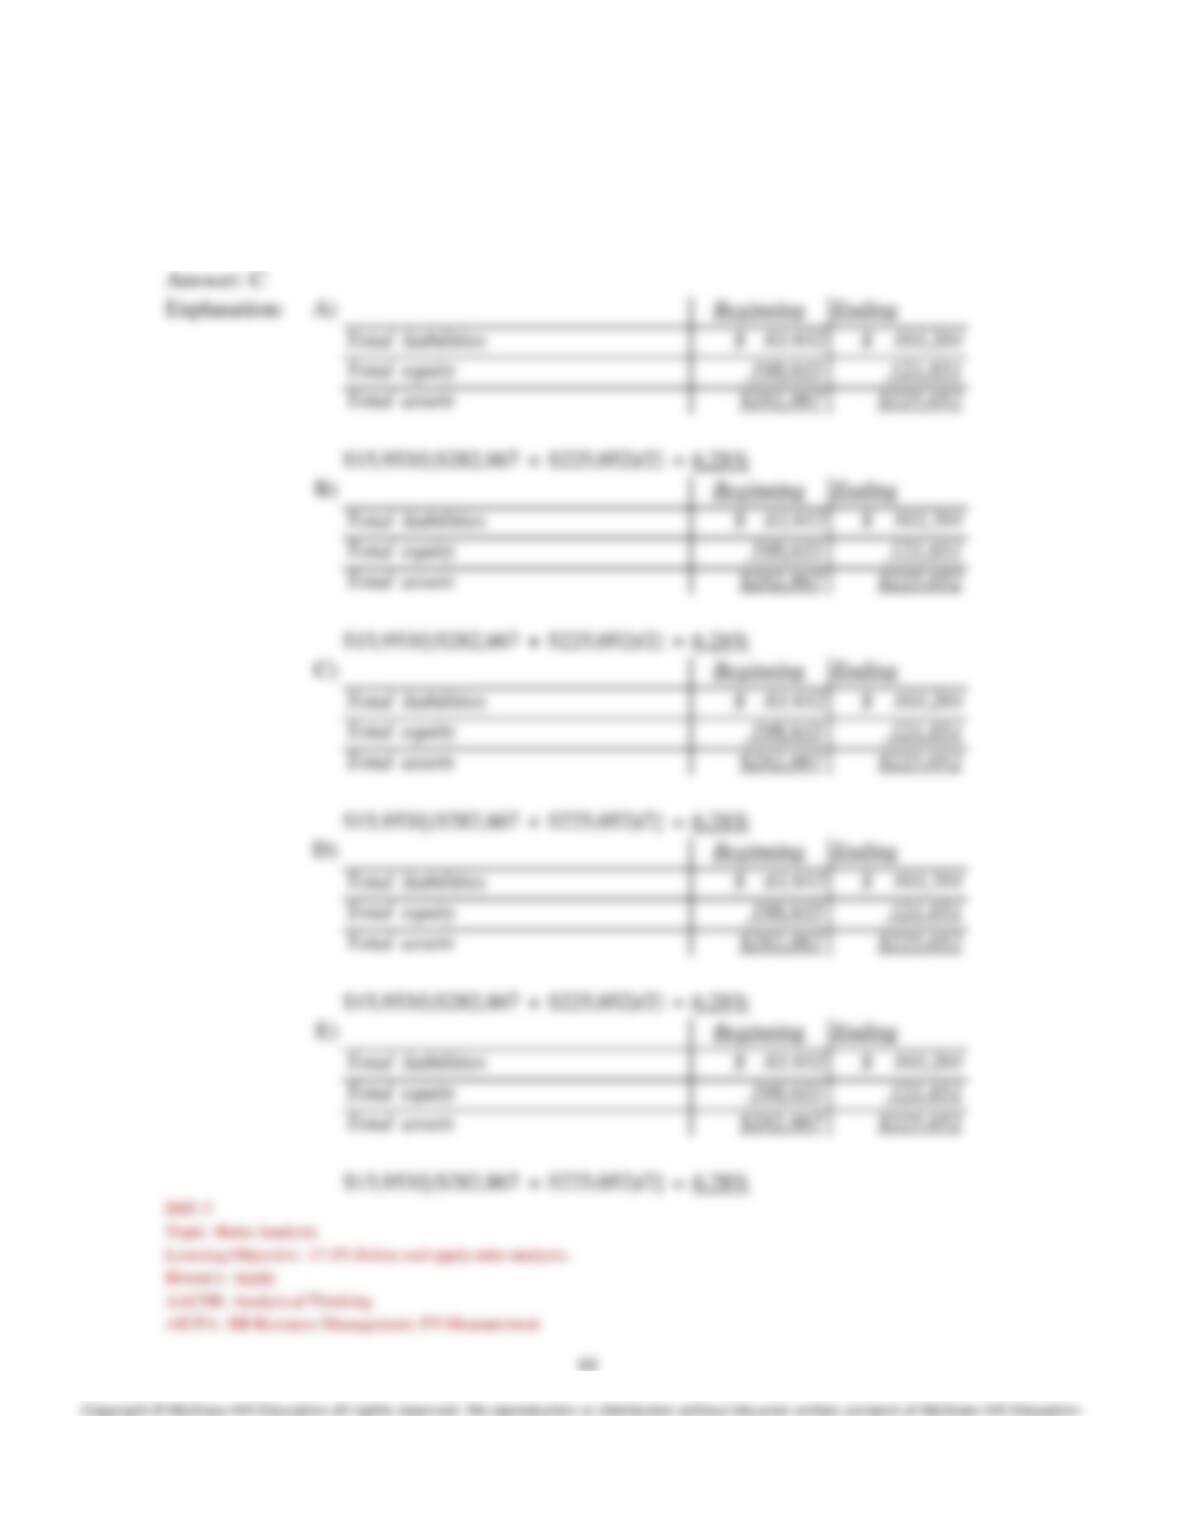
159)
Refer to the following selected financial information from McCormik, LLC. Compute the company’s
acid-test ratio for Year 2.
Year 2
Year 1
Cash
$37,500
36,850
Short-term investments
90,000
90,000
Accounts receivable, net
85,500
86,250
Merchandise inventory
121,000
117,000
Prepaid expenses
12,100
13,500
Plant assets
388,000
392,000
Accounts payable
113,400
111.750
Net sales
711,000
706,000
Cost of goods sold
390,000
385,500
A) 1.98. B) 3.05. C) 1.88. D) 2.26. E) 2.95.
160)
Refer to the following selected financial information from McCormik, LLC. Compute the company’s
accounts receivable turnover for Year 2.
Year 2
Year 1
Cash
$37,500
36,850
Short-term investments
90,000
90,000
Accounts receivable, net
85,500
86,250
Merchandise inventory
121,000
117,000
Prepaid expenses
12,100
13,500
Plant assets
388,000
392,000
Accounts payable
113,400
111.750
Net sales
711,000
706,000
Cost of goods sold
390,000
385,500
A) 8.28. B) 8.94. C) 8.62. D) 7.90. E) 5.78.
161)
Refer to the following selected financial information from McCormik, LLC. Compute the company’s
inventory turnover for Year 2.
Year 2
Year 1
Cash
$37,500
36,850
Short-term investments
90,000
90,000
Accounts receivable, net
85,500
86,250
Merchandise inventory
121,000
117,000
Prepaid expenses
12,100
13,500
Plant assets
388,000
392,000
Accounts payable
113,400
111.750
Net sales
711,000
706,000
Cost of goods sold
390,000
385,500
A) 3.86. B) 5.78. C) 3.28. D) 4.33. E) 4.72.
162)
Refer to the following selected financial information from McCormik, LLC. Compute the
company’s days’ sales uncollected for Year 2. (Use 365 days a year.)
Year 2
Year 1
Cash
$37,500
36,850
Short-term investments
90,000
90,000
Accounts receivable, net
85,500
86,250
Merchandise inventory
121,000
117,000
Prepaid expenses
12,100
13,500
Plant assets
388,000
392,000
Accounts payable
113,400
111.750
Net sales
711,000
706,000
Cost of goods sold
390,000
385,500
A) 43.9. B) 42.3. C) 80.0. D) 113.3. E) 46.2.
163)
Refer to the following selected financial information from McCormik, LLC. Compute the
company’s days’ sales in inventory for Year 2. (Use 365 days a year.)
Year 2
Year 1
Cash
$37,500
36,850
Short-term investments
90,000
90,000
Accounts receivable, net
85,500
86,250
Merchandise inventory
121,000
117,000
Prepaid expenses
12,100
13,500
Plant assets
388,000
392,000
Accounts payable
113,400
111.750
Net sales
711,000
706,000
Cost of goods sold
390,000
385,500
A) 113.2. B) 80.0. C) 42.3. D) 43.9. E) 46.2.