203
251) Abdool Corporation has provided the following financial data:
Balance Sheet
December 31, Year 2 and Year 1
Assets
Year 2
Year 1
Current assets:
Cash
$
190,000
$
190,000
Accounts receivable, net
197,000
200,000
Inventory
232,000
200,000
Prepaid expenses
9,000
10,000
Total current assets
628,000
600,000
Plant and equipment, net
695,000
700,000
Total assets
$
1,323,000
$
1,300,000
Liabilities and Stockholders’ Equity
Current liabilities:
Accounts payable
$
206,000
$
200,000
Accrued liabilities
104,000
90,000
Notes payable, short term
41,000
50,000
Total current liabilities
351,000
340,000
Bonds payable
130,000
130,000
Total liabilities
481,000
470,000
Stockholders’ equity:
Common stock, $2 par value
160,000
160,000
Additional paid-in capital
70,000
70,000
Retained earnings
612,000
600,000
Total stockholders’ equity
842,000
830,000
Total liabilities & stockholders’ equity
$
1,323,000
$
1,300,000
204
Income Statement
For the Year Ended December 31, Year 2
Sales (all on account)
$
1,330,000
Cost of goods sold
740,000
Gross margin
590,000
Operating expenses
555,000
Net operating income
35,000
Interest expense
11,000
Net income before taxes
24,000
Income taxes (30%)
7,200
Net income
$
16,800
Required:
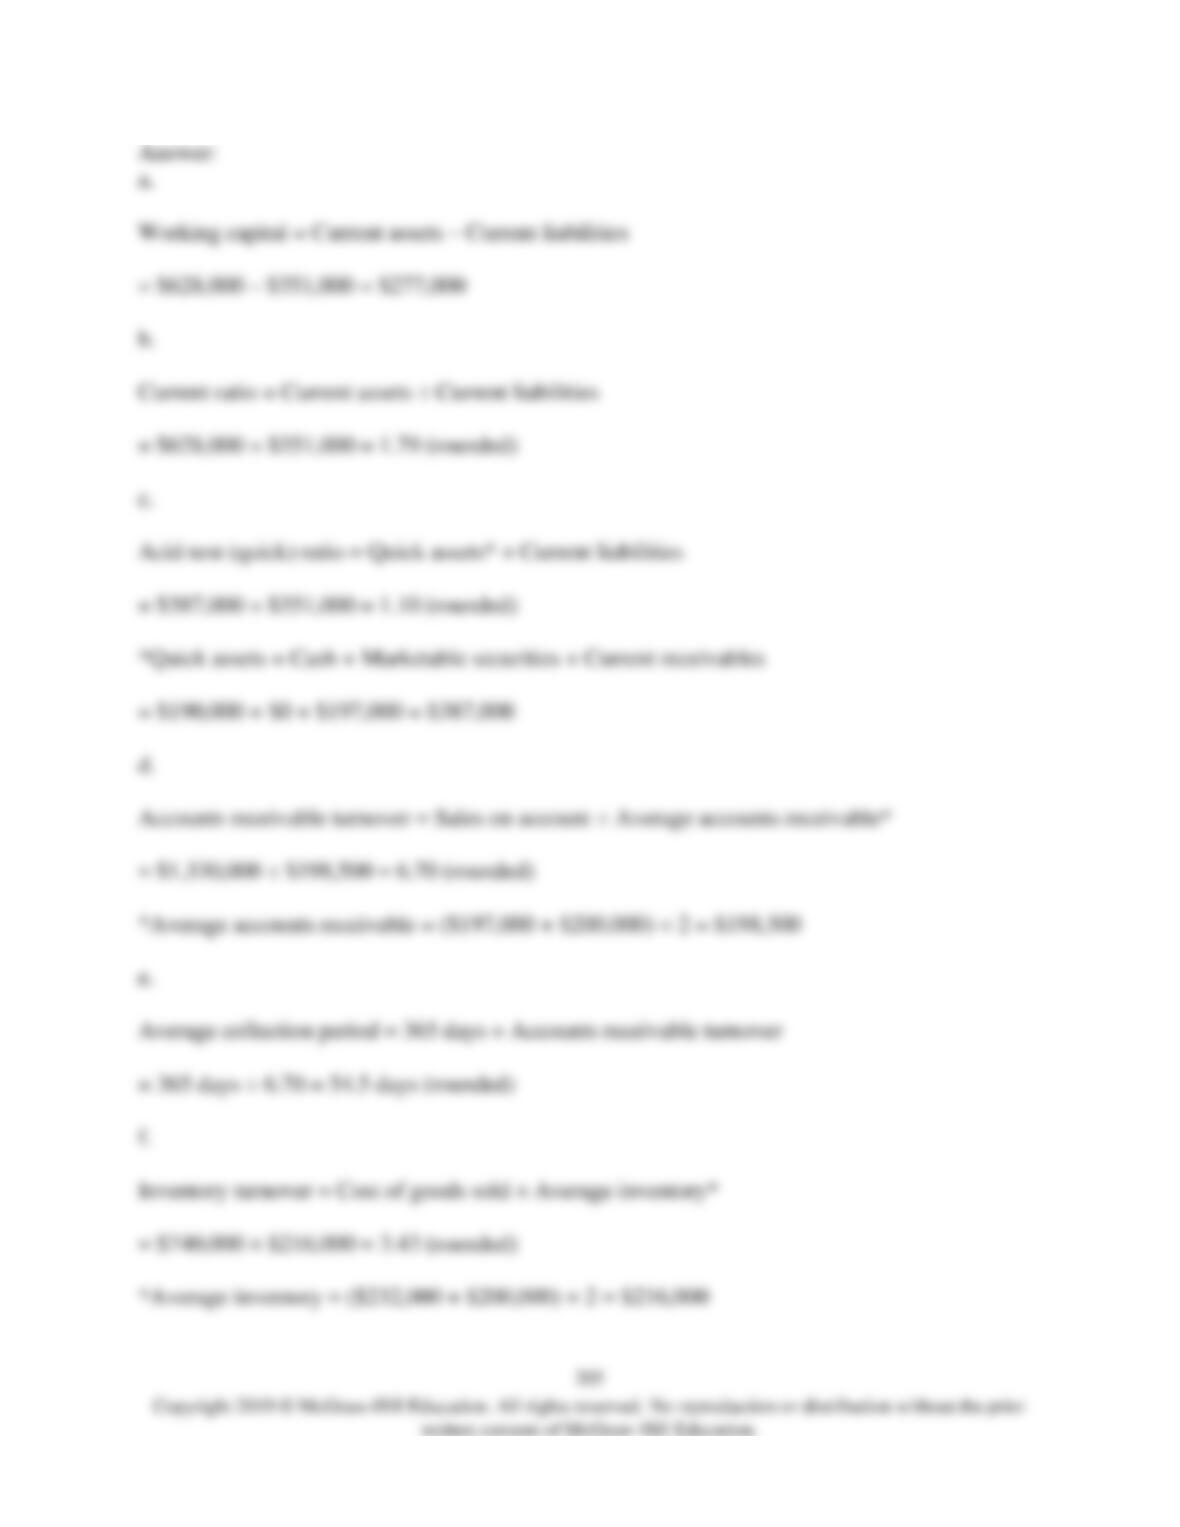
a. What is the company’s working capital at the end of Year 2?
b. What is the company’s current ratio at the end of Year 2?
c. What is the company’s acid-test (quick) ratio at the end of Year 2?
d. What is the company’s accounts receivable turnover for Year 2?
e. What is the company’s average collection period for Year 2?
f. What is the company’s inventory turnover for Year 2?
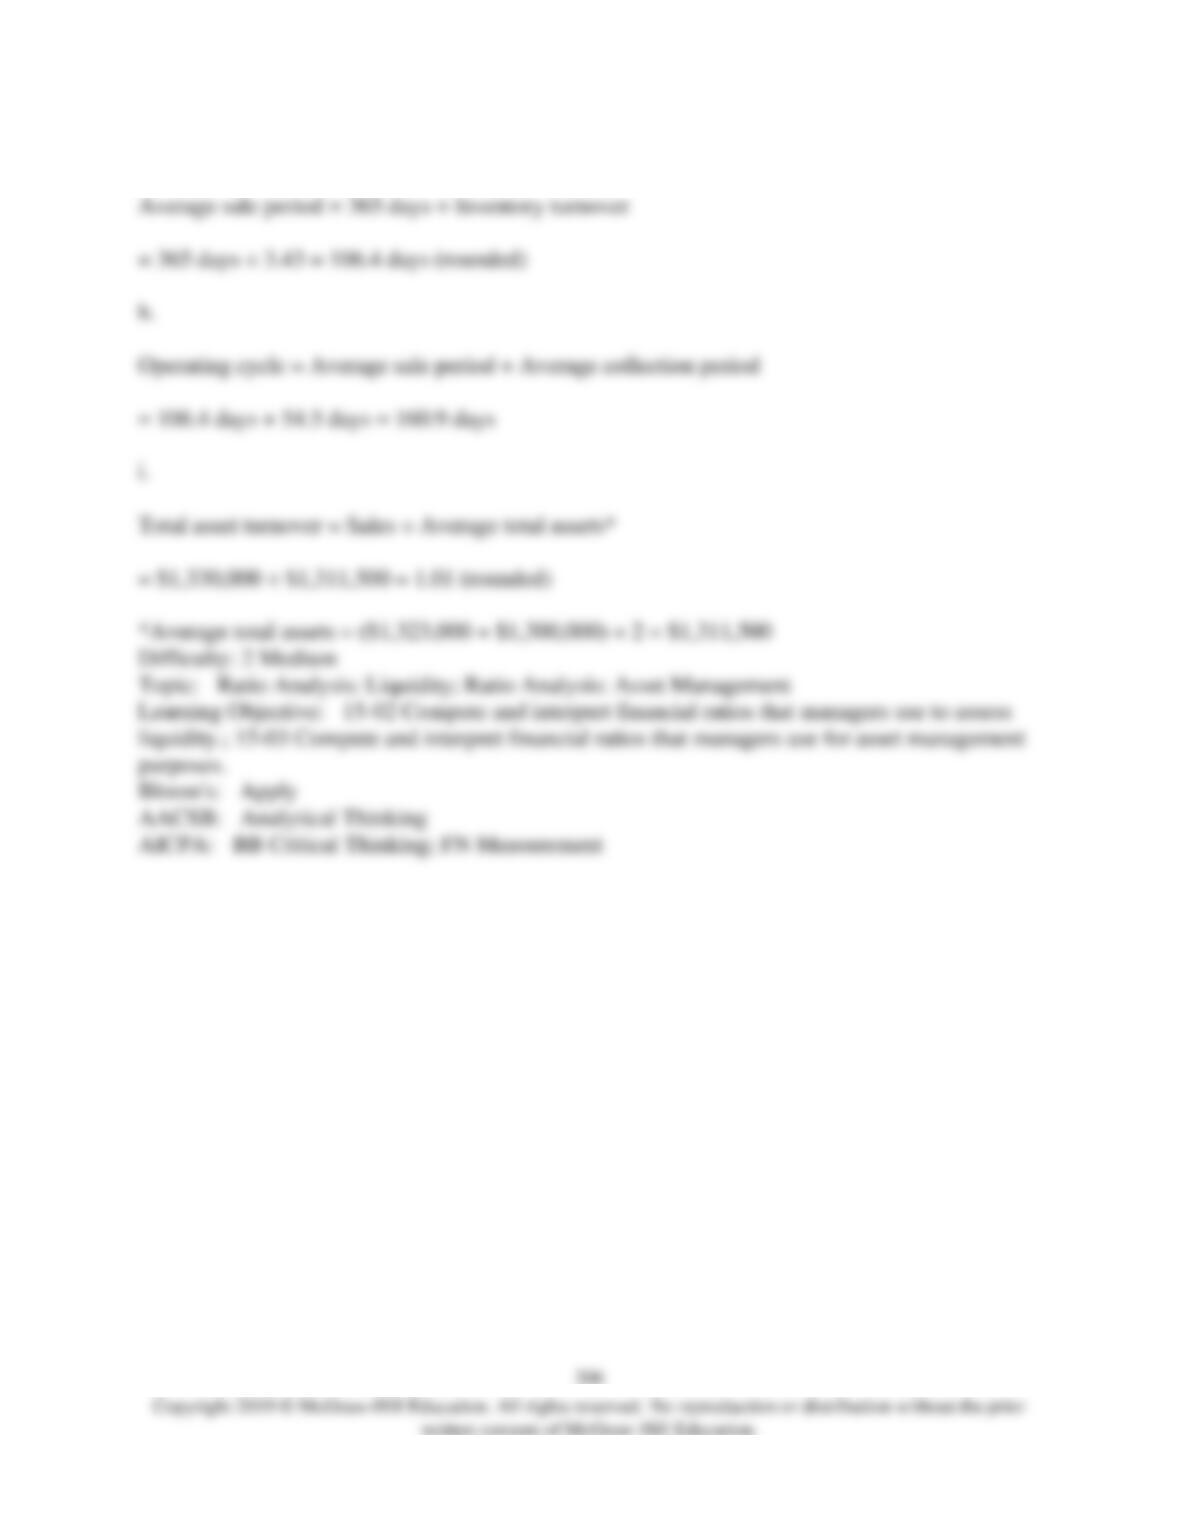
g. What is the company’s average sale period for Year 2?
h. What is the company’s operating cycle for Year 2?
i. What is the company’s total asset turnover for Year 2?
g.

207
252) Financial statements for Rardin Corporation appear below:
Rardin Corporation
Balance Sheet
December 31, Year 2 and Year 1
(dollars in thousands)
Year 2
Year 1
Current assets:
Cash and marketable securities
$
160
$
160
Accounts receivable, net
180
160
Inventory
160
180
Prepaid expenses
80
70
Total current assets
580
570
Noncurrent assets:
Plant & equipment, net
1,180
1,110
Total assets
$
1,760
$
1,680
Current liabilities:
Accounts payable
$
130
$
140
Accrued liabilities
40
60
Notes payable, short term
290
280
Total current liabilities
460
480
Noncurrent liabilities:
Bonds payable
260
300
Total liabilities
720
780
Stockholders’ equity:
Common stock, $5 par
160
160
Additional paid-in capital
250
250
Retained earnings
630
490
Total stockholders’ equity
1,040
900
Total liabilities & stockholders’ equity
$
1,760
$
1,680
208
Rardin Corporation
Income Statement
For the Year Ended December 31, Year 2
(dollars in thousands)
Sales (all on account)
$
1,900
Cost of goods sold
1,330
Gross margin
570
Selling and administrative expense
220
Net operating income
350
Interest expense
30
Net income before taxes
320
Income taxes (30%)
96
Net income
$
224
Required:
Compute the following for Year 2:
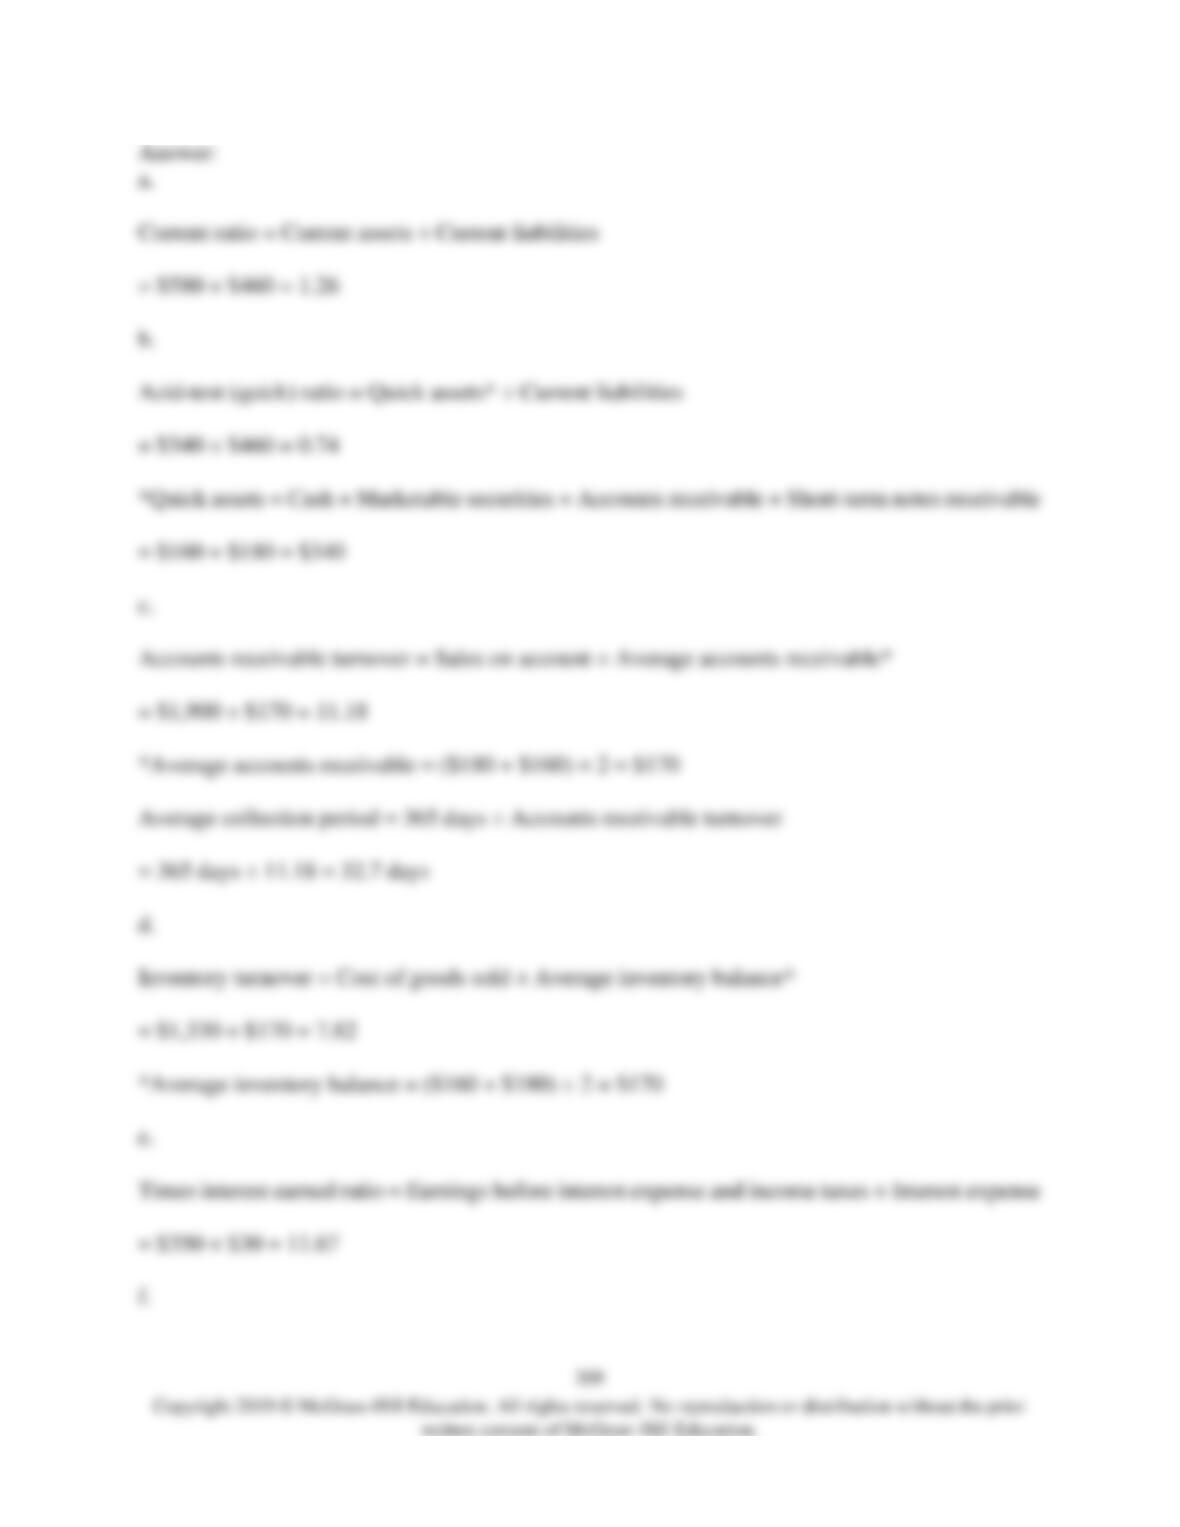
a. Current ratio.
b. Acid-test (quick) ratio.
c. Average collection period.
d. Inventory turnover.
e. Times interest earned ratio.
f. Debt-to-equity ratio.

211
253) Mondok Corporation has provided the following financial data:
Balance Sheet
December 31, Year 2 and Year 1
Assets
Year 2
Year 1
Current assets:
Cash
$
139,000
$
140,000
Accounts receivable, net
222,000
230,000
Inventory
109,000
120,000
Prepaid expenses
68,000
70,000
Total current assets
538,000
560,000
Plant and equipment, net
857,000
800,000
Total assets
$
1,395,000
$
1,360,000
Liabilities and Stockholders’ Equity
Current liabilities:
Accounts payable
$
186,000
$
180,000
Accrued liabilities
34,000
30,000
Notes payable, short term
64,000
60,000
Total current liabilities
284,000
270,000
Bonds payable
130,000
130,000
Total liabilities
414,000
400,000
Stockholders’ equity:
Common stock, $2 par value
100,000
100,000
Additional paid-in capital
90,000
90,000
Retained earnings
791,000
770,000
Total stockholders’ equity
981,000
960,000
Total liabilities & stockholders’ equity
$
1,395,000
$
1,360,000

212
Income Statement
For the Year Ended December 31, Year 2
Sales (all on account)
$
1,280,000
Cost of goods sold
840,000
Gross margin
440,000
Operating expenses
387,231
Net operating income
52,769
Interest expense
12,000
Net income before taxes
40,769
Income taxes (35%)
14,269
Net income
$
26,500
Required:
a. What is the company’s working capital at the end of Year 2?
b. What is the company’s current ratio at the end of Year 2?
c. What is the company’s acid-test (quick) ratio at the end of Year 2?
d. What is the company’s accounts receivable turnover for Year 2?
e. What is the company’s average collection period for Year 2?
f. What is the company’s inventory turnover for Year 2?
g. What is the company’s average sale period for Year 2?
h. What is the company’s operating cycle for Year 2?
i. What is the company’s total asset turnover for Year 2?
j. What is the company’s times interest earned ratio for Year 2?
k. What is the company’s debt-to-equity ratio at the end of Year 2?
l. What is the company’s equity multiplier at the end of Year 2?

g.
k.
216
254) Two-Rivers Inc. (TRI) manufactures a variety of consumer products. The company’s
founders have run the company for thirty years and are now interested in retiring. Consequently,
they are seeking a purchaser, and a group of investors is looking into the acquisition of TRI. To
evaluate its financial stability, TRI was requested to provide its latest financial statements and
selected financial ratios. Summary information provided by TRI is presented below.
TRI
Statement of Income
For the Year Ended November 30, Year 2
(In thousands)
Sales (net)
$
31,000
Costs and expenses:
Cost of goods sold
17,600
Selling and administrative expense
3,550
Depreciation and amortization expense
1,890
Interest expense
900
Total costs and expenses
23,940
Income before taxes
7,060
Income taxes
2,900
Net income
$
4,160
217
TRI
Balance Sheet
As of November 30
(in thousands)
Year 2
Year 1
Cash
$
400
$
500
Marketable securities
500
200
Accounts receivable, net
3,200
2,900
Inventory
5,800
5,400
Total current assets
9,900
9,000
Property, plant, & equipment, net
7,100
7,000
Total assets
$
17,000
$
16,000
Accounts payable
$
3,700
$
3,400
Income taxes payable
900
800
Accrued expenses
1,700
1,400
Total current liabilities
6,300
5,600
Long-term debt
2,000
1,800
Total liabilities
8,300
7,400
Common stock, $1 par value
2,700
2,700
Additional paid-in capital
1,000
1,000
Retained earnings
5,000
4,900
Total stockholders’ equity
8,700
8,600
Total liabilities and stockholders’ equity
$
17,000
$
16,000
Selected Financial Ratios
TRI
TRI
Industry
Year 1
Year 0
Average
Current ratio
1.62
1.61
1.63
Acid-test (quick) ratio
0.63
0.64
0.68
Times interest earned ratio
8.50
8.55
8.45
Debt to equity ratio
1.02
0.94
1.03
Inventory turnover
3.21
3.17
3.18
Required:
a. Calculate the select financial ratios for the fiscal year Year 2.
b. Interpret what each of these financial ratios means in terms of TRI’s financial stability and
operating efficiency.
220
255) Financial statements for Praeger Corporation appear below:
Praeger Corporation
Balance Sheet
December 31, Year 2 and Year 1
(dollars in thousands)
Year 2
Year 1
Current assets:
Cash and marketable securities
$
100
$
100
Accounts receivable, net
170
170
Inventory
110
110
Prepaid expenses
60
60
Total current assets
440
440
Noncurrent assets:
Plant & equipment, net
2,020
1,990
Total assets
$
2,460
$
2,430
Current liabilities:
Accounts payable
$
140
$
170
Accrued liabilities
70
50
Notes payable, short term
100
120
Total current liabilities
310
340
Noncurrent liabilities:
Bonds payable
500
500
Total liabilities
810
840
Stockholders’ equity:
Common stock, $5 par
200
200
Additional paid-in capital
300
300
Retained earnings
1,150
1,090
Total stockholders’ equity
1,650
1,590
Total liabilities & stockholders’ equity
$
2,460
$
2,430