261
270) Gambino Corporation has provided the following financial data:
Balance Sheet
December 31, Year 2 and Year 1
Assets
Year 2
Year 1
Current assets:
Cash
$
139,000
$
190,000
Accounts receivable, net
206,000
180,000
Inventory
103,000
100,000
Prepaid expenses
95,000
90,000
Total current assets
543,000
560,000
Plant and equipment, net
999,000
970,000
Total assets
$
1,542,000
$
1,530,000
Liabilities and Stockholders’ Equity
Current liabilities:
Accounts payable
$
109,000
$
120,000
Accrued liabilities
44,000
50,000
Notes payable, short term
65,000
60,000
Total current liabilities
218,000
230,000
Bonds payable
220,000
220,000
Total liabilities
438,000
450,000
Stockholders’ equity:
Common stock, $5 par value
350,000
350,000
Additional paid-in capital
60,000
60,000
Retained earnings
694,000
670,000
Total stockholders’ equity
1,104,000
1,080,000
Total liabilities & stockholders’ equity
$
1,542,000
$
1,530,000
Income Statement
For the Year Ended December 31, Year 2
Sales (all on account)
$
1,370,000
Cost of goods sold
860,000
Gross margin
510,000
Operating expenses
445,308
Net operating income
64,692
Interest expense
17,000
Net income before taxes
47,692
Income taxes (35%)
16,692
Net income
$
31,000
Required:
a. What is the company’s times interest earned ratio for Year 2?
b. What is the company’s debt-to-equity ratio at the end of Year 2?
c. What is the company’s equity multiplier at the end of Year 2?
264
271) Sidell Corporation’s most recent balance sheet and income statement appear below:
Balance Sheet
December 31, Year 2 and Year 1
(in thousands of dollars)
Assets
Year 2
Year 1
Current assets:
Cash
$
180
$
100
Accounts receivable, net
220
200
Inventory
180
200
Prepaid expenses
20
20
Total current assets
600
520
Plant and equipment, net
660
720
Total assets
$
1,260
$
1,240
Liabilities and Stockholders’ Equity
Current liabilities:
Accounts payable
$
130
$
130
Accrued liabilities
20
20
Notes payable, short term
100
90
Total current liabilities
250
240
Bonds payable
180
200
Total liabilities
430
440
Stockholders’ equity:
Common stock, $1 par value
200
200
Additional paid-in capital
300
300
Retained earnings
330
300
Total stockholders’ equity
830
800
Total liabilities & stockholders’ equity
$
1,260
$
1,240
Income Statement
For the Year Ended December 31, Year 2
(in thousands of dollars)
Sales (all on account)
$
1,230
Cost of goods sold
780
Gross margin
450
Operating expenses
235
Net operating income
215
Interest expense
29
Net income before taxes
186
Income taxes (30%)
56
Net income
$
130
Required:
Compute the following for Year 2:
a. Times interest earned ratio.
b. Debt-to-equity ratio.

266
272) Lindboe Corporation has provided the following financial data:
Balance Sheet
December 31, Year 2 and Year 1
Assets
Year 2
Year 1
Current assets:
Cash
$
190,000
$
190,000
Accounts receivable, net
225,000
210,000
Inventory
172,000
190,000
Prepaid expenses
83,000
70,000
Total current assets
670,000
660,000
Plant and equipment, net
877,000
870,000
Total assets
$
1,547,000
$
1,530,000
Liabilities and Stockholders’ Equity
Current liabilities:
Accounts payable
$
176,000
$
180,000
Accrued liabilities
25,000
30,000
Notes payable, short term
36,000
40,000
Total current liabilities
237,000
250,000
Bonds payable
160,000
160,000
Total liabilities
397,000
410,000
Stockholders’ equity:
Common stock, $2 par value
160,000
160,000
Additional paid-in capital
100,000
100,000
Retained earnings
890,000
860,000
Total stockholders’ equity
1,150,000
1,120,000
Total liabilities & stockholders’ equity
$
1,547,000
$
1,530,000
267
Income Statement
For the Year Ended December 31, Year 2
Sales (all on account)
$
1,220,000
Cost of goods sold
700,000
Gross margin
520,000
Operating expenses
458,286
Net operating income
61,714
Interest expense
12,000
Net income before taxes
49,714
Income taxes (30%)
14,914
Net income
$
34,800
Dividends on common stock during Year 2 totaled $4,800. The market price of common stock at
the end of Year 2 was $5.46 per share.
Required:
a. What is the company’s times interest earned ratio for Year 2?
b. What is the company’s debt-to-equity ratio at the end of Year 2?
c. What is the company’s equity multiplier at the end of Year 2?
d. What is the company’s net profit margin percentage for Year 2?
e. What is the company’s gross margin percentage for Year 2?
f. What is the company’s return on total assets for Year 2?
g. What is the company’s return on equity for Year 2?

270
273) Schepp Corporation has provided the following financial data:
Year 2
Year 1
Total assets
$
1,320,000
$
1,290,000
Total liabilities
$
468,000
$
450,000
Total stockholders’ equity
$
852,000
$
840,000
Income Statement
For the Year Ended December 31, Year 2
Sales (all on account)
$
1,440,000
Cost of goods sold
880,000
Gross margin
560,000
Operating expenses
527,857
Net operating income
32,143
Interest expense
10,000
Net income before taxes
22,143
Income taxes (30%)
6,643
Net income
$
15,500
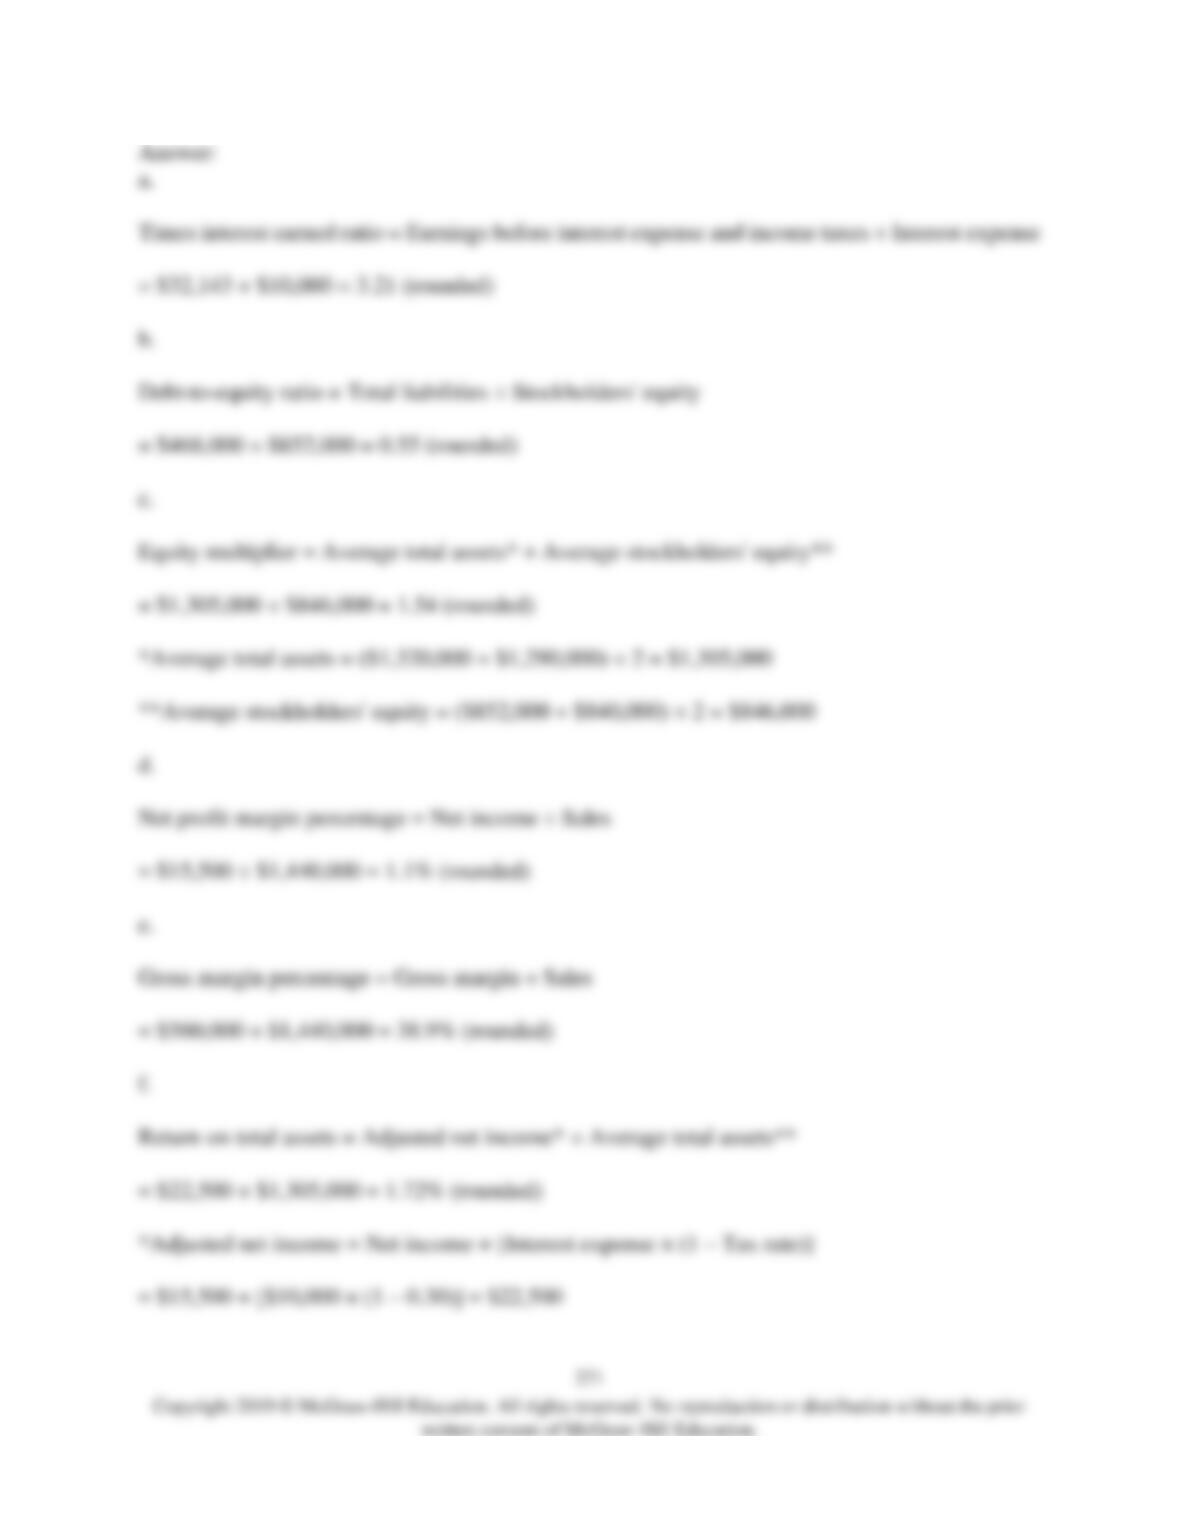
Required:
a. What is the company’s times interest earned ratio for Year 2?
b. What is the company’s debt-to-equity ratio at the end of Year 2?
c. What is the company’s equity multiplier at the end of Year 2?
d. What is the company’s net profit margin percentage for Year 2?
e. What is the company’s gross margin percentage for Year 2?
f. What is the company’s return on total assets for Year 2?
g. What is the company’s return on equity for Year 2?


273
274) Brill Corporation has provided the following financial data:
Year 2
Year 1
Total assets
$
1,360,000
$
1,320,000
Total liabilities
$
601,000
$
570,000
Common stock, $2 par value
$
140,000
$
140,000
Total common stockholders’ equity
$
759,000
$
750,000
Income Statement
For the Year Ended December 31, Year 2
Sales (all on account)
$
1,300,000
Cost of goods sold
900,000
Gross margin
400,000
Operating expenses
364,143
Net operating income
35,857
Interest expense
20,000
Net income before taxes
15,857
Income taxes (30%)
4,757
Net income
$
11,100
Dividends on common stock during Year 2 totaled $2,100. The market price of common stock at
the end of Year 2 was $2.32 per share.
Required:
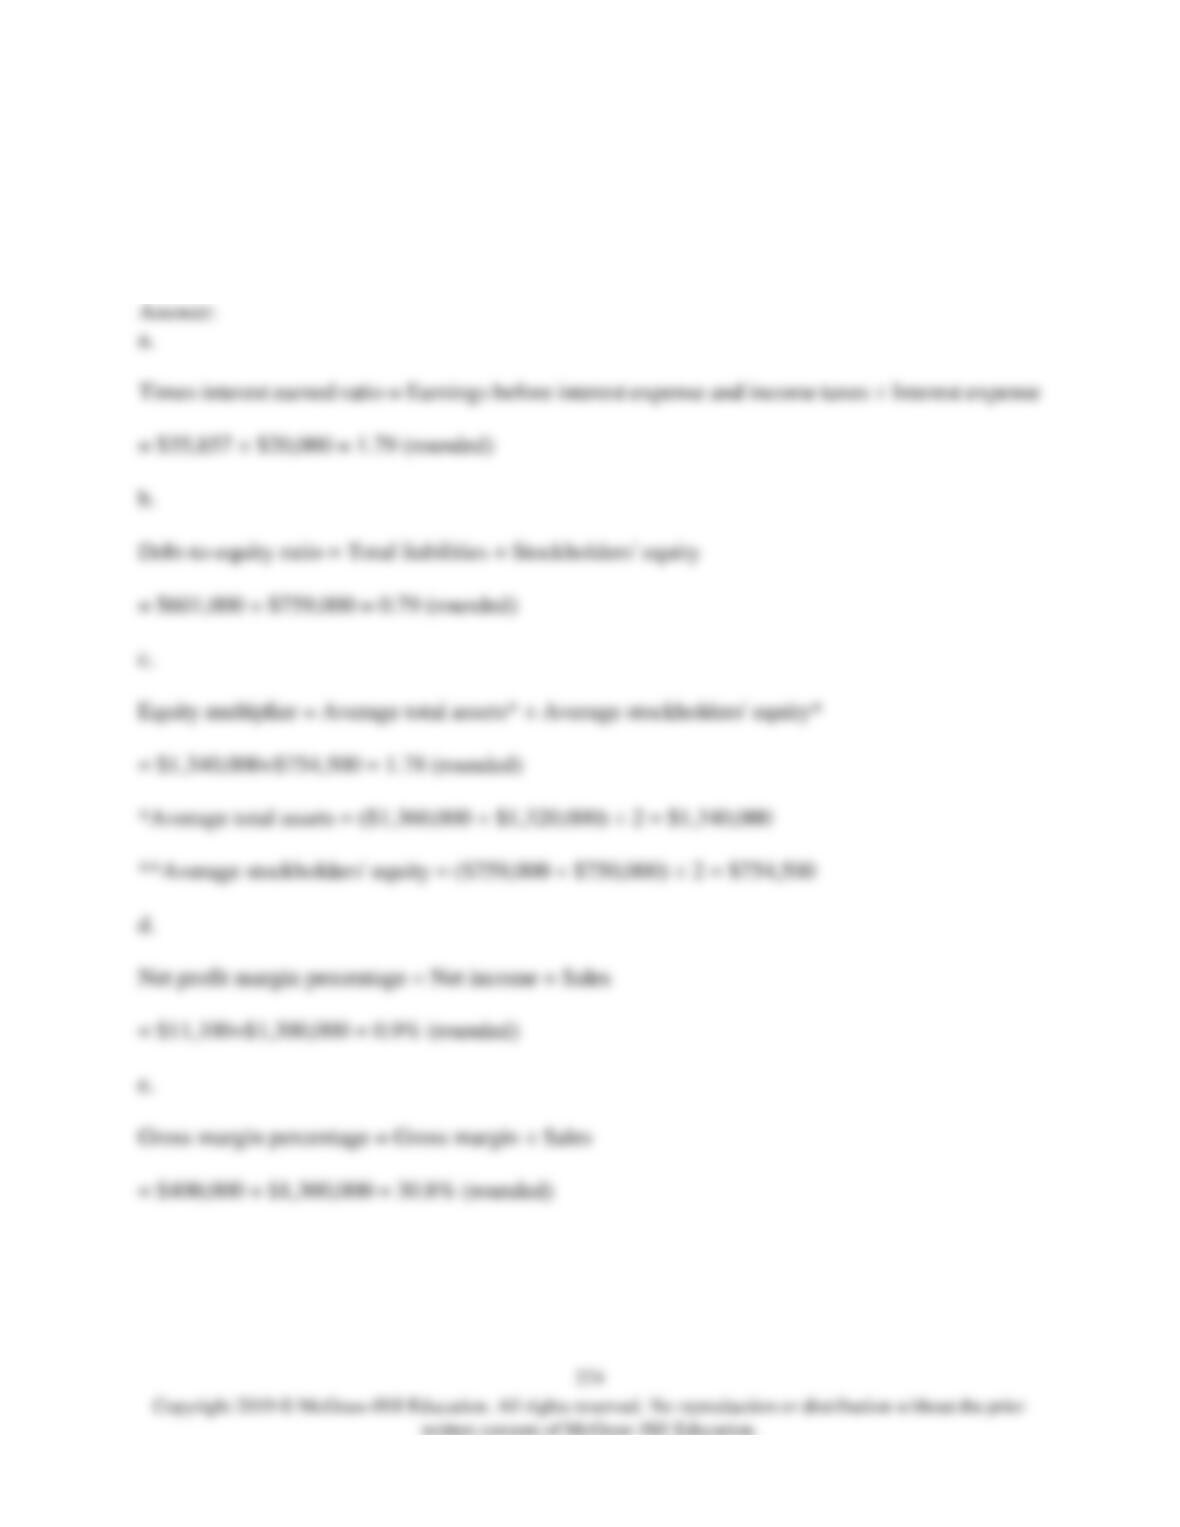
a. What is the company’s times interest earned ratio for Year 2?
b. What is the company’s debt-to-equity ratio at the end of Year 2?
c. What is the company’s equity multiplier at the end of Year 2?
d. What is the company’s net profit margin percentage for Year 2?
e. What is the company’s gross margin percentage for Year 2?
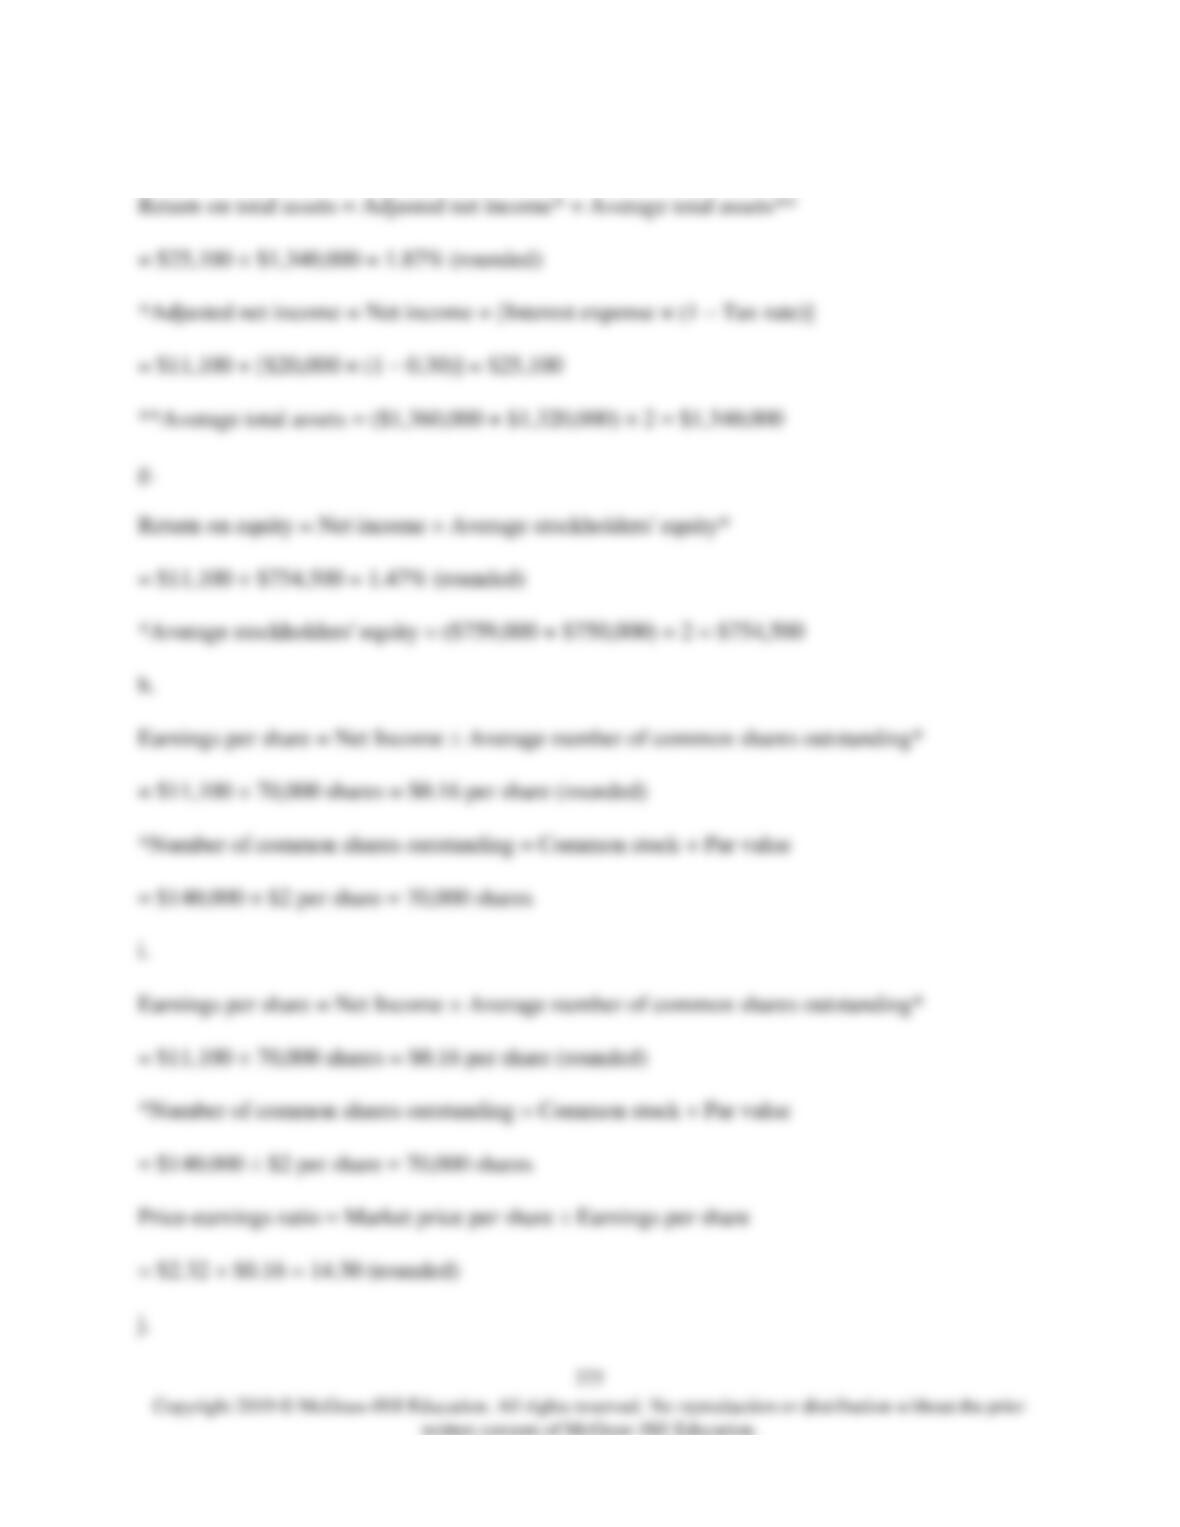
f. What is the company’s return on total assets for Year 2?
g. What is the company’s return on equity for Year 2?
h. What is thecompany’s earnings per share for Year 2?
i. What is the company’s price-earnings ratio for Year 2?
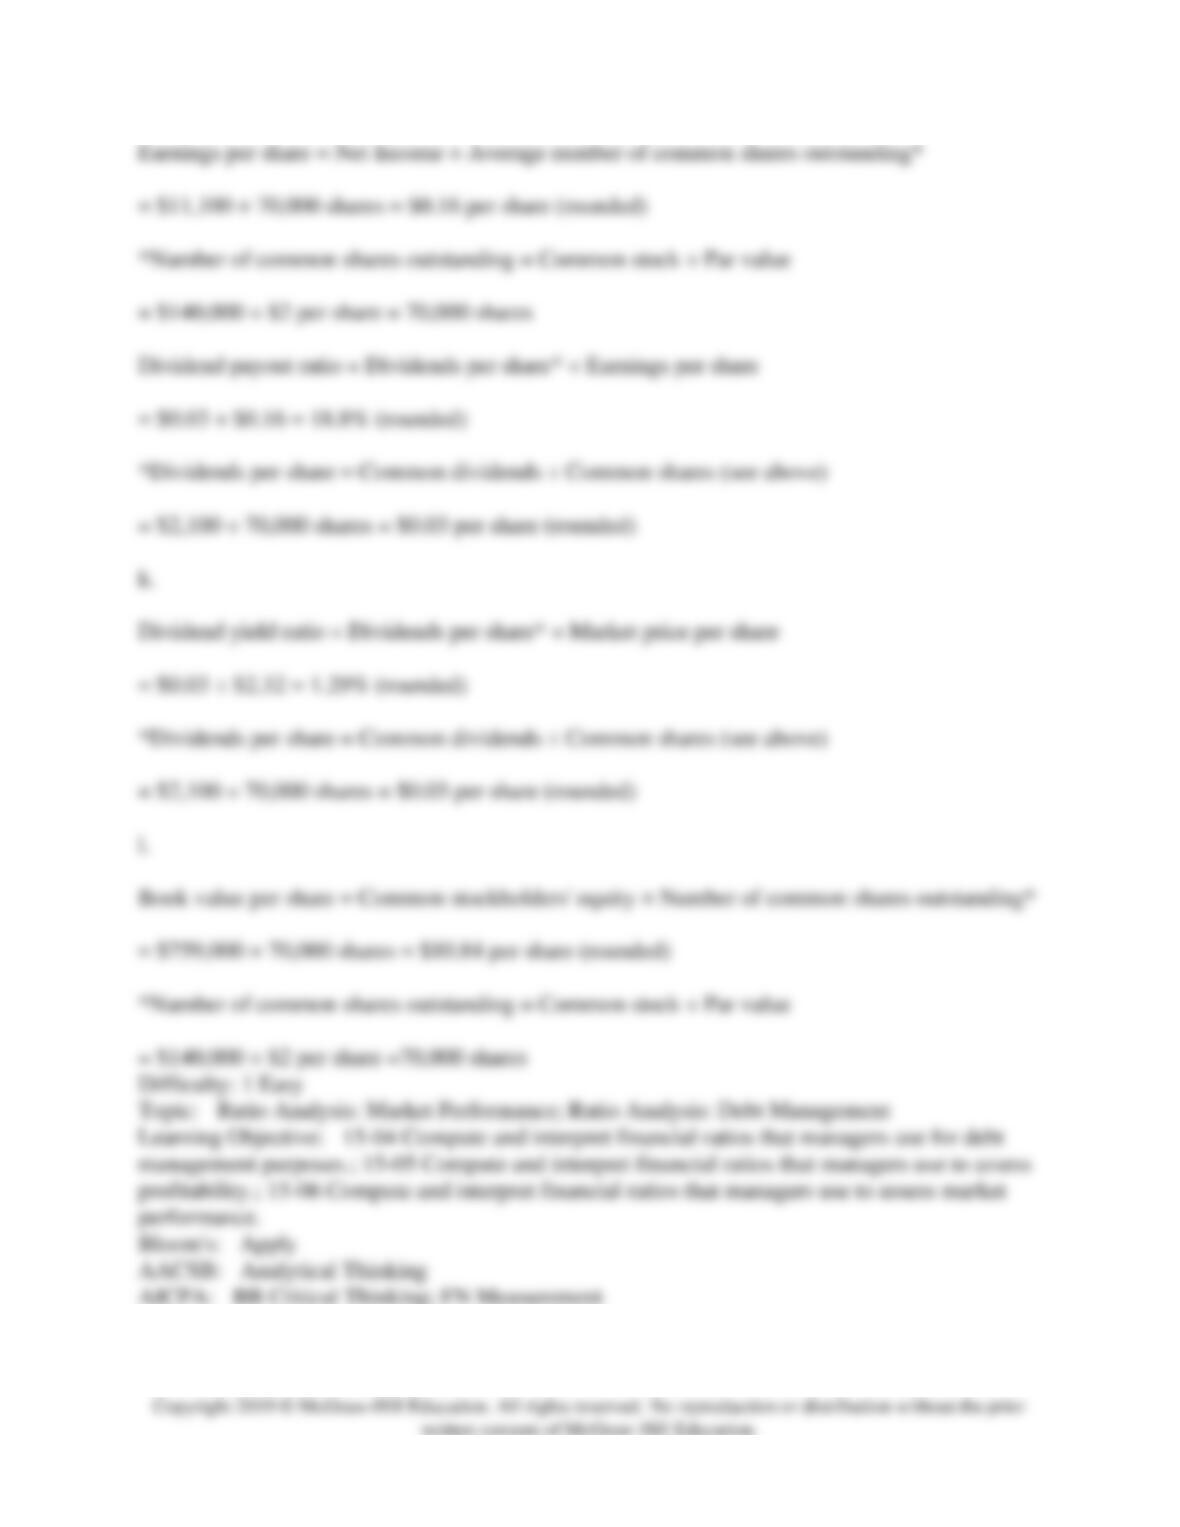
j. What is thecompany’s dividend payout ratio for Year 2?
k. What is thecompany’s dividend yield ratio for Year 2?
l. What is the company’s book value per share at the end of Year 2?
f.
276
275) Jaquez Corporation has provided the following financial data:
277
Year 2
Year 1
Total assets
$
1,466,000
$
1,460,000
Total liabilities
$
573,000
$
590,000
Stockholders’ equity:
Common stock, $3 par value
$
300,000
$
300,000
Additional paid-in capital
60,000
60,000
Retained earnings
533,000
510,000
Total stockholders’ equity
$
893,000
$
870,000
Income Statement
For the Year Ended December 31, Year 2
Sales (all on account)
$
1,450,000
Cost of goods sold
850,000
Gross margin
600,000
Operating expenses
530,231
Net operating income
69,769
Interest expense
19,000
Net income before taxes
50,769
Income taxes (35%)
17,769
Net income
$
33,000
Dividends on common stock during Year 2 totaled $10,000. The market price of common stock at
the end of Year 2 was $5.45 per share.
Required:
a. What is the company’s times interest earned ratio for Year 2?
b. What is the company’s debt-to-equity ratio at the end of Year 2?
c. What is the company’s equity multiplier at the end of Year 2?
d. What is the company’s net profit margin percentage for Year 2?
e. What is the company’s gross margin percentage for Year 2?
f. What is the company’s return on total assets for Year 2?
g. What is the company’s return on equity for Year 2?
h. What is thecompany’s earnings per share for Year 2?
i. What is the company’s price-earnings ratio for Year 2?
j. What is thecompany’s dividend payout ratio for Year 2?
k. What is thecompany’s dividend yield ratio for Year 2?
l. What is the company’s book value per share at the end of Year 2?
f.
j.