
234) The company’s price-earnings ratio for Year 2 is closest to:
A) 0.38
B) 4.53
C) 5.70
D) 8.11
235) The company’s dividend payout ratio for Year 2 is closest to:
A) 1.6%
B) 21.1%
C) 2.6%
D) 14.7%
236) The company’s dividend yield ratio for Year 2 is closest to:
A) 21.1%
B) 2.6%
C) 1.6%
D) 14.7%
237) The company’s book value per share at the end of Year 2 is closest to:
A) $0.38 per share
B) $8.18 per share
C) $18.08 per share
D) $13.93 per share
184
Symons Corporation has provided the following financial data:
Balance Sheet
December 31, Year 2 and Year 1
Assets
Year 2
Year 1
Current assets:
Cash
$
225,000
$
160,000
Accounts receivable, net
191,000
180,000
Inventory
96,000
110,000
Prepaid expenses
91,000
80,000
Total current assets
603,000
530,000
Plant and equipment, net
810,000
840,000
Total assets
$
1,413,000
$
1,370,000
Liabilities and Stockholders’ Equity
Current liabilities:
Accounts payable
$
226,000
$
190,000
Accrued liabilities
66,000
70,000
Notes payable, short term
54,000
50,000
Total current liabilities
346,000
310,000
Bonds payable
170,000
170,000
Total liabilities
516,000
480,000
Stockholders’ equity:
Common stock, $5 par value
250,000
250,000
Additional paid-in capital
70,000
70,000
Retained earnings
577,000
570,000
Total stockholders’ equity
897,000
890,000
Total liabilities & stockholders’ equity
$
1,413,000
$
1,370,000
Income Statement
For the Year Ended December 31
Sales (all on account)
$
1,260,000
Cost of goods sold
760,000
Gross margin
500,000
Operating expenses
473,429
Net operating income
26,571
Interest expense
13,000
Net income before taxes
13,571
Income taxes (30%)
4,071
Net income
$
9,500
Dividends on common stock during Year 2 totaled $2,500. The market price of common stock at
the end of Year 2 was $2.01 per share.
238) The company’s earnings per share for Year 2 is closest to:
A) $0.53 per share
B) $11.54 per share
C) $0.19 per share
D) $0.27 per share
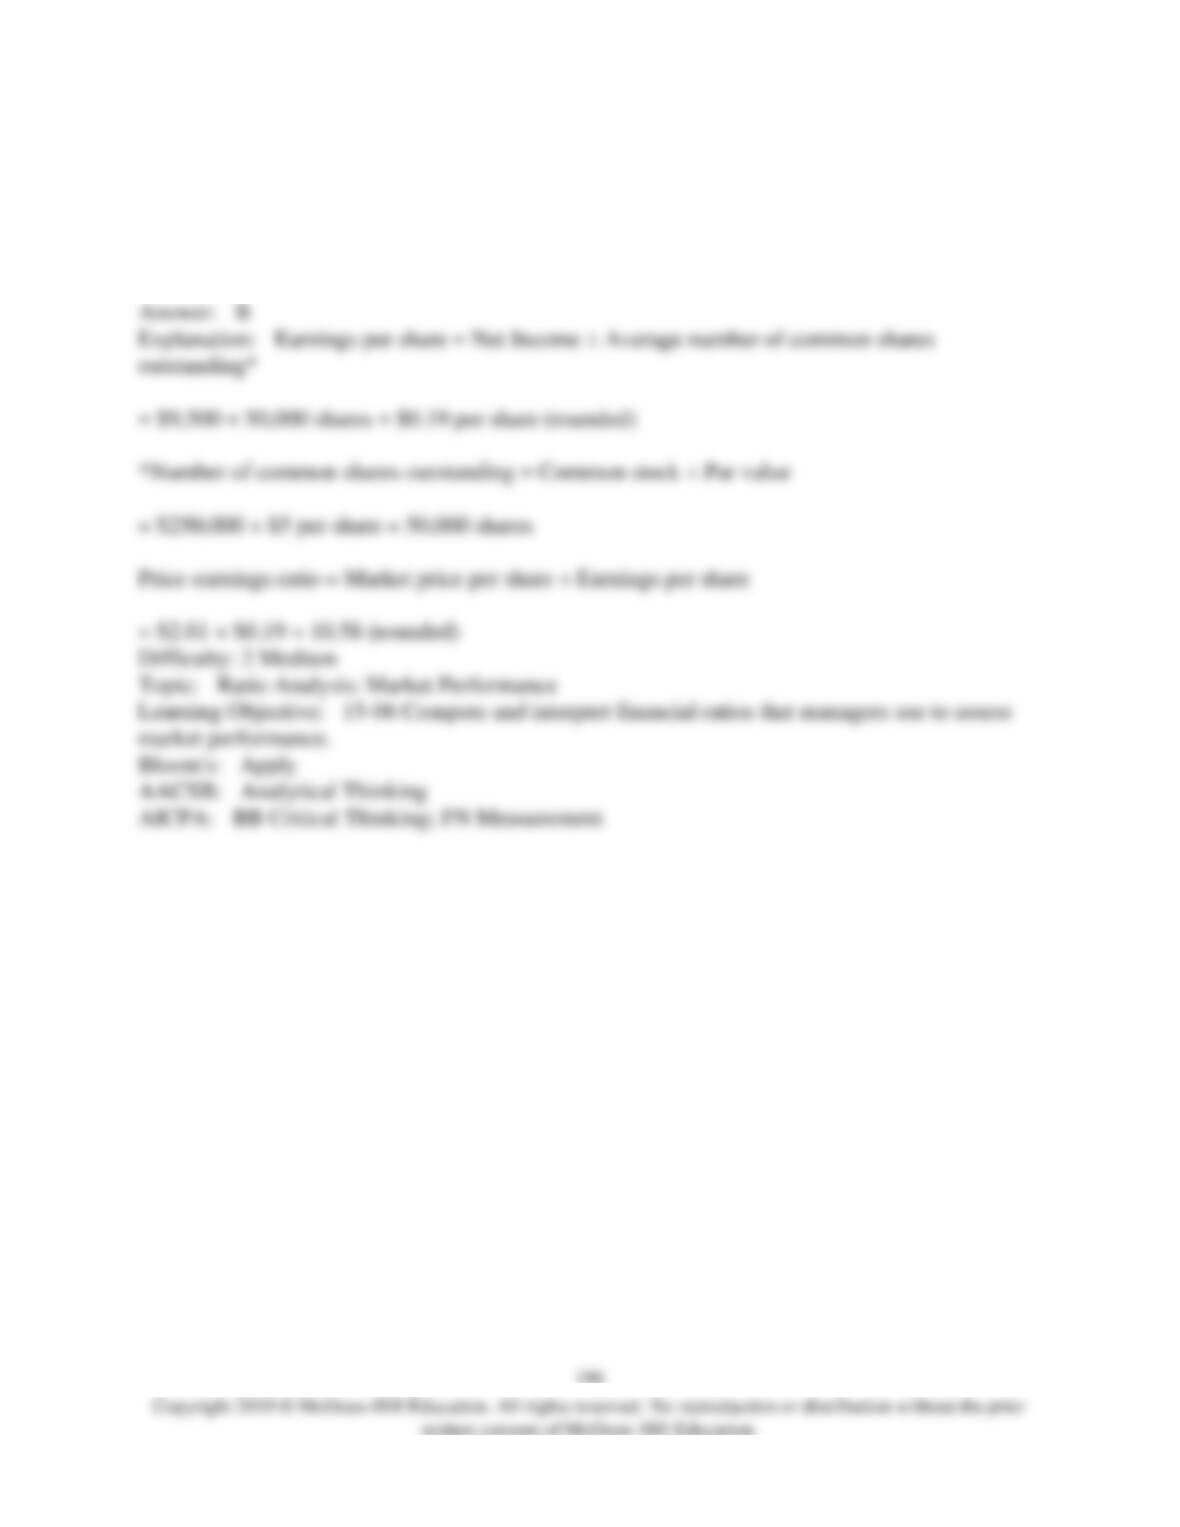
239) The company’s price-earnings ratio for Year 2 is closest to:
A) 3.79
B) 10.58
C) 0.17
D) 7.44

240) The company’s dividend payout ratio for Year 2 is closest to:
A) 26.3%
B) 2.5%
C) 18.4%
D) 1.0%
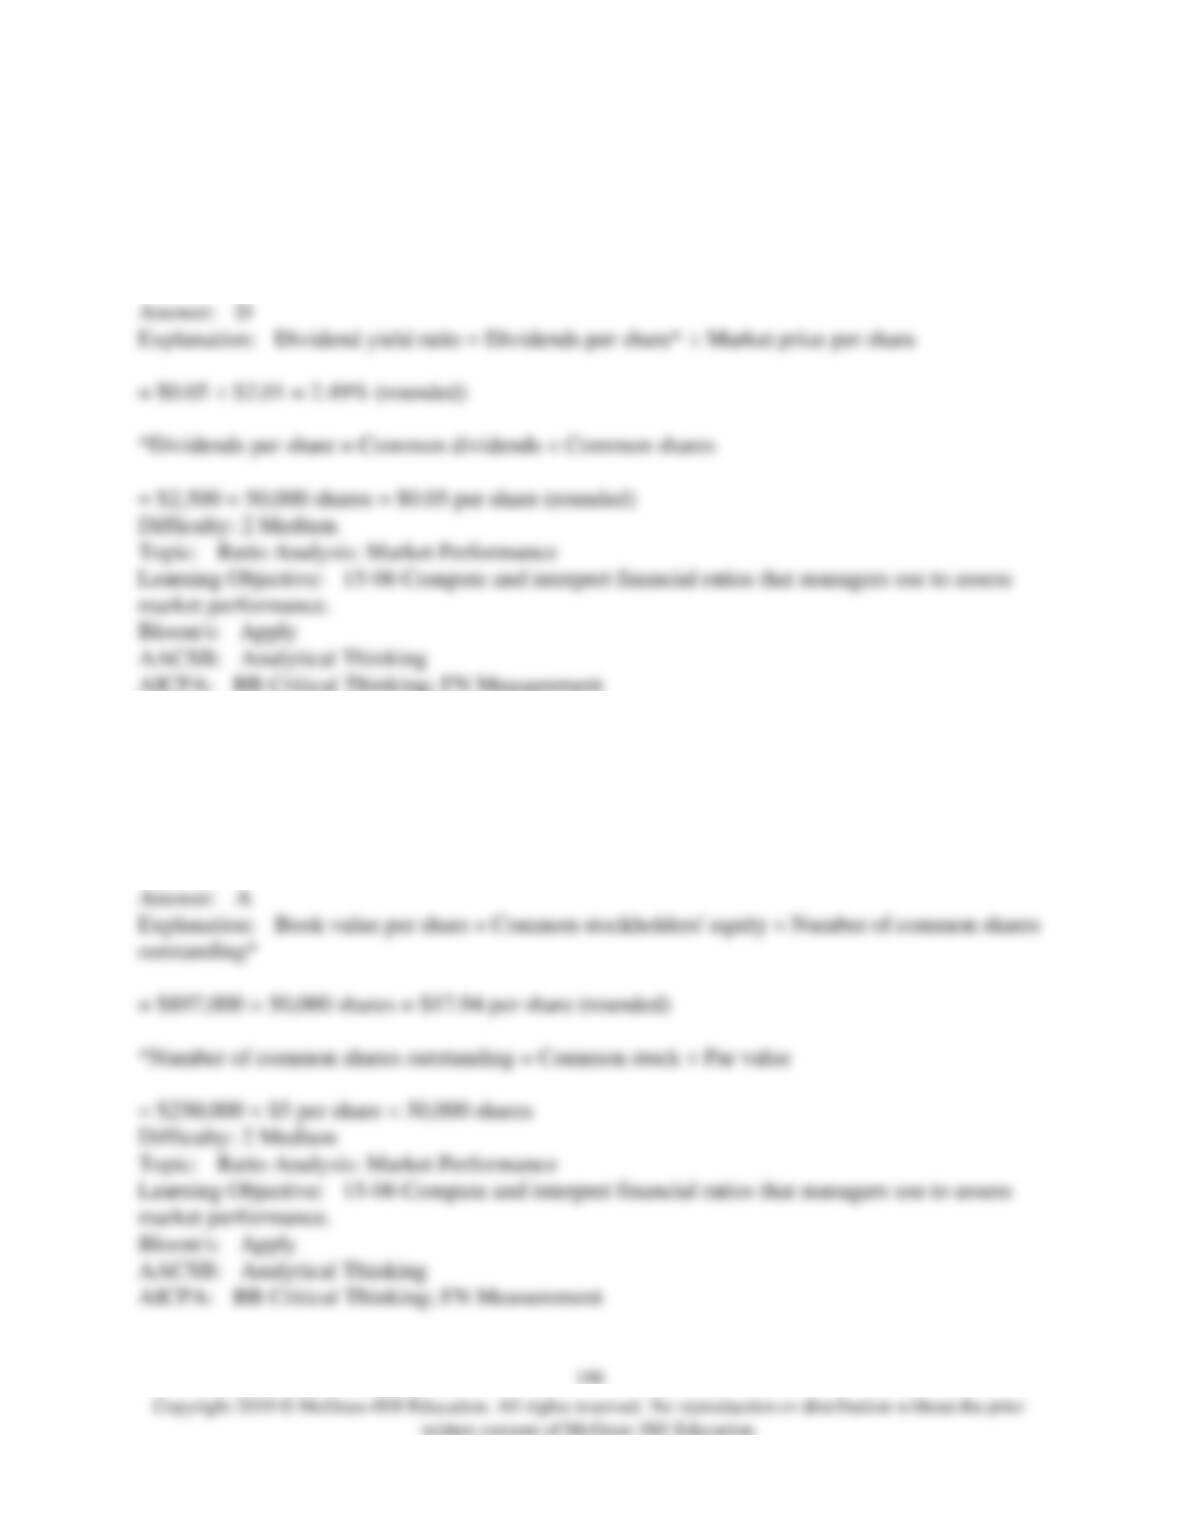
241) The company’s dividend yield ratio for Year 2 is closest to:
A) 1.0%
B) 18.4%
C) 26.3%
D) 2.5%
242) The company’s book value per share at the end of Year 2 is closest to:
A) $17.94 per share
B) $28.26 per share
C) $0.19 per share
D) $11.54 per share
189
243) Rubendall Corporation’s total current assets are $310,000, its noncurrent assets are $630,000,
its total current liabilities are $250,000, its long-term liabilities are $300,000, and its stockholders’
equity is $390,000.
Required:
Compute the company’s current ratio. Show your work!
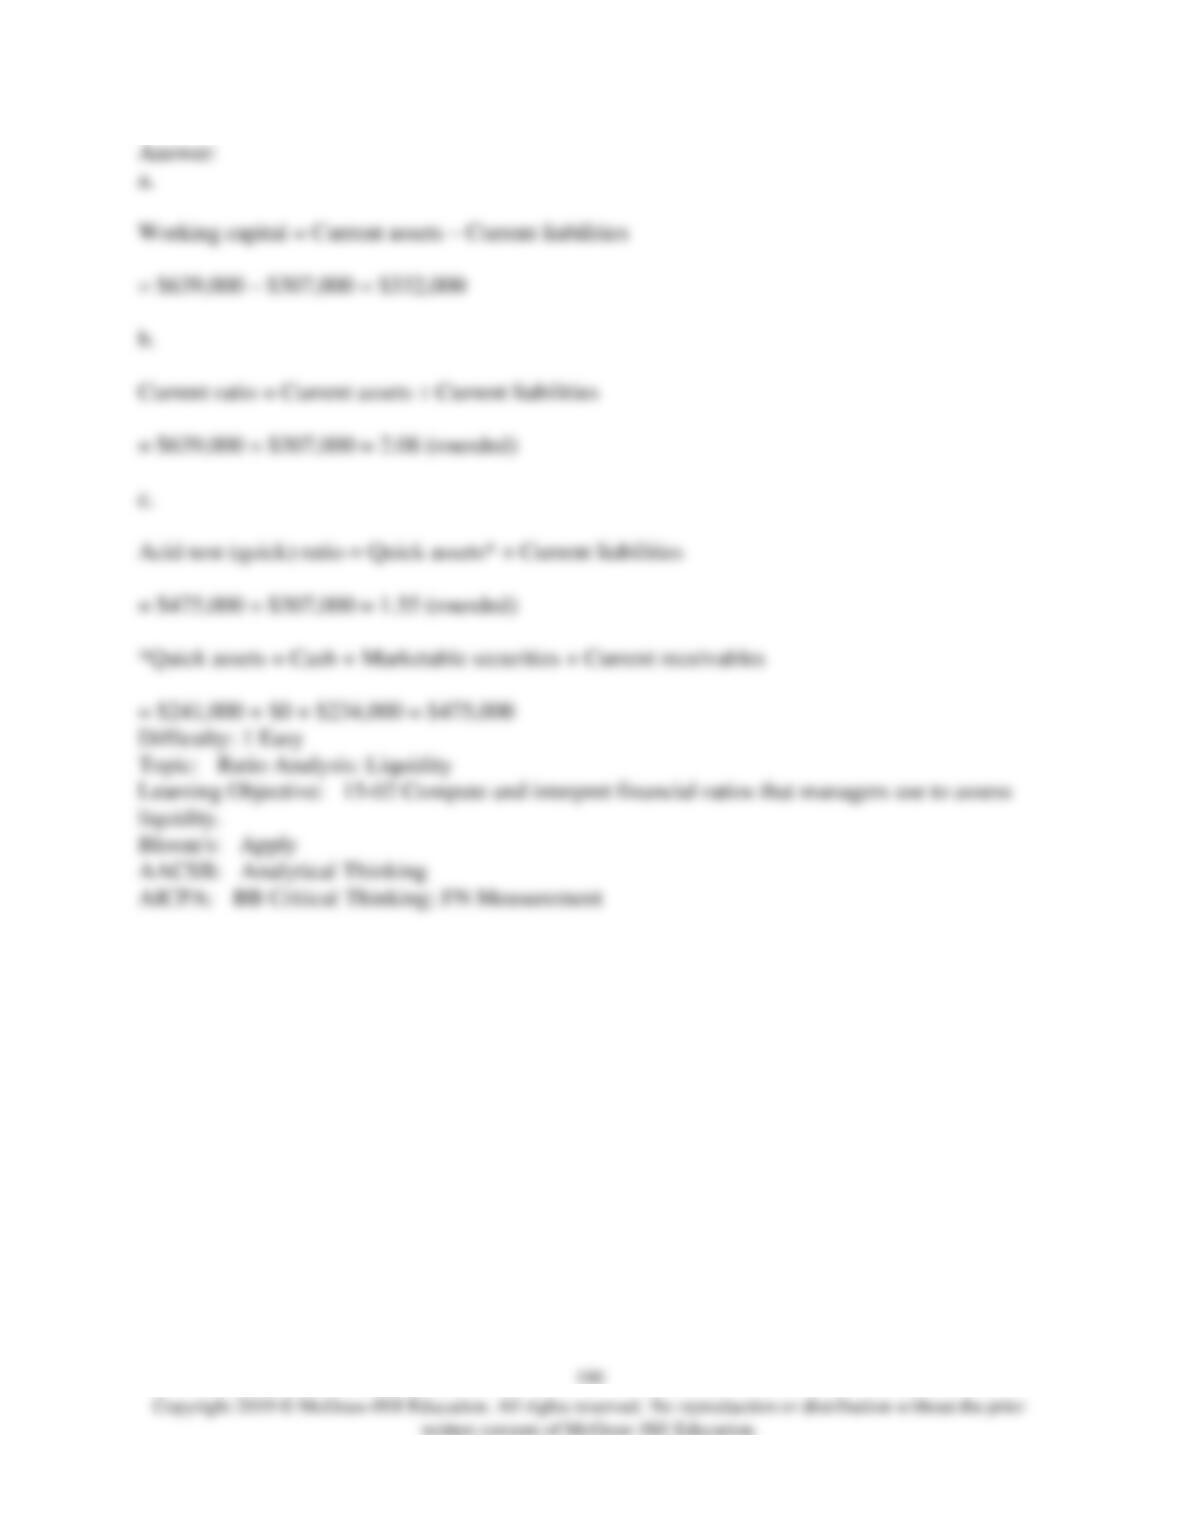
244) Gremel Corporation has provided the following financial data:
Current assets:
Cash
$
241,000
Accounts receivable, net
$
234,000
Inventory
$
119,000
Prepaid expenses
$
45,000
Total current assets
$
639,000
Current liabilities:
Accounts payable
$
163,000
Accrued liabilities
$
87,000
Notes payable, short term
$
57,000
Total current liabilities
$
307,000
Required:
a. What is the company’s working capital?
b. What is the company’s current ratio?
c. What is the company’s acid-test (quick) ratio?
245) Steinkraus Corporation has provided the following data:
This Year
Last Year
Accounts receivable, net
$
104,000
$
115,000
Inventory
$
195,000
$
174,000
Sales on account
$
886,000
Cost of goods sold
$
622,000
Required:
Compute the accounts receivable turnover for this year. Show your work!
246) Arkin Corporation’s total current assets are $290,000, its noncurrent assets are $520,000, its
total current liabilities are $210,000, its long-term liabilities are $420,000, and its stockholders’
equity is $180,000.
Required:
Compute the company’s working capital. Show your work!
193
247) Wowk Corporation has provided the following financial data:
Assets
Current assets:
Cash
$
133,000
Accounts receivable, net
157,000
Inventory
215,000
Prepaid expenses
24,000
Total current assets
529,000
Plant and equipment, net
768,000
Total assets
$
1,297,000
Liabilities and Stockholders’ Equity
Current liabilities:
Accounts payable
$
95,000
Accrued liabilities
18,000
Notes payable, short term
90,000
Total current liabilities
203,000
Bonds payable
110,000
Total liabilities
313,000
Stockholders’ equity:
Common stock, $4 par value
200,000
Additional paid-in capital
80,000
Retained earnings
704,000
Total stockholders’ equity
984,000
Total liabilities & stockholders’ equity
$
1,297,000
Required:
a. What is the company’s working capital?
b. What is the company’s current ratio?
c. What is the company’s acid-test (quick) ratio?
248) Data from Yochem Corporation’s most recent balance sheet appear below:
Cash
$
16,000
Marketable securities
$
24,000
Accounts receivable, net
$
39,000
Inventory
$
53,000
Prepaid expenses
$
11,000
Current liabilities
$
109,000
Required:
Compute the company’s acid-test (quick) ratio. Show your work!
196
249) Excerpts from Candle Corporation’s most recent balance sheet (in thousands of dollars)
appear below:
Year 2
Year 1
Current assets:
Cash
$
160
$
100
Accounts receivable, net
190
190
Inventory
140
130
Prepaid expenses
90
90
Total current assets
$
580
$
510
Current liabilities:
Accounts payable
$
200
$
180
Accrued liabilities
30
30
Notes payable, short term
90
80
Total current liabilities
$
320
$
290
Sales on account during the year totaled $1,200 thousand. Cost of goods sold was $800 thousand.
Required:
Compute the following for Year 2:
a. Working capital.
b. Current ratio.
c. Acid-test (quick) ratio.
d. Accounts receivable turnover.
e. Average collection period.
f. Inventory turnover.
g. Average sale period.
199
250) Wegener Corporation’s most recent balance sheet and income statement appear below:
Balance Sheet
December 31, Year 2 and Year 1
(in thousands of dollars)
Assets
Year 2
Year 1
Current assets:
Cash
$
90
$
110
Accounts receivable, net
220
270
Inventory
130
150
Prepaid expenses
70
80
Total current assets
510
610
Plant and equipment, net
1,000
920
Total assets
$
1,510
$
1,530
Liabilities and Stockholders’ Equity
Current liabilities:
Accounts payable
$
90
$
110
Accrued liabilities
60
60
Notes payable, short term
50
60
Total current liabilities
200
230
Bonds payable
130
140
Total liabilities
330
370
Stockholders’ equity:
Common stock, $1 par value
400
400
Additional paid-in capital
240
240
Retained earnings
540
520
Total stockholders’ equity
1,180
1,160
Total liabilities & stockholders’ equity
$
1,510
$
1,530
200
Income Statement
For the Year Ended December 31, Year 2
(in thousands of dollars)
Sales (all on account)
$
1,400
Cost of goods sold
860
Gross margin
540
Selling and administrative expense
450
Net operating income
90
Interest expense
19
Net income before taxes
71
Income taxes (30%)
21
Net income
$
50
Required:
Compute the following for Year 2:
a. Working capital.
b. Current ratio.
c. Acid-test (quick) ratio.
d. Accounts receivable turnover.
e. Average collection period.
f. Inventory turnover.
g. Average sale period.