Chapter 15
119. Starbuck Corporation had net income of $250,000 and paid dividends to common stockholders of $50,000 in Year 1.
The weighted average number of shares outstanding in Year 1 was 50,000 shares. Starbuck Corporation’s common stock
is selling for $40 per share on the New York Stock Exchange.
Starbuck’s dividend payout ratio for Year 1 is
a. $5 per share.
b. 0.25.
c. 0.20.
d. 0.125.
120. Goslier Company’s net income last year was $130,000. The company paid preferred dividends of $42,000 and its
average common stockholders’ equity was $610,000. The company’s return on common stockholders’ equity for the year
was closest to
a. 15.8%.
b. 28.1%.
c. 21.3%.
d. 14.4%.
Chapter 15
121. Pearl Company has 80,000 shares of common stock and 40,000 shares of preferred stock outstanding. There was no
change in the number of common or preferred shares outstanding during the year. Preferred stockholders received
dividends totaling $150,000 in the year. Common stockholders received dividends totaling $300,000. If the dividend
payout ratio for the year was 40%, then the net income was:
a. $620,000.
b. $900,000.
c. $760,000.
d. $330,000.
122. Refer to the information taken from a company’s financial records for the current year:
Earnings per share $5.00
Market price per share $60.00
Dividend per share $4.00
Book value per share $40.00
The price-earnings ratio is:
a. 12.
b. 10.
c. 18.
d. 20.
Chapter 15
123. Last year the return on total assets in Justin Company was 8.5%. The total assets were $2,900,000 at the beginning of
the year and $3,100,000 at the end of the year. The tax rate was 30%, interest expense totaled $110,000, and sales were
$5,200,000. Net income for the year was
a. $145,000.
b. $222,000.
c. $332,000.
d. $178,000.
124. Dowling Company’s net income last year was $40,000 and its interest expense was $8,000. Total assets at the
beginning of the year were $260,000 and total assets at the end of the year were $315,000. The company’s income tax rate
was 35%. The company’s return on total assets for the year was closest to
Chapter 15
a. 14.5%.
b. 15.7%.
c. 16.7%.
d. 7.9%.
125. Selected financial data from Harlow Company for the most recent year appear below:
Sales $100,000
Cost of goods sold $60,000
Dividends declared and paid $5,000
Interest expense $8,000
Operating expenses $18,000
The income tax rate is 30%.
The return on sales ratio was closest to
a. 14%.
b. 40%.
c. 22%.
d. 10%.
Chapter 15
126. Clover Company’s net income last year was $80,000. The company paid preferred dividends of $12,000 and its
average common stockholders’ equity was $340,000. The company’s return on common stockholders’ equity for the year
was closest to
a. 27.1%.
b. 3.5%.
c. 20.0%.
d. 23.5%.
127. The average stockholders’ equity for Holloway Co. last year was $2,000,000. Included in this figure was $200,000
par value of 8% preferred stock. If the return on common stockholders’ equity was 12.5% for the year, net income was
a. $225,000.
b. $250,000.
c. $241,000.
d. $234,000.
Chapter 15
128. Wellston Company’s net income last year was $300,000. The company has 100,000 shares of common stock and
30,000 shares of preferred stock outstanding. There was no change in the number of common or preferred shares
outstanding during the year. The company declared and paid dividends last year of $1.90 per share on the common stock
and $1.70 per share on the preferred stock. The earnings per share of common stock is closest to
a. $2.49.
b. $1.10.
c. $3.51.
d. $3.00.
129. Ruby Company’s net income was $100,000 last year. The company has 25,000 shares of common stock and 6,000
shares of $50 par value, 6% preferred stock outstanding. There was no change in the number of common or preferred
shares outstanding during the year. The earnings per share of common stock was:
a. $9.12.
b. $7.63.
c. $3.28.
Chapter 15
d. $2.35.
130. Refer to the information given below for Bronze Company’s common stock:
Book value per share $27.00
Market value per share $20.00
Earnings per share $5.00
Par value per share $3.00
Dividend per share $2.00
The price-earnings ratio would be
a. 5.0.
b. 2.0.
c. 4.0.
d. 6.0.
Chapter 15
131. Bogart Company has 40,000 shares of common stock outstanding. The book value per share of this stock was $60
and the market value per share was $75 at the end of the year. Net income for the year was $400,000. Interest on long-
term debt was $40,000. Dividends paid to common stockholders were $3 per share. The tax rate was 30%. The company’s
price-earnings ratio at the end of the year was
a. 7.5.
b. 20.
c. 25.
d. 6.
132. A common measure of profitability is
a. the quick ratio.
b. times-interest-earned ratio.
c. return on common stockholders’ equity ratio.
d. debt ratio.
Chapter 15
133. Which of the following is used to compute return on sales?
a. Sales / Equity
b. Sales / Debt
c. Gross Profit / Sales
d. Net Income / Sales
134. Profitability ratios include _____.
a. return on sales
b. days’ sales in inventory
c. the quick ratio
d. the debt-to-equity ratio
Chapter 15
135. Which profitability ratio requires the use of earnings per share in its calculation?
a. price-earnings ratio
b. return on common stockholders’ equity
c. dividend yield
d. return on sales
136. Which profitability ratio requires the use of earnings per share and the current market price?
a. return on common stockholders’ equity
b. dividend payout ratio
c. dividend yield
d. price-earnings ratio
Chapter 15
137. Earnings per share is an indication of how much
a. the company paid as dividends for each share of stock.
b. the company earned for each share of outstanding common and preferred stock.
c. the company earned for each share of outstanding common stock.
d. cash the company has for each share of all outstanding stock.
138. Chaney Inc. wants to measure the relationship between profitability and the investment made by stockholders.
Chaney should use
a. return on common stockholders’ equity.
b. earnings per share.
c. return on sales.
d. the statement of retained earnings.
Chapter 15
139. Which of the following is an effect of issue of shares for cash?
a. The return on sales increases.
b. The quick ratio increases.
c. The debt-to–equity ratio increases.
d. The receivables turnover ratio increases.
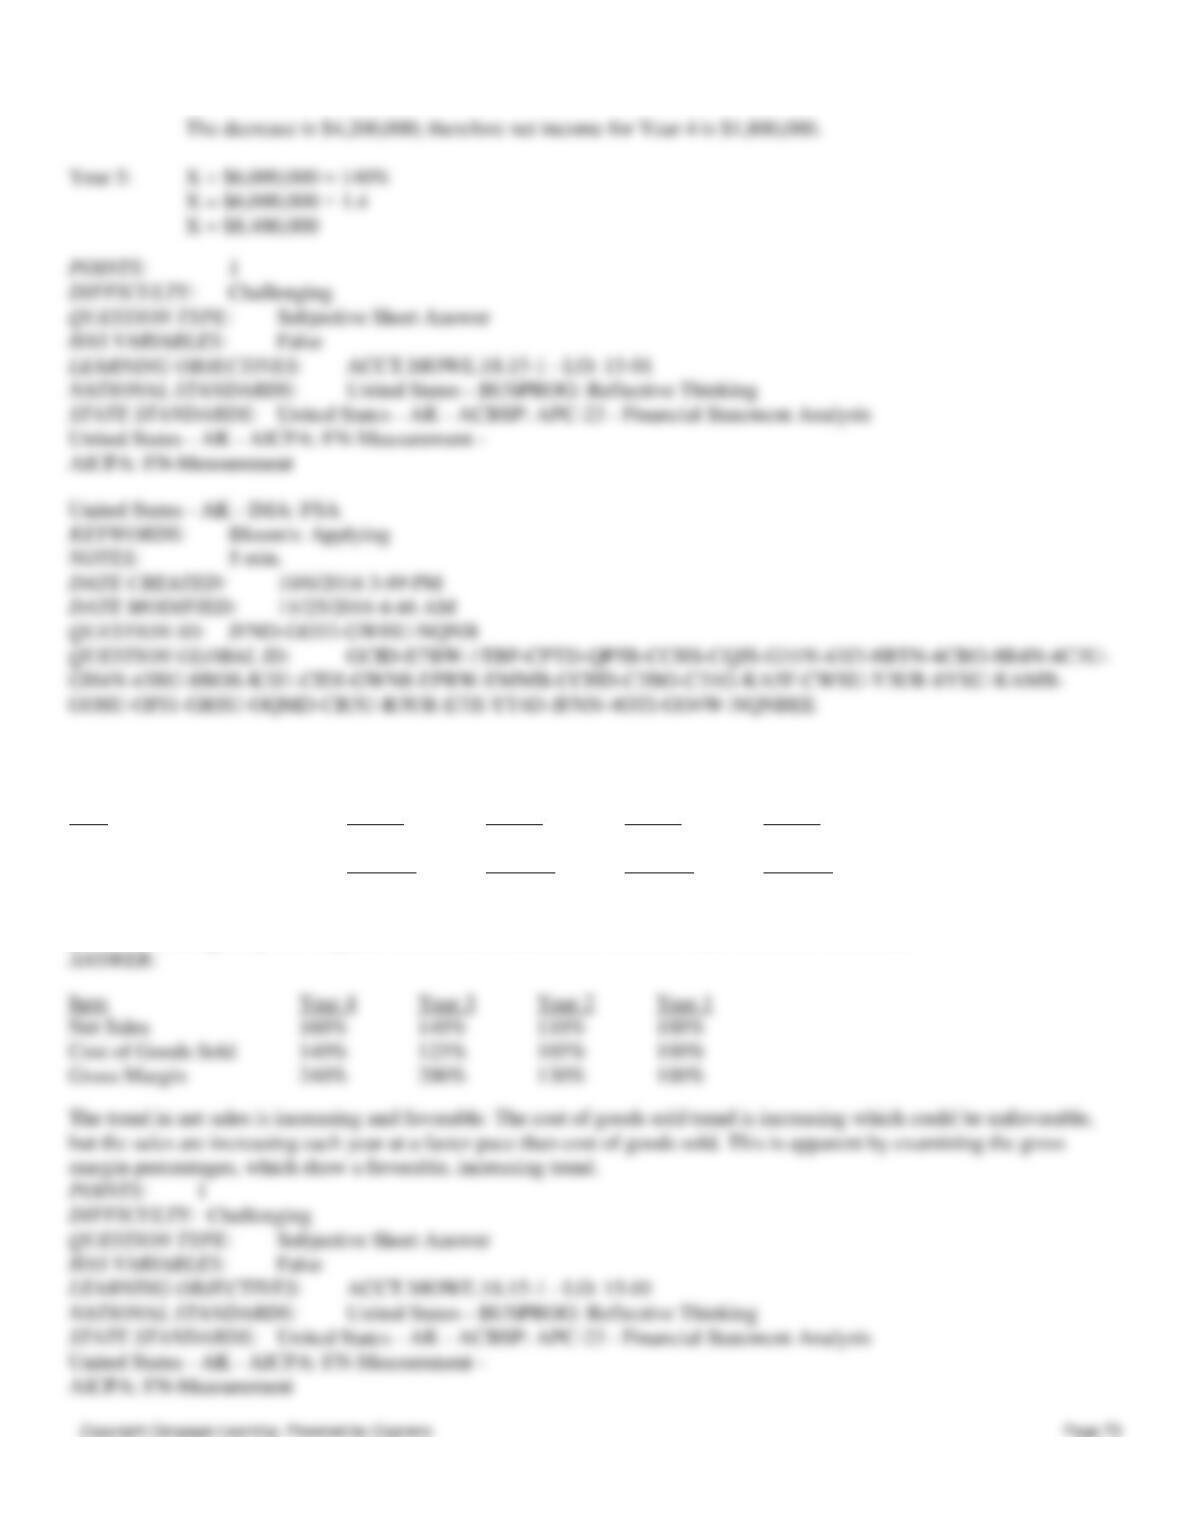
140. Eaton Corporation had net income of $6,000,000 in Year 1. Using Year 1 as the base year, net income decreased by
70% in Year 4 and increased by 140% in Year 5.
Required: Compute the net income reported by Eaton Corporation for Year 4 and Year 5.
Chapter 15
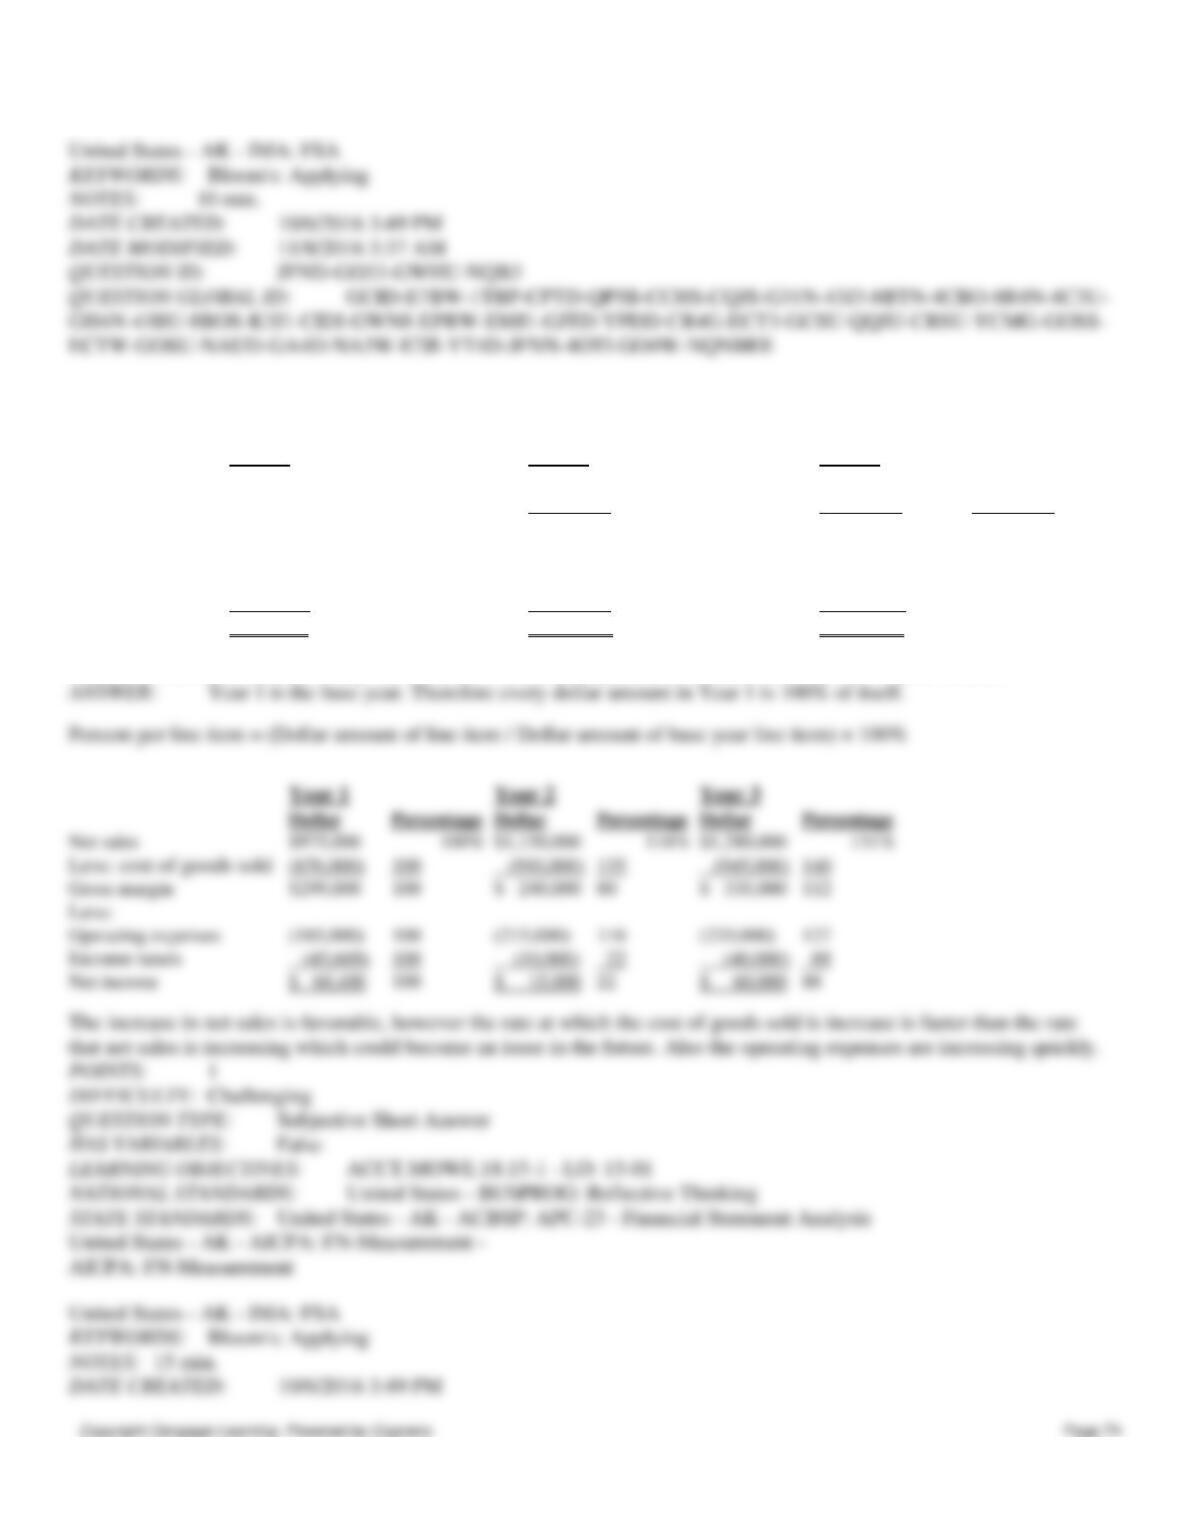
141. The following items were taken from the financial statements of Ritz Inc., over a 4-year period:
Item Year 4 Year 3 Year 2 Year 1
Net Sales $800,000 $700,000 $550,000 $500,000
Cost of Goods Sold 560,000 500,000 420,000 400,000
Gross Margin $240,000 $200,000 $130,000 $100,000
Required: Using horizontal analysis and Year 1 as the base year, compute the trend percentages for net sales, cost of
goods sold, and gross profit. Explain whether the trends are favorable or unfavorable for each item.
Chapter 15
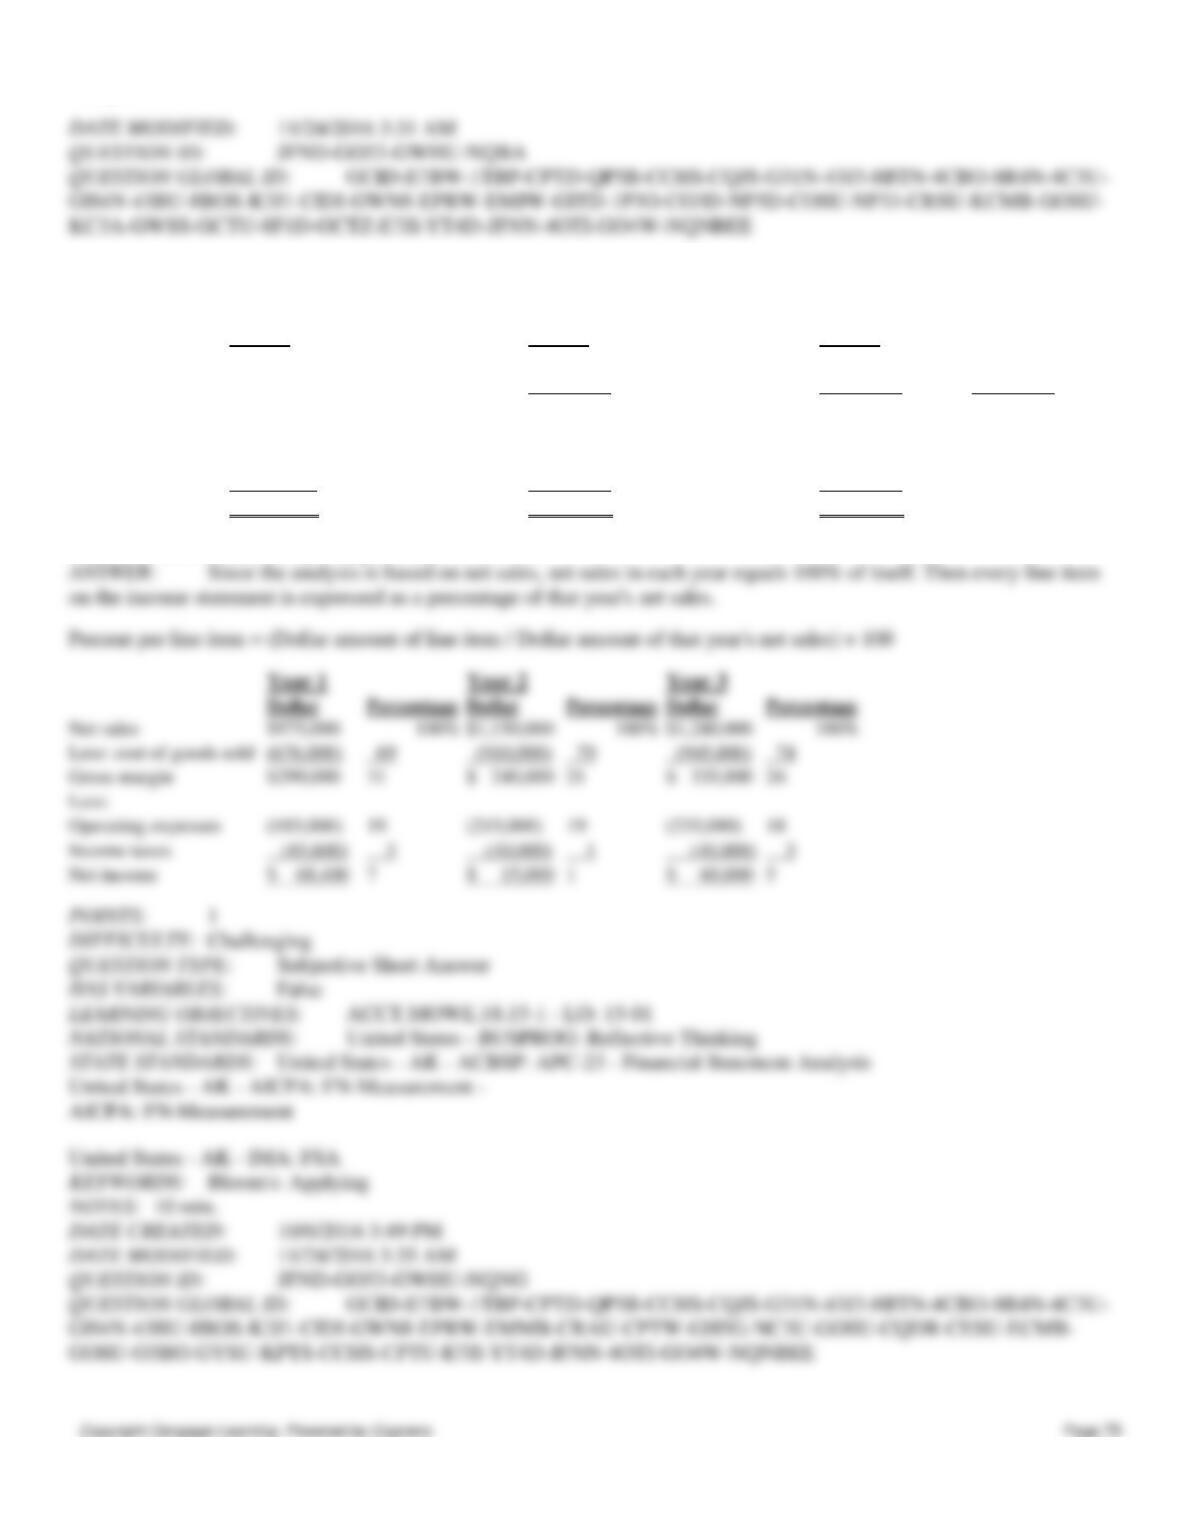
142. London Company provided the following income statements for its first 3 years of operation:
Year 1 Year 2 Year 3
Net sales $975,000 $1,150,000 $1,280,000
Less: cost of goods sold (676,000) (910,000) (945,000)
Gross margin $299,000 $ 240,000 $ 335,000
Less:
Operating expenses (185,000) (215,000) (235,000)
Income taxes (45,600) (10,000) (40,000)
Net income $68,400 $ 15,000 $ 60,000
Prepare a horizontal analysis using Year 1 as the base year. Explain if the results are favorable or unfavorable.
Chapter 15
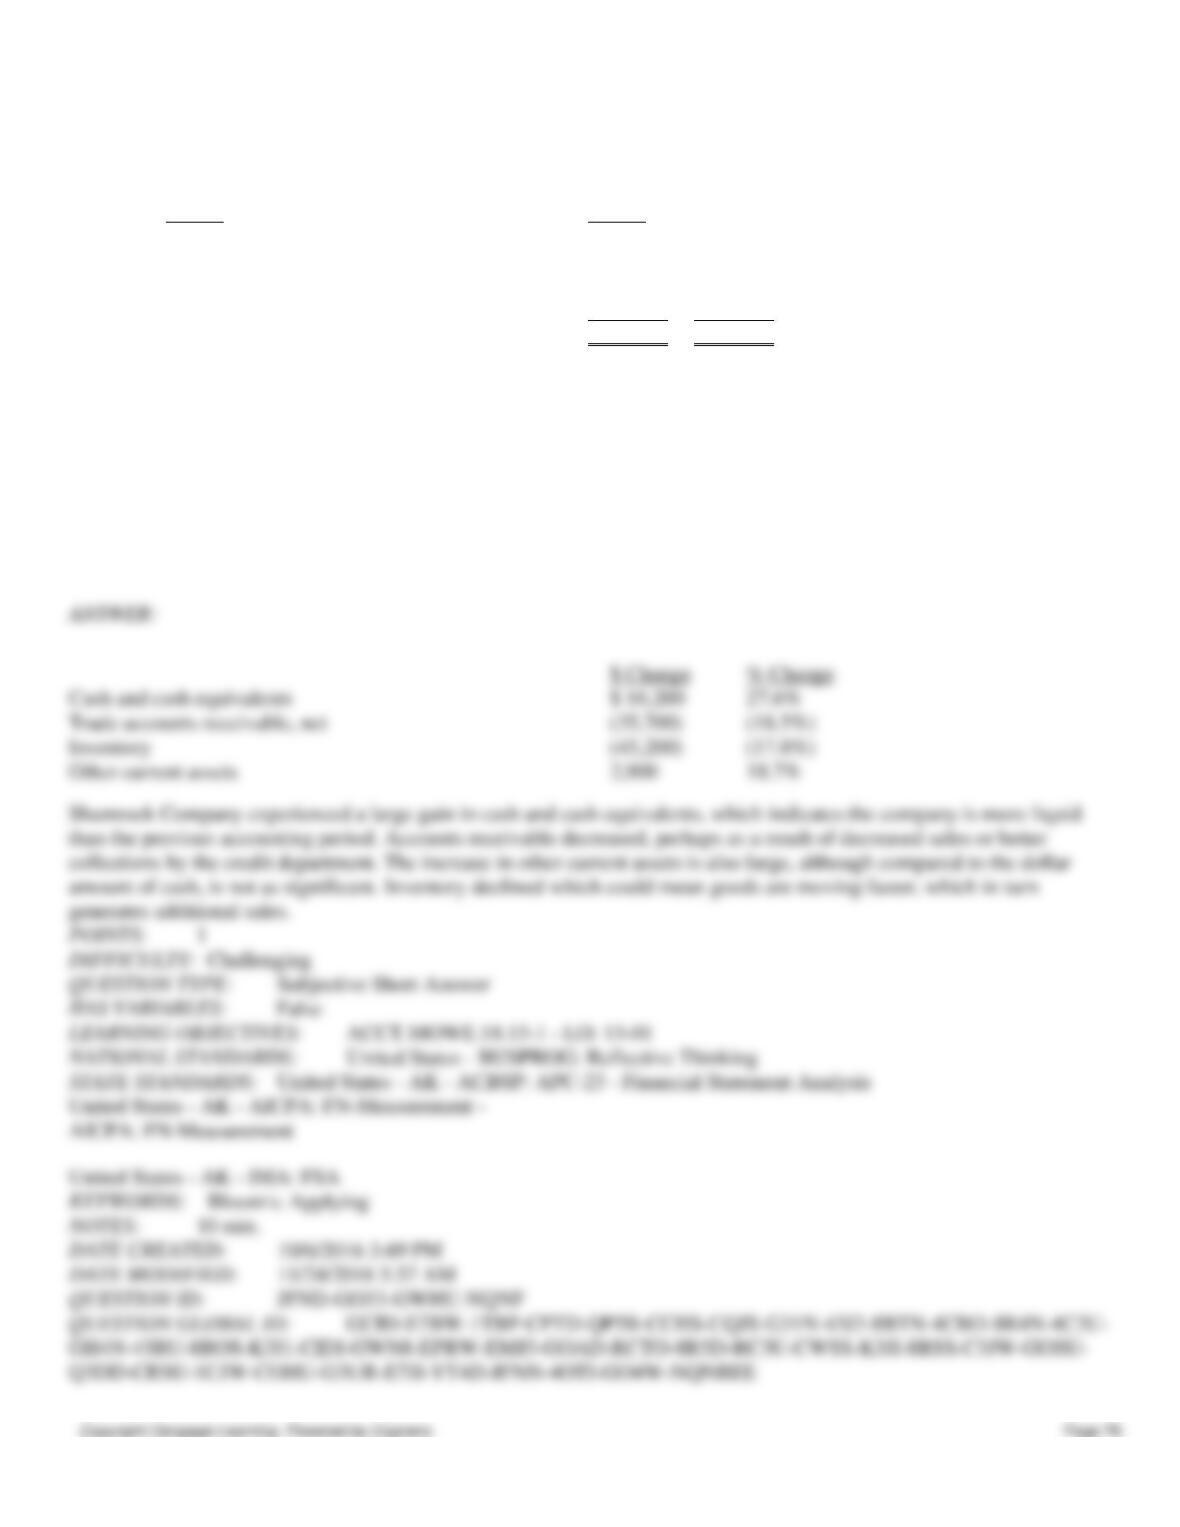
143. London Company provided the following income statements for its first 3 years of operation:
Year 1 Year 2 Year 3
Net sales $975,000 $1,150,000 $1,280,000
Less: cost of goods sold (676,000) (910,000) (945,000)
Gross margin $299,000 $ 240,000 $ 335,000
Less:
Operating expenses (185,000) (215,000) (235,000)
Income taxes (45,600) (10,000) (40,000)
Net income $68,400 $ 15,000 $ 60,000
Prepare a vertical analysis by using net sales as the base.
Chapter 15
144. The current asset section of the balance sheets of the Shamrock Company as of June 30, Year 2 and Year 1 is
presented below.
Year 2 Year 1
Cash and cash equivalents $ 75,000 $ 58,800
Trade accounts receivable, net 157,500 193,200
Inventory 208,200 253,400
Other current assets 18,400 15,500
Total current assets $459,100 $520,900
Total assets $2,650,000 $3,430,000
In the spaces provided below, complete a horizontal analysis of the current asset section of Shamrock Company’s balance
sheet for Year 2. Your answers for “% Change” should be rounded to one decimal place, e.g., 10.3%. Provide a short
evaluation of this analysis.
$ Change % Change
Chapter 15
145. Boyle Corporation had the following comparative current assets and current liabilities:
Dec. 31, Year 2 Dec. 31, Year 1
Current assets
Cash $ 20,000 $ 30,000
Short-term investments 40,000 10,000
Accounts receivable 55,000 95,000
Inventory 110,000 90,000
Prepaid expenses 35,000 20,000
Total current assets $260,000 $245,000
Current liabilities
Accounts payable $140,000 $110,000
Salaries payable 40,000 30,000
Income tax payable 20,000 15,000
Total current liabilities $200,000 $155,000
During Year 2, credit sales and cost of goods sold were $600,000 and $350,000, respectively.
Required: Compute the following liquidity measures for Year 2:
A. Current ratio.
B. Acid-test ratio.
C. Receivables turnover.
D. Inventory turnover.
Chapter 15
146. Assuming a starting point of a 1:1 relationship, state the effect of the following transactions on the current ratio. Use
increase, decrease, or no effect for your answer.
A. Collection of an accounts receivable.
B. Declaration of cash dividends.
C. Additional stock is sold for cash.
D. Short-term investments are purchased for cash.
E. Equipment is purchased for cash.
F. Inventory purchases are paid for cash.
Chapter 15
147. Presented below are selected data from the financial statements of Harper Company for the last three years.
Year 3 Year 2 Year 1
Total assets $1,205,000 $952,000 $945,000
Cost of goods sold 360,000 420,000 440,000
Inventory 56,000 64,000 53,000
Net income 65,000 25,000 16,000
A. Calculate Harper’s inventory turnover ratio for years 2 and 3.
B. Calculate the number of days in inventory at December 31, year 3 and year 2. Assume 365 days in a year.
C. Explain the implications of your calculations with respect to inventory management.
148. Presented below are selected data from the financial statements of eMonstore.com for the last three years.
Year 3 Year 2 Year 1
Total assets $650,000 $821,000 $800,000
Net credit sales 800,000 650,000 720,000
Accounts receivable 85,000 79,000 74,000
Chapter 15
A. Calculate eMonstore.com’s accounts receivable turnover ratio for years 2 and 3.
B. Calculate the number of days the average balance of receivables is outstanding before being converted into cash
(turnover in days) for years 2 and 3.
C. What problems do you see with the company’s credit policy if the terms are net 30 days? Explain.
149. The following information is summarized from the balance sheets of Kress Inc. and Ross Corp. at December 31,
Year 1. Neither company has inventory.
Kress Ross
Current Assets:
Cash and cash equivalents $ 340,800 $100,200
Short-term investments 12,000 7,600
Accounts receivable, net 377,000 42,000
Notes receivable, net 36,300 18,000
Prepaid assets 207,400 40,000
Total current assets $ 973,500 $207,800
Current liabilities $ 860,900 $150,000
Other liabilities 5,000,400 300,500
Stockholders’ equity 2,400,300 800,700