12) Which of the following balance sheet displays shows only percentages?
A) Horizontal analysis balance sheet
B) A common-size balance sheet
C) A vertical analysis balance sheet
D) A balance sheet as shown in the annual report of a company
13) If you are comparing your company’s results with those of other companies in the industry, the process is called:
A) a horizontal analysis.
B) a trend analysis.
C) benchmarking.
D) sensitivity analysis.
14) Which of the following is NOT true of benchmarking?
A) It is used to compare companies of different sizes.
B) It uses vertical analysis as its primary methodology.
C) It is used to compare a company against its competitors.
D) It is used to compare a company’s results against industry averages.
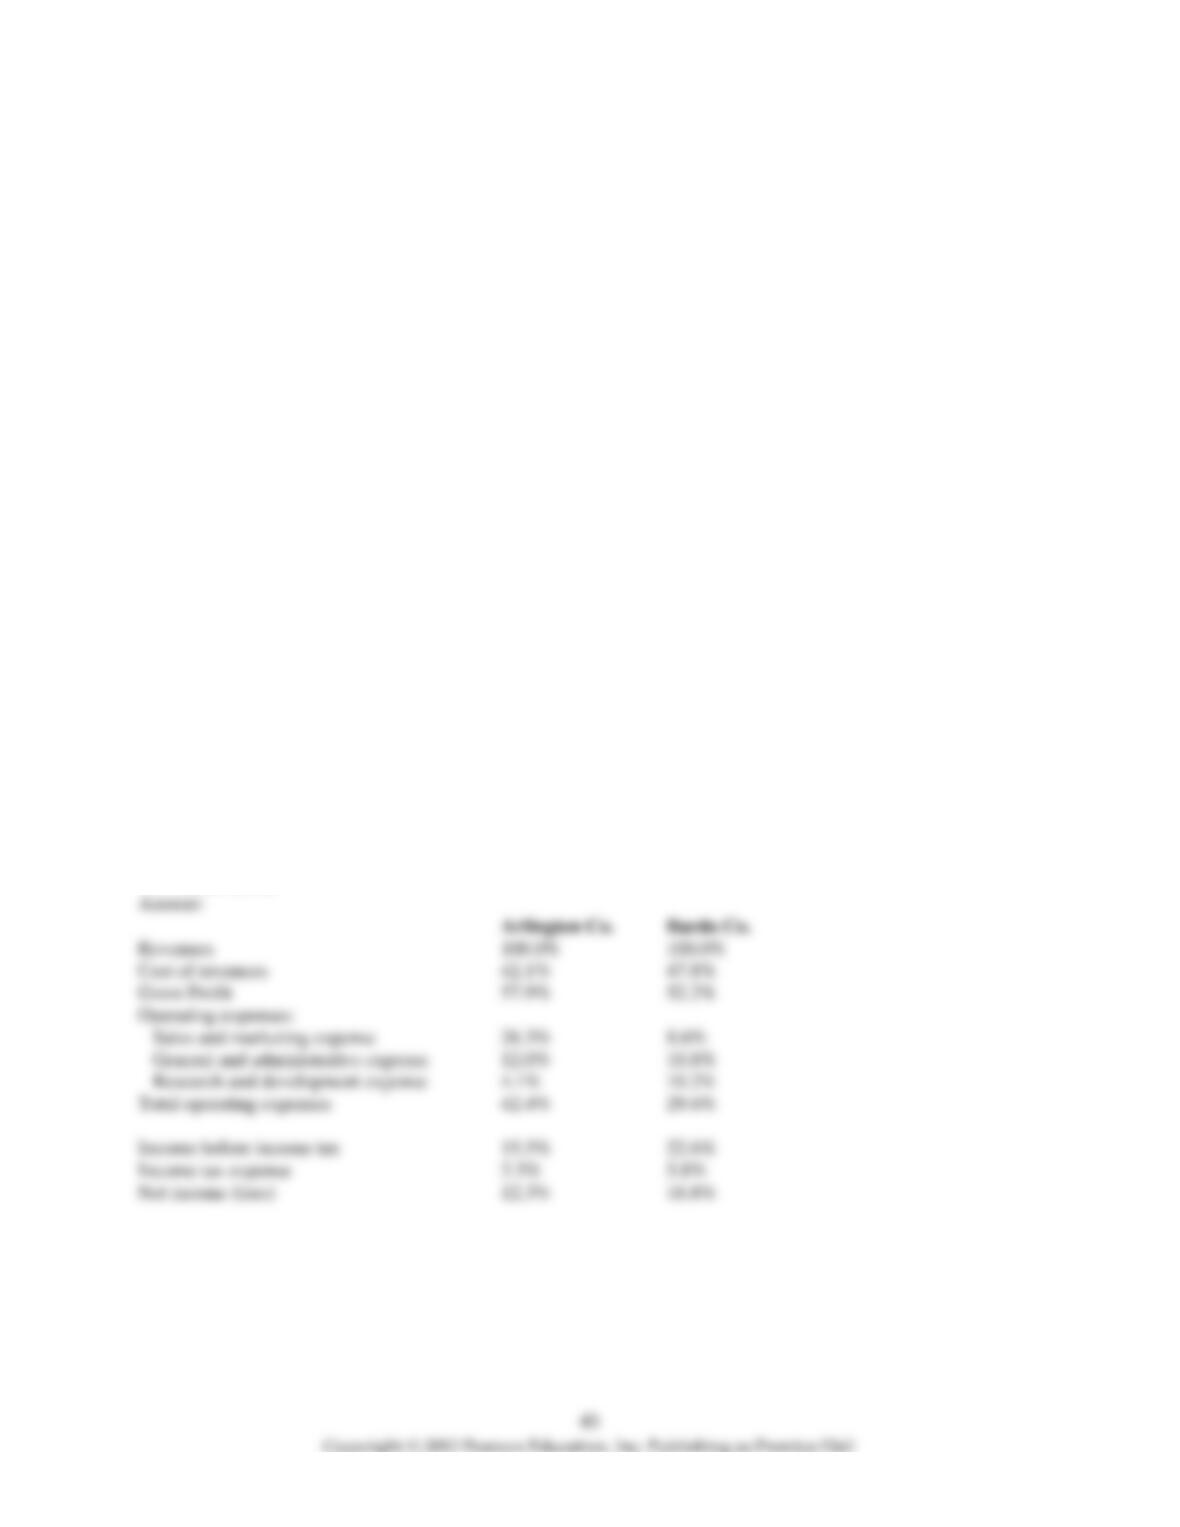
15) The Arlington Company prepared a common-size income statement to compare its results with its key
competitor, Bardo Company. Please refer to the following data:
Arlington Co. Bardo Co.
Revenues 100.0% 100.0%
Cost of goods sold 42.1% 47.8%
Gross Profit 57.9% 52.2%
Operating expenses:
Sales and marketing expense 26.3% 8.6%
General and administrative expense 12.0% 10.8%
Research and development expense 4.1% 10.2%
Total operating expenses 42.4% 29.6%
Income before income tax 15.5% 22.6%
Income tax expense 3.3% 5.8%
Net income (loss) 12.2% 16.8%
Which of the following statements can be correctly concluded from the above data?
A) Bardo Company produced higher total net income than Arlington.
B) Bardo produces higher gross profit per dollar of sales than Arlington.
C) Bardo places a higher priority on research and development than Arlington.
D) Bardo’s total operating expenses are lower than Arlington’s.
16) The Arlington Company prepared a common-size income statement to compare its results with its key
competitor, Bardo Company. Please refer to the following data:
Arlington Co. Bardo Co.
Revenues 100.0% 100.0%
Cost of goods sold 42.1% 47.8%
Gross Profit 57.9% 52.2%
Operating expenses:
Sales and marketing expense 26.3% 8.6%
General and administrative expense 12.0% 10.8%
Research and development expense 4.1% 10.2%
Total operating expenses 42.4% 29.6%
Income before income tax 15.5% 22.6%
Income tax expense 3.3% 5.8%
Net income (loss) 12.3% 16.8%
Which of the following statements can be correctly concluded from the above data?
A) Arlington‘s cost of goods sold is lower than Bardo’s on a per unit basis.
B) Arlington produces a higher amount of gross profit than Bardo.
C) Arlington makes less total net income than Bardo.
D) Bardo has more effective cost control than Arlington in the area of operating expenses.
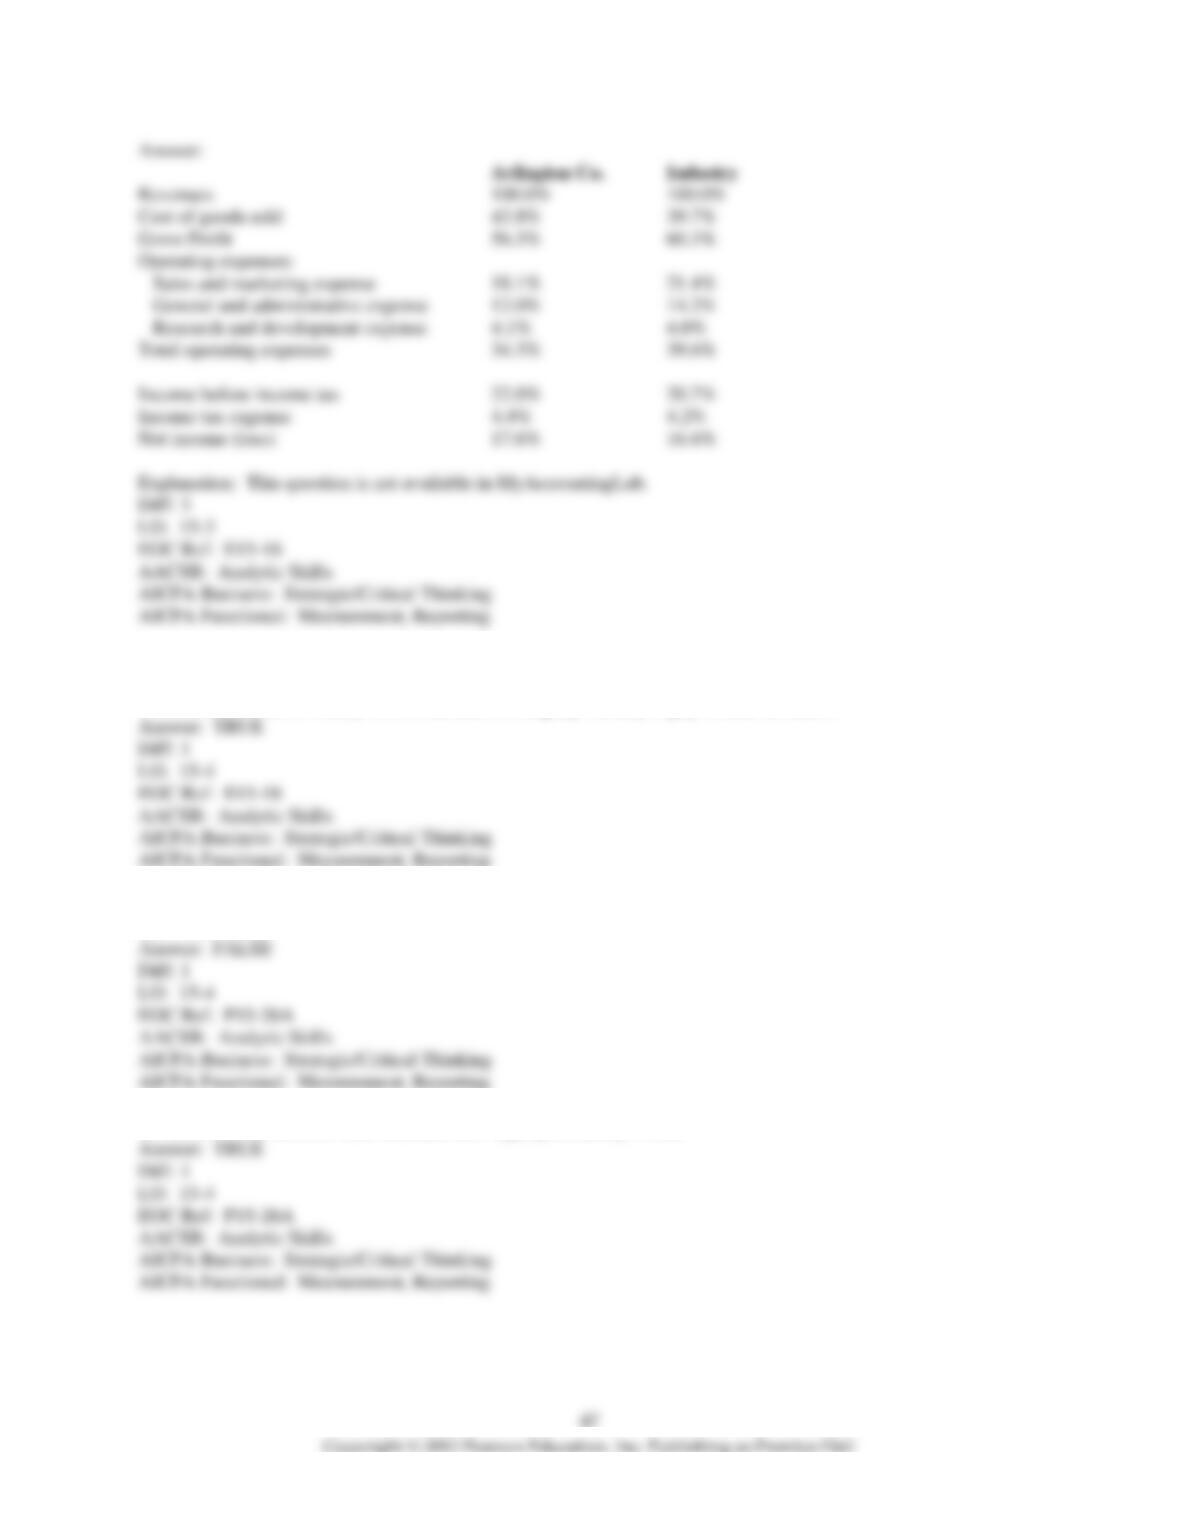
17) Arlington Company has prepared the following common-size income statement to compare its performance with
industry averages:
Arlington Co. Industry
Revenues 100.0% 100.0%
Cost of goods sold 43.8% 39.7%
Gross Profit 56.2% 60.3%
Operating expenses:
Sales and marketing expense 18.1% 21.4%
General and administrative expense 12.0% 14.2%
Research and development expense 4.1% 4.0%
Total operating expenses 34.2% 39.6%
Income before income tax 22.0% 20.7%
Income tax expense 4.4% 4.2%
Net income (loss) 17.6% 16.5%
Which of the following statements can be correctly concluded from the above data?
A) Arlington‘s gross profit per dollar of sales is higher than the industry average.
B) Arlington’s net income is higher than the industry average.
C) Arlington achieves better results than the industry by earning higher revenues.
D) Arlington achieves better profitability than the industry, primarily by controlling operating expenses more
effectively.
18) Benchmarking means comparing a company’s financial results to:
A) industry standards or competitors.
B) its own results in prior years.
C) its budget for the coming year.
D) the expectations of the capital markets.
19) Arlington Company wishes to compare itself to a key competitor, but that company is much larger in size than
Arlington. Please refer to the following income statement information:
Arlington Co. Bardo Co.
Revenues $8,000 $46,000
Cost of revenues 3,370 22,000
Gross Profit 4,630 24,000
Operating expenses:
Sales and marketing expense 2,100 3,950
General and administrative expense 960 4,980
Research and development expense 330 4,690
Total operating expenses $3,390 $13,620
Income before income tax $1,240 $10,380
Income tax expense 260 2,670
Net income/(loss) $ 980 $ 7,710
Please prepare a common-size income statement for the two companies using the following format.
(Round all amounts to the nearest tenth of a percent.)
Arlington Co. Bardo Co.
Revenues
Cost of revenues
Gross Profit
Operating expenses:
Sales and marketing expense
General and administrative expense
Research and development expense
Total operating expenses
Income before income tax
Income tax expense
Net income (loss)

46
20) The Arlington Company wishes to compare its performance with industry averages. Please refer to the data
below:
Arlington Co. Industry
Revenues $8,000 $98,000
Cost of goods sold $3,500 $38,900
Gross Profit $4,500 $59,100
Operating expenses:
Sales and marketing expense $1,450 $21,000
General and administrative expense $960 $13,900
Research and development expense $330 $3,880
Total operating expenses $2,740 $38,780
Income before income tax $1,760 $20,320
Income tax expense $350 $4,100
Net income (loss) $1,410 $16,220
Please prepare common-sized income statement using the format below. (Round all amounts to the nearest tenth of
a percent.)
Arlington Co. Bardo Co.
Revenues
Cost of revenues
Gross Profit
Operating expenses:
Sales and marketing expense
General and administrative expense
Research and development expense
Total operating expenses
Income before income tax
Income tax expense
Net income (loss)
Learning Objective 15-4
1) The current ratio is widely used to measure a company’s ability to pay current liabilities.
2) The inventory turnover ratio is a measure of the company’s ability to pay all of its current liabilities if they come
due immediately.
3) The inventory turnover ratio indicates how rapidly inventory is sold.
4) Days’ sales in receivables is a measure of a company’s ability to collect receivables.
5) Rate of return on net sales is a measure of a company’s profitability.
6) The times-interest-earned ratio shows a creditor the firm’s ability to pay interest on debt.
7) The current ratio is a key indicator of a company’s ability to pay current liabilities.
8) Quick assets do NOT include inventory.
9) Merchandise inventory is NOT counted when computing the acid-test ratio.
10) The ratio of the market price of a share of stock to the dividends paid per share is called the earnings per share.
11) The excess of a company’s current assets over current liabilities is called working capital.
12) Days in inventory is a ratio measure that shows how quickly a company can collect its receivables.
13) The gross profit percentage is an indicator of how well a company is positioned to pay off its short-term
liabilities.
14) The accounts receivable turnover is an indicator of the ability of a company to collect cash from its credit
customers.
15) The debt ratio is the ratio of total debt divided by total equity.
16) The debt-to-equity ratio shows how much the company relies on borrowing to finance its business.
17) The times-interest-earned ratio measures the number of times that operating income can pay interest expense.
18) The rate of return on total assets is a way to measure a company’s profitability.
19) The asset turnover rate is a way to evaluate how well a company can pay its short-term liabilities.
20) The rate of return on common stockholders’ equity is a commonly used way to compare the profitability of one
company to another.
21) When preparing an annual report, the earnings per share amount is generally shown on a company’s income
statement.
22) The price/earnings ratio is a measure that is valuable to investors when making investment decisions.
23) The dividend yield will tell a shareholder how much of his investment will be returned in dividends.
24) The dividend payout ratio indicates the amount of the dividend as a proportion of a share’s market price.
25) When a potential investor is evaluating the market value of a share of stock, the book value per share of stock is
an important metric to consider.
26) A company has $510,000 in Average common stockholders’ equity, Net income of $312,000, and Preferred
dividends paid of $15,000. What is the rate of return on common stockholders’ equity?
A) 58.2%
B) 61.2%
C) 59.3%
D) 62.0%
27) Which of the following signifies that a company may be unable to pay its current liabilities if they suddenly
come due?
A) Low current ratio
B) High current ratio
C) High earnings per share
D) Low gross profit percentage
28) Which of the following ratios is used to determine how quickly and easily a company is able to sell its
inventory?
A) Current ratio
B) Inventory turnover
C) Price/earnings ratio
D) Return on net sales
29) The price/earnings ratio indicates the:
A) dividend yield of the company.
B) market price of $1 of earnings.
C) percentage of common stock financed by debt.
D) ease of selling inventory.
30) Which of the following ratios is a measure of a company’s ability to pay all current liabilities if they come due
immediately?
A) The inventory turnover ratio
B) The times-interest-earned ratio
C) The acid-test ratio
D) The debt ratio
31) Which of the following items is a measure of a company’s ability to collect receivables?
A) The inventory turnover ratio
B) The current ratio
C) The day’s sales in receivables
D) The acid-test ratio
32) Which of the following ratios is a measure of a company’s ability to pay liabilities with current assets?
A) The inventory turnover ratio
B) The day’s sales in receivables
C) The current ratio
D) The price/earnings ratio
33) A company has 6,000 shares of common stock outstanding and no preferred stock. The total common
stockholders’ equity is $1,500,000. The book value per share of common stock is:
A) $.004.
B) $2.50.
C) $4.00.
D) $250.00.
34) A corporation has 2,000 shares of $50 par, 10% preferred stock, and 6,000 shares of common stock outstanding.
The net income for the year is $250,000. The earnings per share of common stock would be:
A) $10.83.
B) $31.25.
C) $40.00.
D) $41.67.
35) The net income for the year ended was $300,000. The company has no preferred stock. Common stockholders’
equity was $1,400,000 at the beginning of the year and $1,600,000 at the end of the year. The return on common
stockholders’ equity would be:
A) 18.75%.
B) 20.00%.
C) 21.43%.
D) 87.50%.
36) ABC has net sales on account of $1,200,000. The average net account receivables are $600,000. The days’
sales in receivables is:
A) 439.8 days.
B) 304.0 days.
C) 182.5 days.
D) 8.7 days.
37) A company reports net income of $70,000 and net sales of $950,000. Which of the following is the rate of return
on net sales?
A) 0.05
B) 0.20
C) 0.07
D) 0.66
38) A company reports total assets of $525,000 and stockholders’ equity of $395,000. Which of the following is the
debt ratio?
A) 0.29
B) 0.71
C) 0.55
D) 0.25
39) Zebra, Inc. has Cost of goods sold for the year of $1,900,000. The average inventory for the year is $129,000.
The inventory turnover for the year is:
A) 0.1.
B) 14.7.
C) 33.8.
D) 65.5.
40) Which of the following accurately describes working capital?
A) Current assets minus inventory
B) Current assets minus current liabilities
C) Total debt minus stockholders’ equity
D) Cost of goods sold divided by average inventory
41) Peartree Company provides the following data:
BALANCE SHEET Dec 31, 2014 Dec 31, 2013
Cash $ 21,000 $ 18,000
Accounts receivable, net 31,000 35,000
Inventory 53,000 25,000
PP&E, net 120,000 90,000
Total assets $225,000 $168,000
Accounts payable $4,000 $ 6,000
Accrued liabilities 2,000 1,000
Long-term notes payable 84,000 90,000
Total liabilities $ 90,000 $ 97,000
Common stock $ 30,000 $ 2,000
Retained earnings 113,000 74,000
Treasury stock (8,000) (5,000)
Total stockholders’ equity $135,000 $71,000
Total liabilities and stockholders’equity $225,000 $168,000
How much is the current ratio at year-end 2014?
A) 17.5
B) 16.1
C) 3.5
D) 0.5
42) Peartree Company provides the following data:
BALANCE SHEET Dec 31, 2014 Dec 31, 2013
Cash $21,000 $18,000
Accounts receivable, net 31,000 35,000
Inventory 53,000 25,000
PP&E, net 120,000 90,000
Total assets $225,000 $168,000
Additional information:
• Net sales (all on account): $240,000
• Cost of goods sold: $110,000
How much is the days in inventory ratio for 2014?
A) 252.2
B) 176.3
C) 0.008
D) 129.4
43) Peartree Company provides the following data:
BALANCE SHEET Dec 31, 2014 Dec 31, 2013
Cash $21,000 $18,000
Accounts receivable, net 31,000 35,000
Inventory 53,000 25,000
PP&E, net 120,000 90,000
Total assets $225,000 $168,000
Additional information:
• Net sales (all on account): $240,000
• Cost of goods sold: $110,000
How much is the inventory turnover for 2014?
A) 1.41
B) 2.82
C) 2.00
D) 1.65