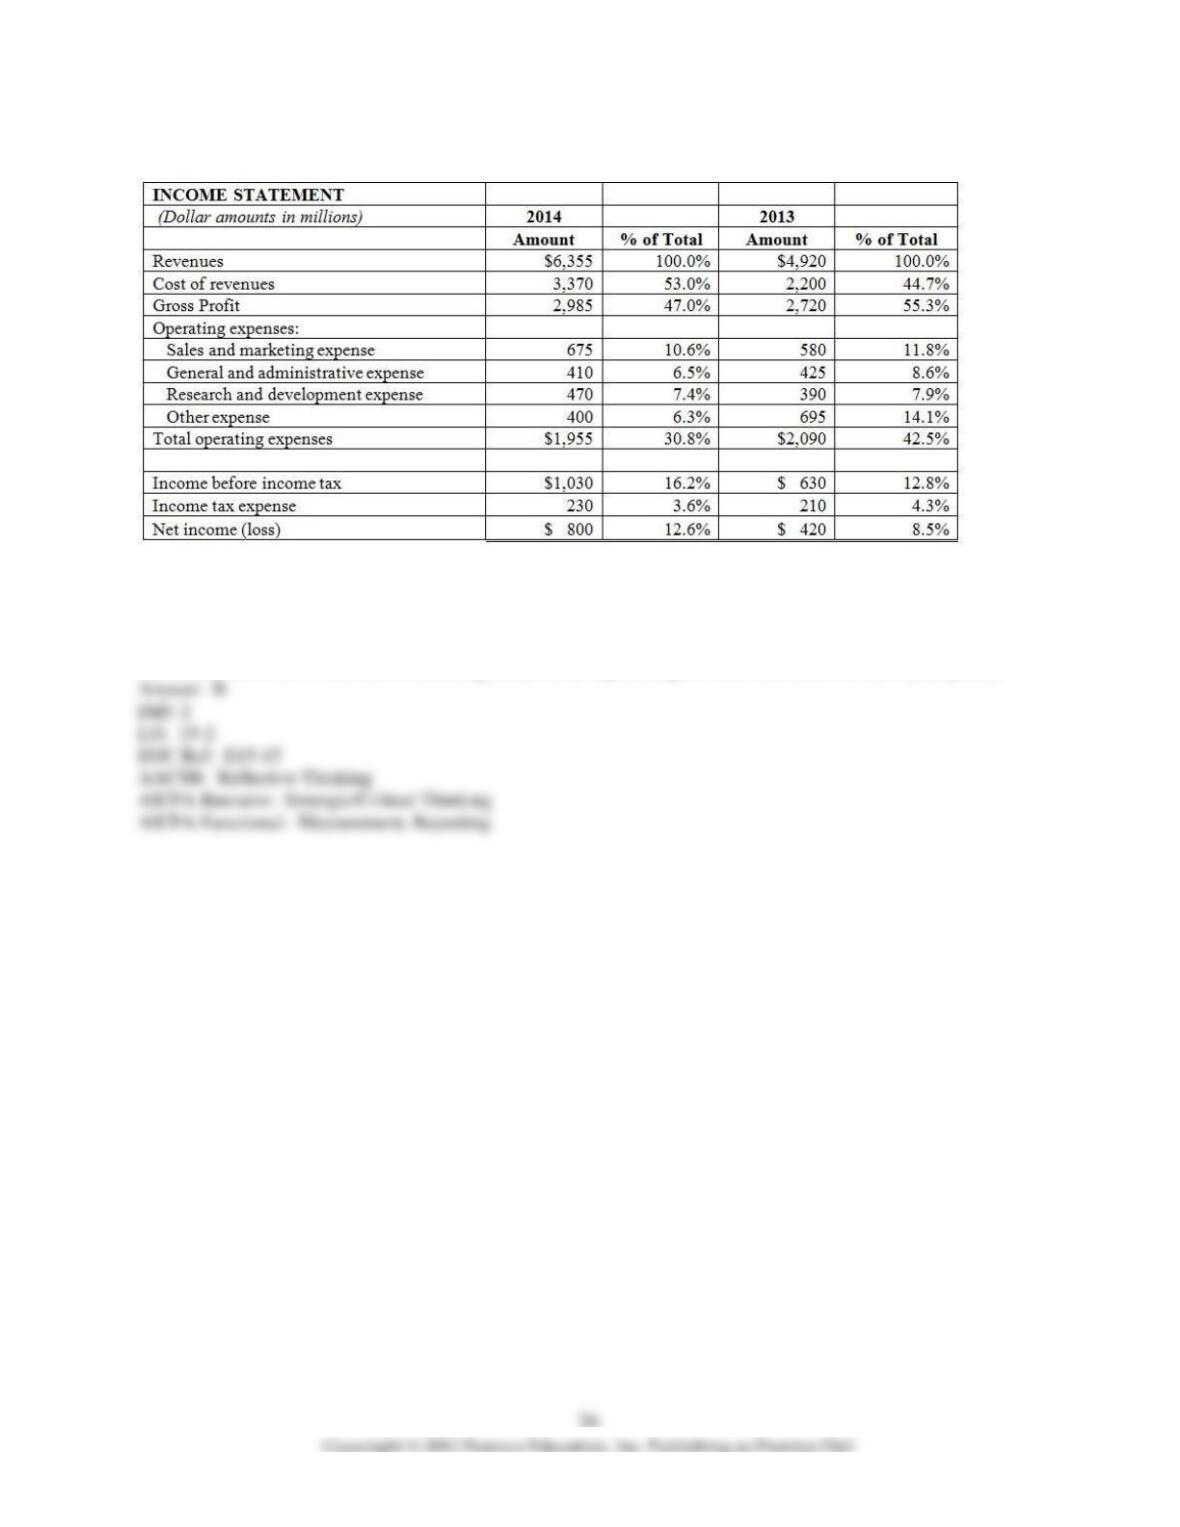
11) Please refer to the vertical analysis of income statement data shown below:
(Dollar amounts in millions) 2014 2013
Amount % of Total Amount % of Total
Revenues $6,355 100.0% $4,920 100.0%
Cost of revenues 3,370 53.0% 2,200 44.7%
Gross profit $2,985 47.0% $2,720 55.3%
Operating expenses:
Sales and marketing expense $ 675 10.6% $ 580 11.8%
General and administrative expense 410 6.5% 425 8.6%
Research and development expense 470 7.4% 390 7.9%
Other expense 400 6.3% 695 14.1%
Total operating expenses $1,955 30.8% $2,090 42.5%
Income before income tax $1,030 16.2% $ 630 12.8%
Income tax expense 230 3.6% 210 4.3%
Net income (loss) $ 800 12.6% $ 420 8.5%
The figure 8.5% shown for net income in 2013 signifies that:
A) in 2013, net income is equal to 8.5% of net sales revenues.
B) in 2013, net income is up 8.5% versus the previous year.
C) in 2013, net income is 8.5% of gross profit.
D) in 2013, net income is equal to 8.5% times the income before income tax.
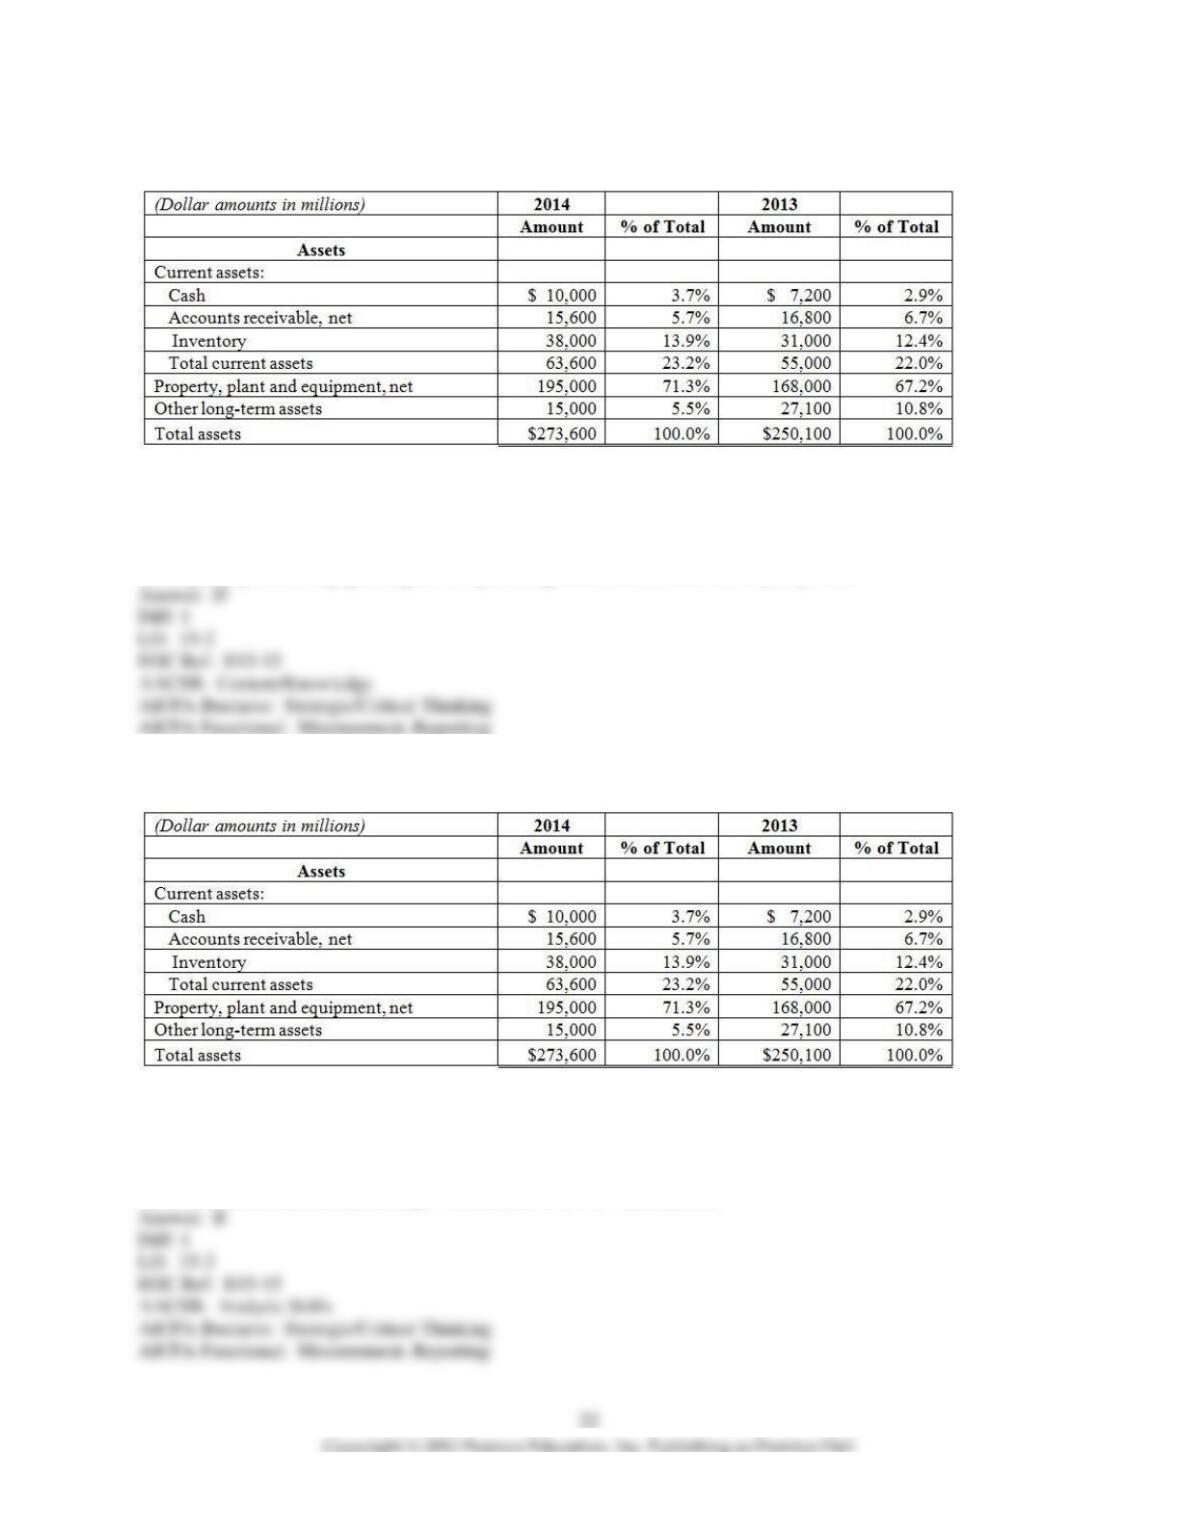
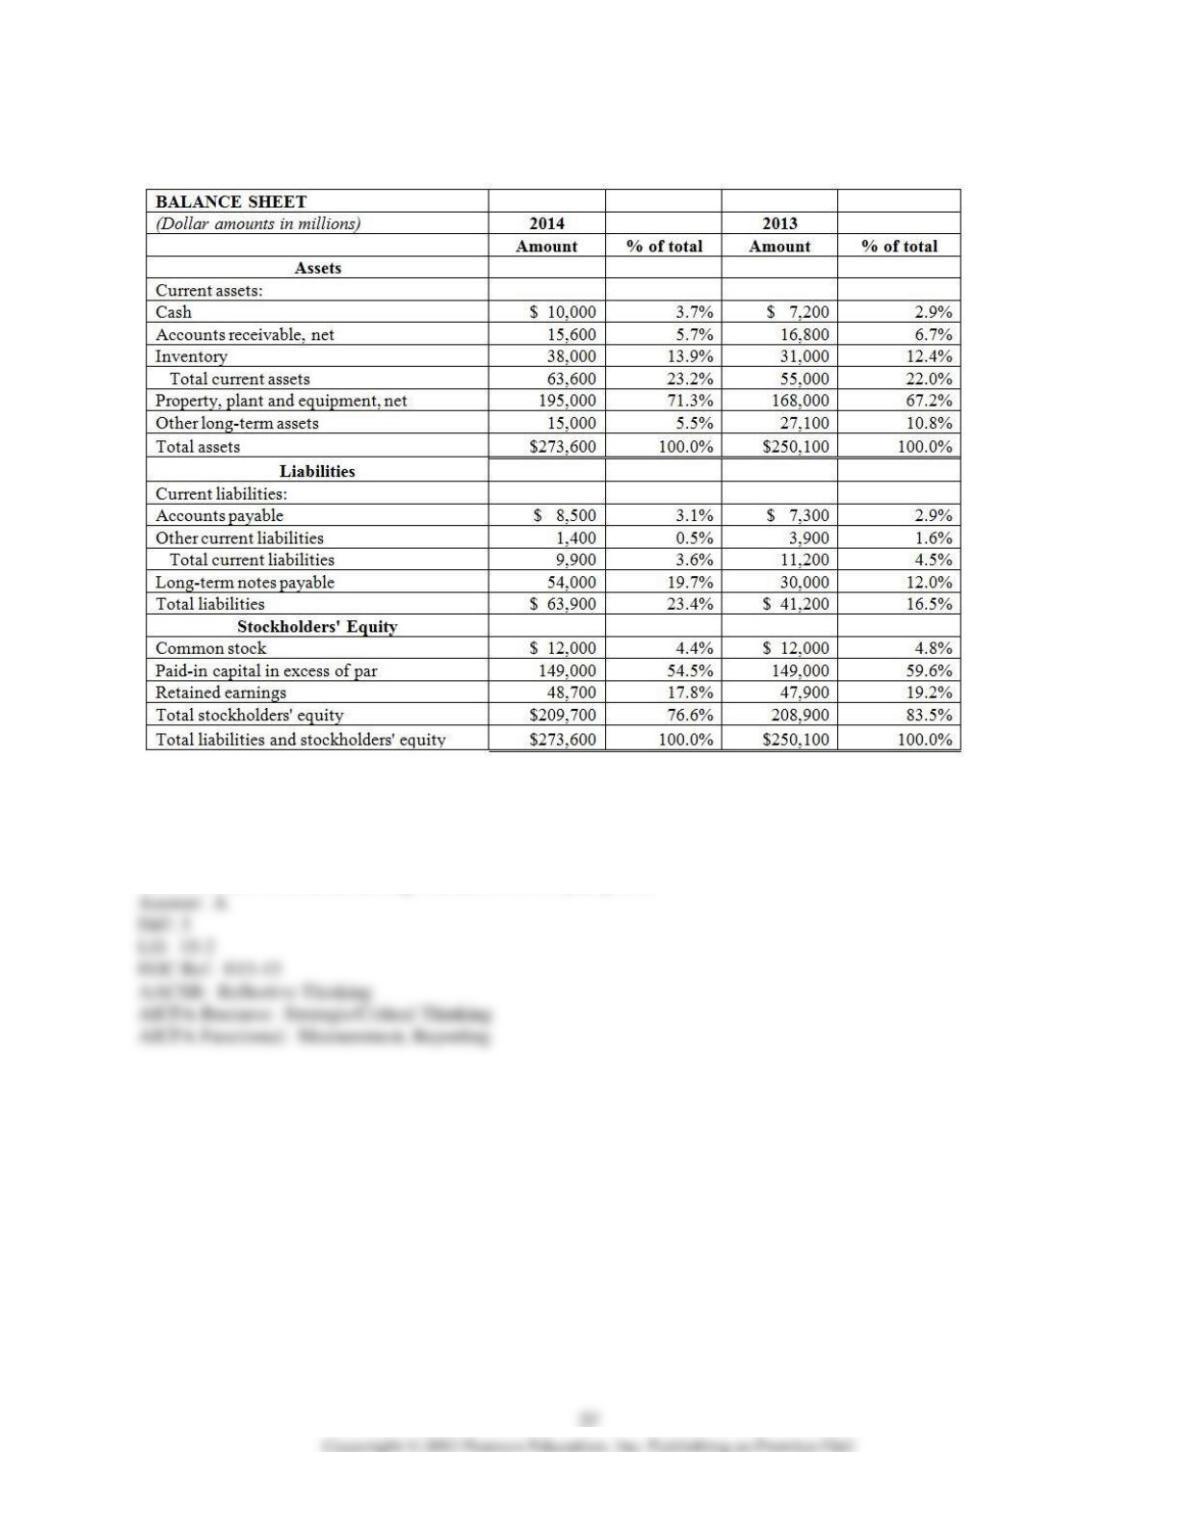
12) Please refer to the vertical analysis of a section of a balance sheet, shown below:
Which of the following statements is valid regarding the data shown above?
A) Cash grew 3.7% over the previous year balance.
B) In 2014, Inventory represented 13.9% of net sales revenues.
C) Other long-term assets dropped 5.5% over the 2-year period.
D) Property, plant and equipment grew as a percentage of total assets over the 2-year period.
13) Please refer to the vertical analysis of a section of a balance sheet, shown below:
Which of the following statements accurately describes the 13.9% shown for Inventory in 2014?
A) In 2014, inventory grew 13.9% over the previous year.
B) In 2014, inventory is equal to 13.9% of total assets.
C) In 2014, inventory was equal to 13.9% of the cash balance.
D) Inventory declined as a percentage of total assets over the 2-year period.
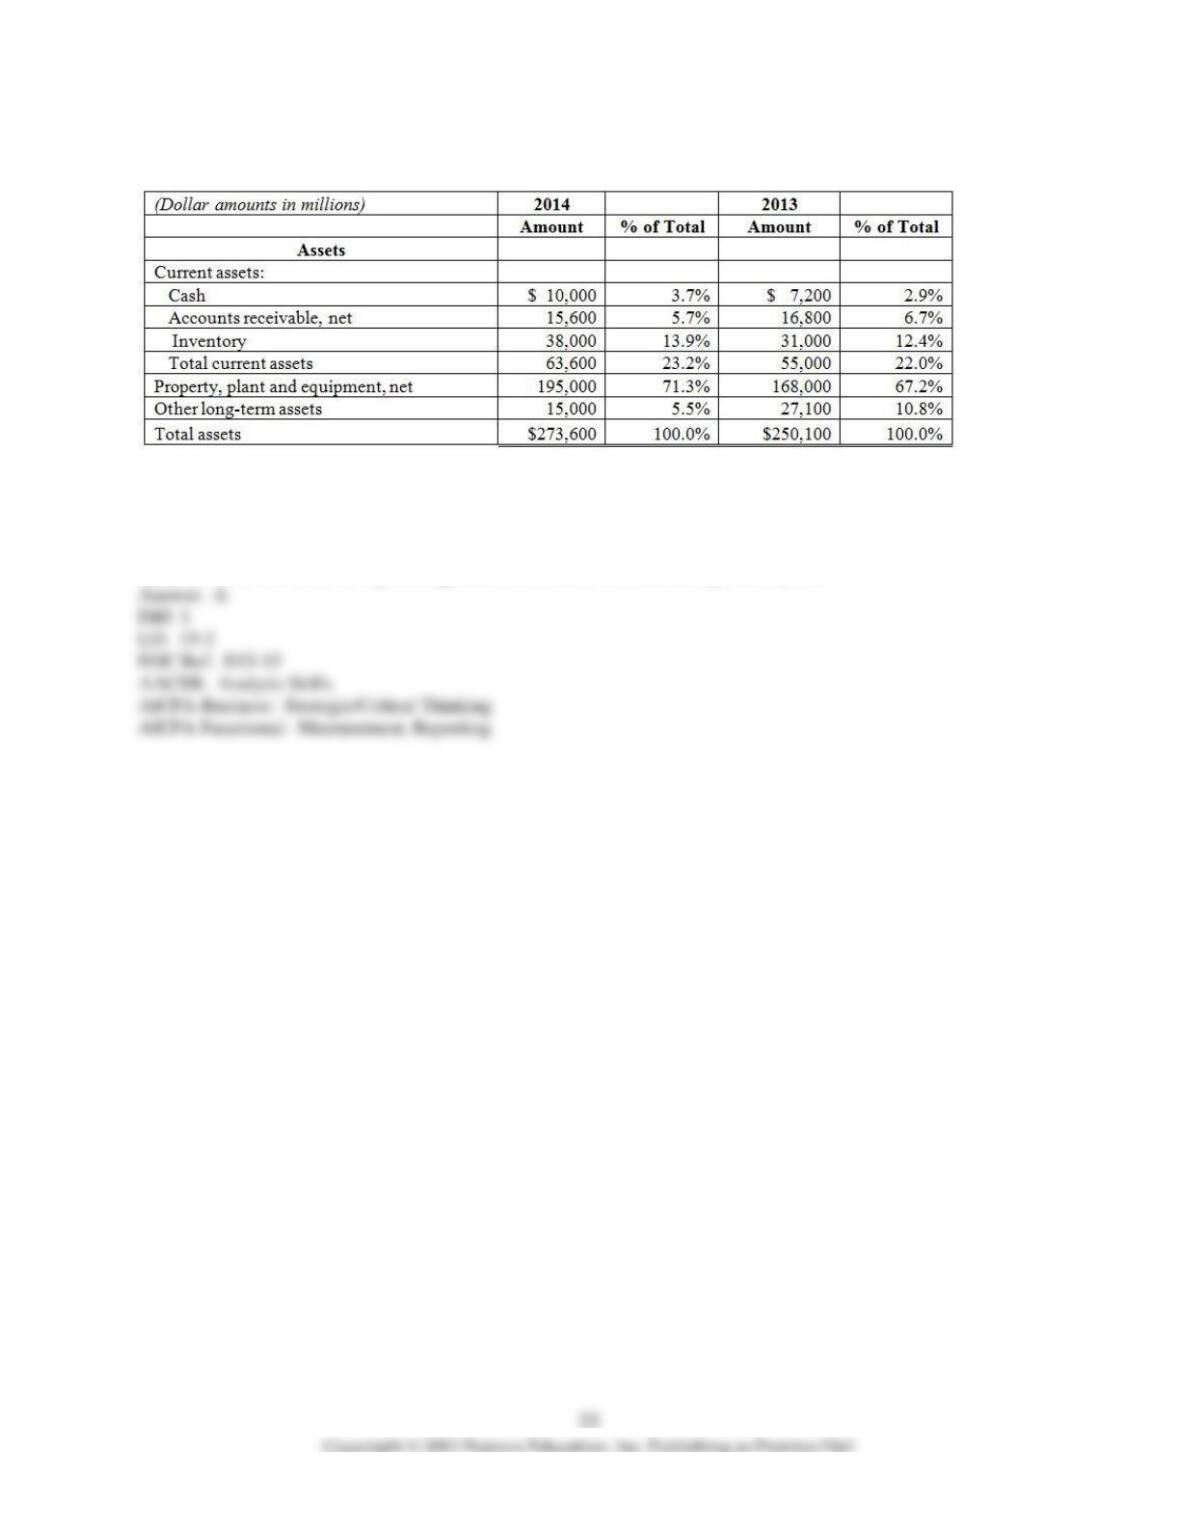
14) Please refer to the vertical analysis of a section of a balance sheet, shown below:
Which of the following statements accurately describes the data shown for total current assets?
A) Current assets grew as a percentage of total assets over the 2-year period.
B) Current assets are equal to 23.2% of net sales in 2014.
C) In 2014, current assets grew by 23.2% compared to 2013.
D) In 2014, current assets as a percentage of total assets declined over the previous year.
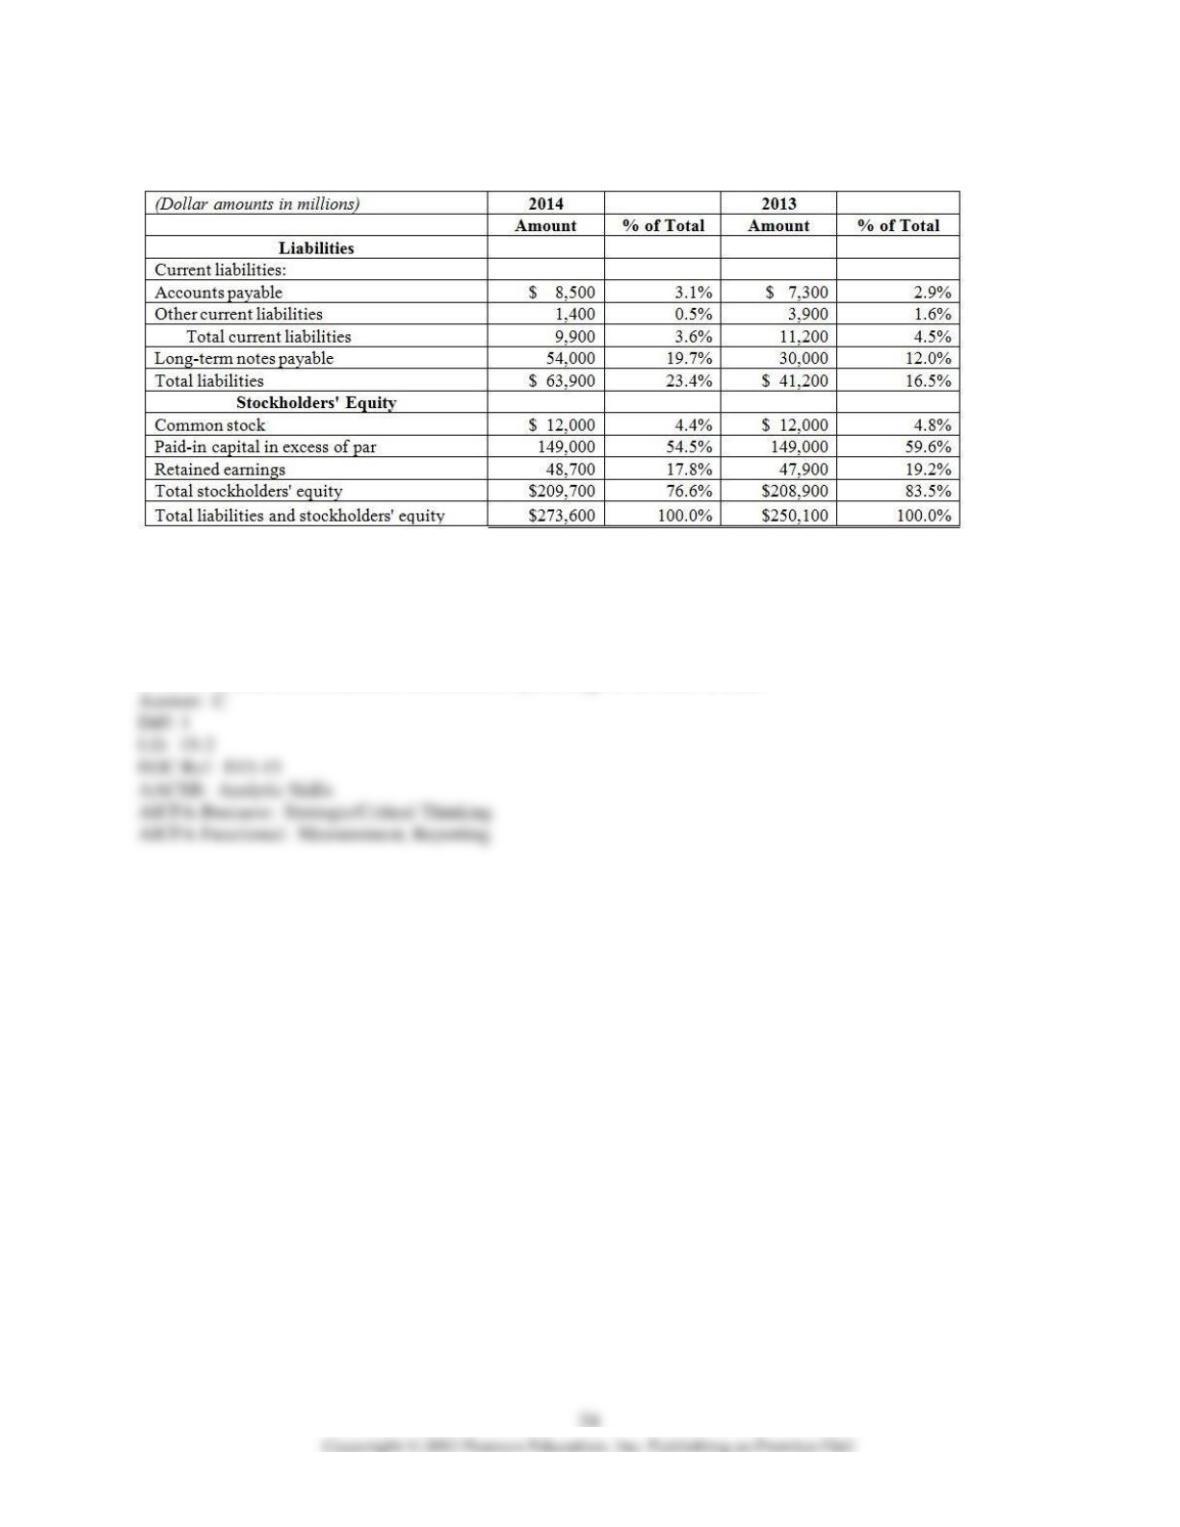
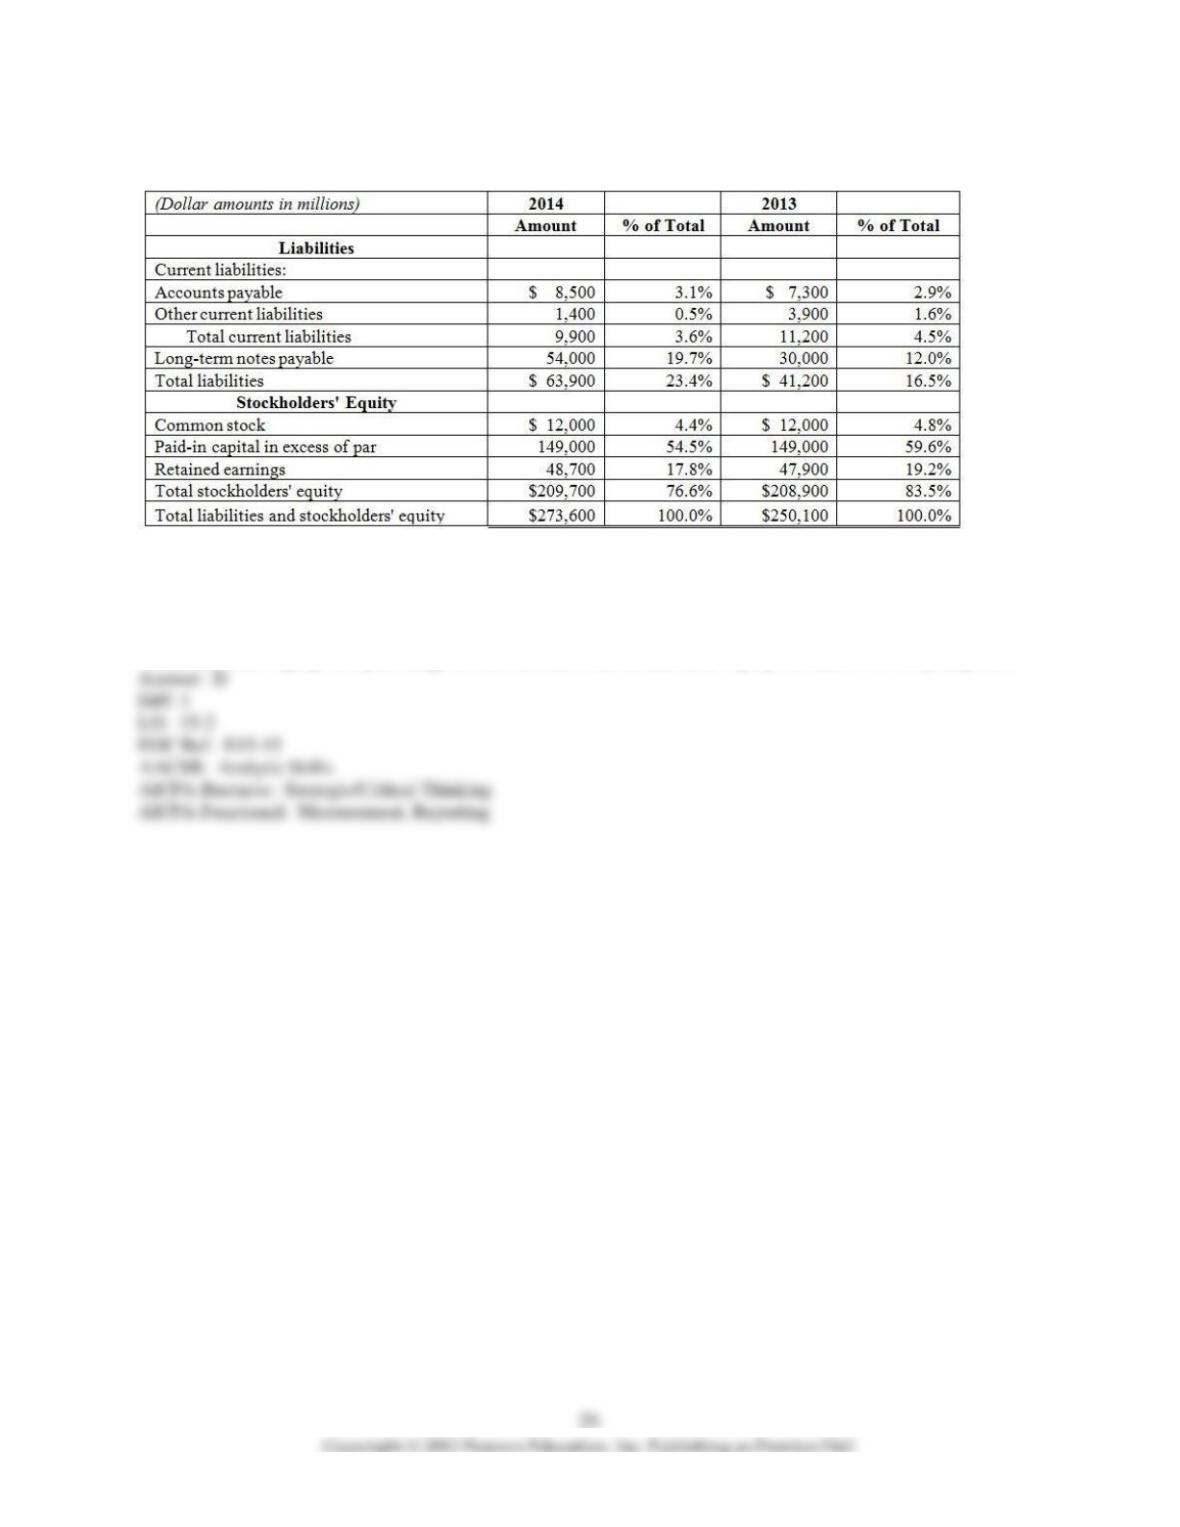
15) Please refer to the partial balance sheet data provided below:
Which of the following accurately describes the 3.6% figure shown for total current liabilities in 2014?
A) In 2014, total current liabilities increased as a percentage of total liabilities and stockholders’ equity over the
prior year.
B) In 2014, total current liabilities was equal to 3.6% of total liabilities.
C) In 2014, total current liabilities was equal to 3.6% of total liabilities and stockholders’ equity.
D) In 2014, total current liabilities decreased as a percentage of net sales revenue.
16) Please refer to the partial balance sheet data provided below:
Which of the following would be a valid conclusion from the above data?
A) Stockholders’ equity was equal to 76.6% of total liabilities in 2014.
B) Stockholders’ equity declined to 76.6% of net sales in 2014.
C) Stockholders’ equity was up 76.6% over a 2-year period.
D) Stockholders’ equity, as a percentage of total liabilities and stockholders’ equity, declined over a 2-year period.
17) Please refer to the following data:
Which of the following statements is a valid conclusion based on this data?
A) Profitability in 2014 took a dive as operating expenses increased by 30.8%.
B) Profitability in 2014 improved greatly, as net income increased significantly as a percentage of sales.
C) Net income in 2014 increased 12.6% over the prior year.
D) Net income in 2014 went down because gross profit as a percentage of sales declined over the 2-year period.
18) Please refer to the following data:
Which of the following is a valid conclusion from the above data?
A) The company shifted toward greater debt financing and less equity financing over the 2-year period.
B) The company relied heavily on retained earnings to finance asset growth in 2014.
C) Current asset and current liability data suggest a liquidity problem in 2014.
D) The balance in Retained earnings declined over a 2-year period.
19) Olivera Company provides the following data for the year 2013:
Sales revenue $400,000
Sales returns and allowances $1,200
Sales discounts $800
Cost of goods sold $255,000
On a vertical analysis, what percentage would be shown for cost of goods sold?
A) 59.4%
B) 61.0%
C) 63.4%
D) 64.1%
20) Olivera Company provides the following data for the year 2013:
Sales revenue $400,000
Sales returns and allowances $1,200
Sales discounts $800
Cost of goods sold $255,000
On a vertical analysis, what percentage would be shown for gross profit?
A) 35.9%
B) 35.6%
C) 56.1%
D) 44.1%
21) Olivera Company provides the following data for the year 2013:
Net sales revenue $398,000
Cost of goods sold $255,000
Operating expenses $95,000
Income tax expense $9,000
On a vertical analysis, what percentage would be shown for operating expenses?
A) 22.9%
B) 66.4%
C) 23.9%
D) 24.5%
22) Olivera Company provides the following data for the year 2013:
Net sales revenue $398,000
Cost of goods sold $255,000
Operating expenses $95,000
Income tax expense $9,000
On a vertical analysis, what percentage would be shown for operating income?
A) 12.9%
B) 33.6%
C) 12.1%
D) 31.4%
23) Olivera Company provides the following data for the year 2013:
Net sales revenue $398,000
Cost of goods sold $255,000
Operating expenses $95,000
Income tax expense $9,000
On a vertical analysis, what percentage would be shown for income tax expense?
A) 2.3%
B) 6.3%
C) 2.9%
D) 3.4%
24) Olivera Company provides the following data for the year 2013:
Net sales revenue $398,000
Cost of goods sold $255,000
Operating expenses $95,000
Income tax expense $9,000
On a vertical analysis, what percentage would be shown for net income?
A) 12.1%
B) 8.8%
C) 9.8%
D) 27.3%
25) Oglethorpe Company reports the following information from the vertical analysis of their income statement:
Net income:
4.2 % in 2014
3.9% in 2013
Which of the following statements could be logically concluded from the above data?
A) The company made a higher gross profit in 2014 than in 2013.
B) The company made higher net income in 2014 than in 2013.
C) The company has improved the profit they make per dollar of sales in 2014.
D) The company’s total net income increased by 0.3% in 2014.
26) Oglethorpe Company reports the following information from the vertical analysis of their balance sheet:
Current assets:
23.5 % in 2014
23.9% in 2013
Which of the following statements could be logically concluded from the above data?
A) The company’s current ratio declined.
B) The company’s current assets declined in proportion to its total assets.
C) The company’s ability to pay current liabilities declined.
D) The company’s total current assets declined by 0.4%.
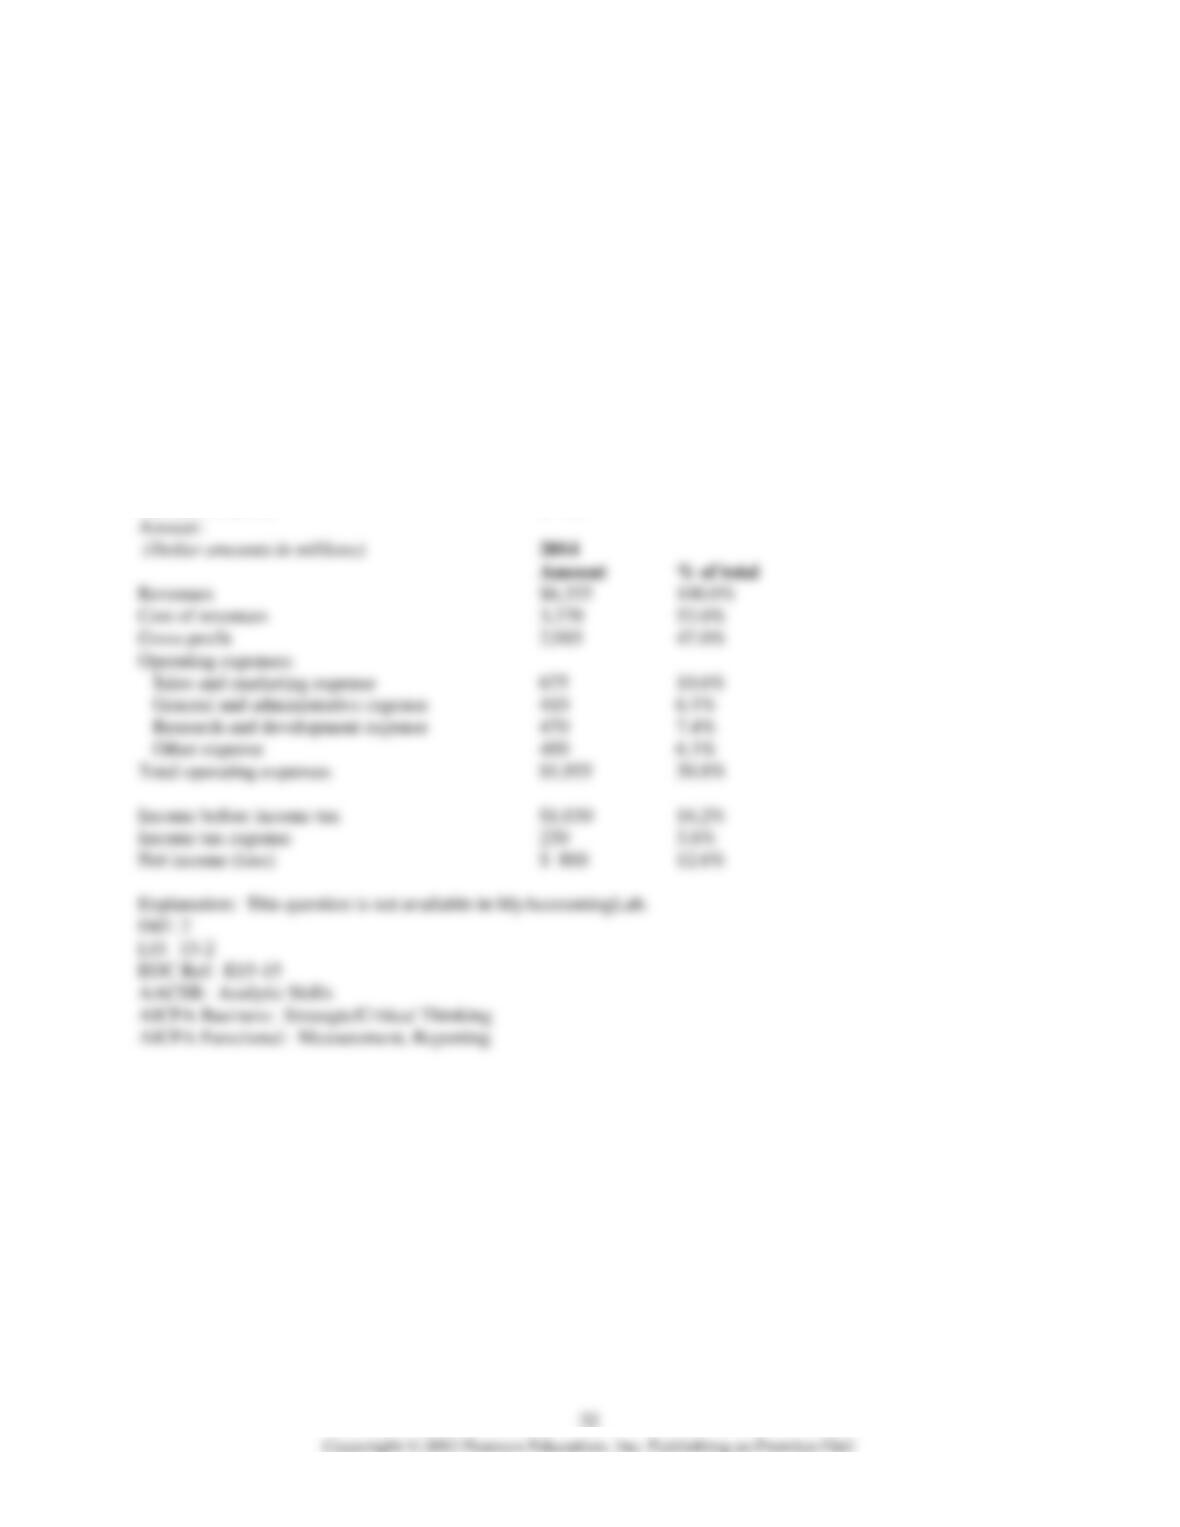
27) Please complete the vertical analysis of the income statement data shown on the form below:
(Dollar amounts in millions) 2014
Amount % of total
Revenues $6,355
Cost of revenues 3,370
Gross profit 2,985
Operating expenses:
Sales and marketing expense 675
General and administrative expense 410
Research and development expense 470
Other expense 400
Total operating expenses $1,955
Income before income tax $1,030
Income tax expense 230
Net income (loss) $ 800

33
28) Please complete a vertical analysis on the balance sheet data shown in the format below:
(Dollar amounts in millions) 2014
Amount % of total
Assets
Current assets:
Cash $ 10,000
Accounts receivable, net 15,600
Inventory 38,000
Total current assets 63,600
Property, plant and equipment, net 195,000
Other long-term assets 15,000
Total assets $273,600
Liabilities
Current liabilities:
Accounts payable $ 8,500
Other current liabilities 1,400
Total current liabilities 9,900
Long-term notes payable 54,000
Total liabilities $ 63,900
Stockholders’ Equity
Common stock $ 12,000
Paid-in capital in excess of par 149,000
Retained earnings 48,700
Total stockholders’ equity $209,700
Total liabilities and stockholders’ equity $273,600
29) Please complete the vertical analysis on the income statement data in the format below:
(Dollar amounts in millions) 2014 2013
Amount % of Total Amount % of Total
Revenues $6,355 $4,920
Cost of revenues 3,370 2,200
Gross Profit $2,985 $2,720
Operating expenses:
Sales and marketing expense 675 580
General and administrative expense 410 425
Research and development expense 470 390
Other expense 400 695
Total operating expenses $1,955 $2,090
Income before income tax $1,030 $ 630
Income tax expense 230 210
Net income (loss) $ 800 $ 420
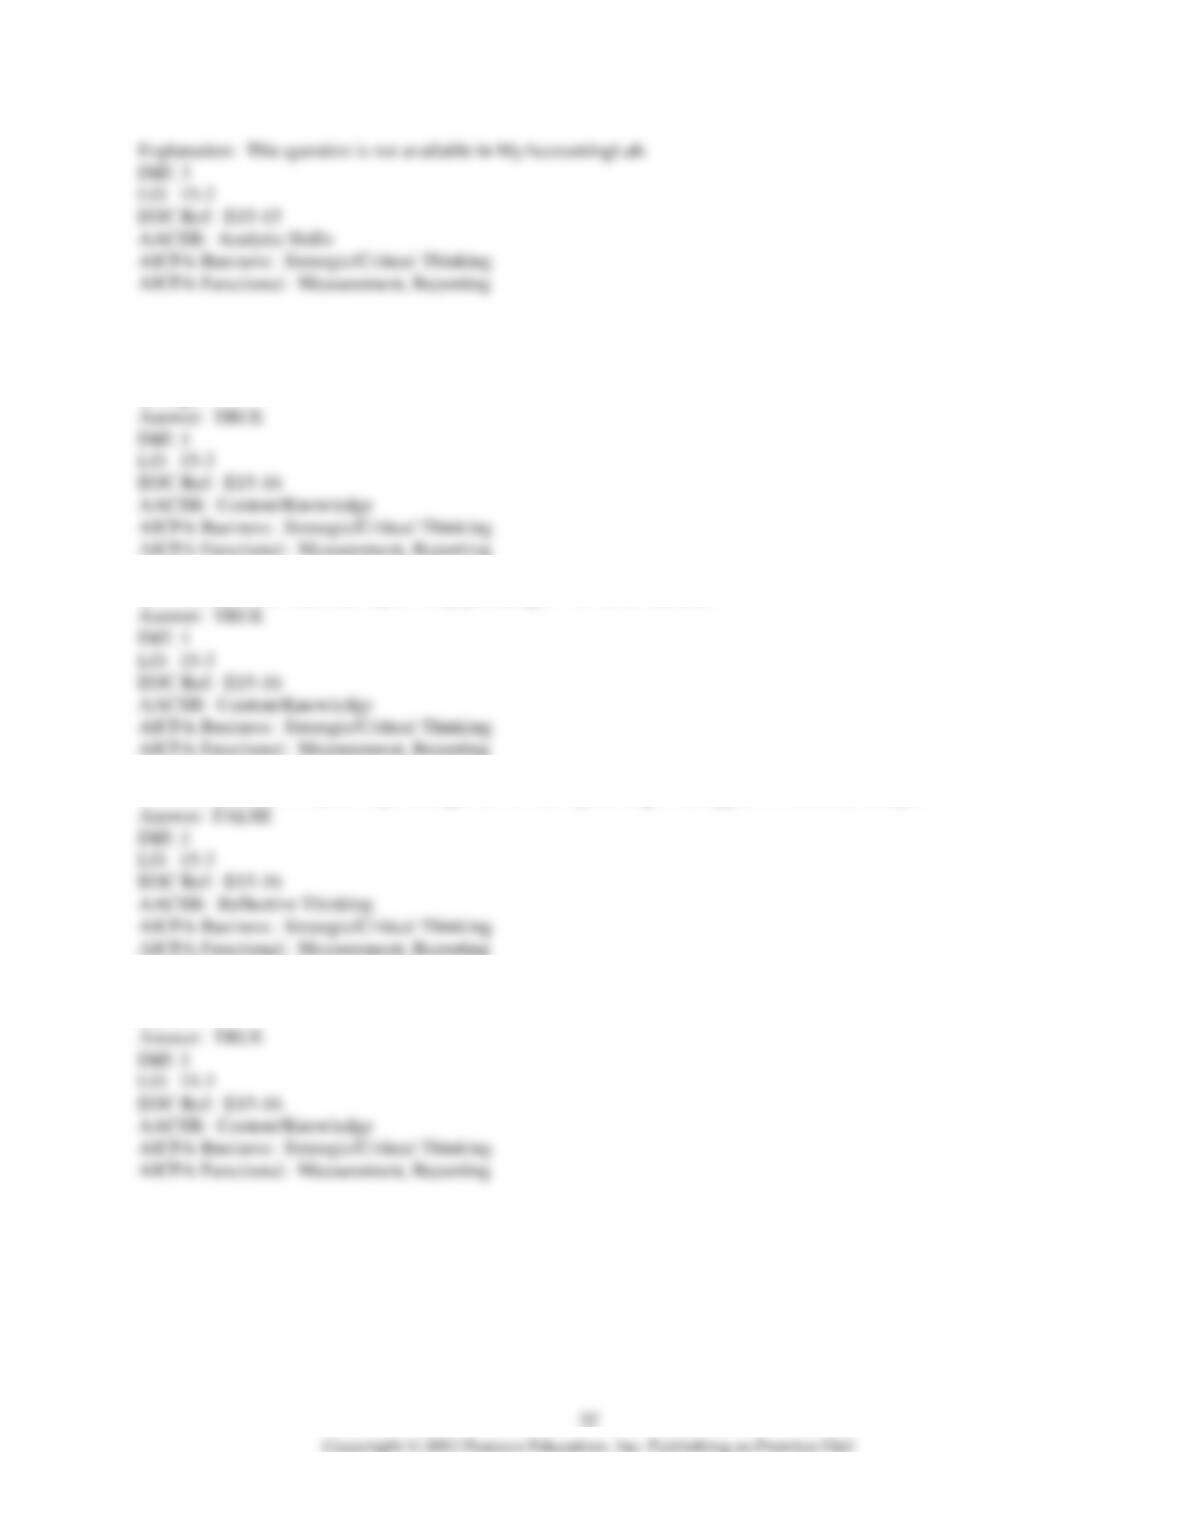
30) Please complete the vertical analysis on the balance sheet data in the format below:
Learning Objective 15-3
1) Benchmarking is often done by comparing a company against either a key competitor or against the industry
average.
2) A common-size statement reports only percentages—no dollar amounts.
3) The common–size statement percentages are the same percentages that appear in horizontal analysis.
4) Common-size statements allow the comparison of two or more companies with different amounts of net sales and
assets.
5) The Arlington Company prepared a common-size income statement to compare its results with its key competitor,
Bardo Company. Please refer to the following data:
Arlington Co. Bardo Co.
Revenues 100.0% 100.0%
Cost of goods sold 42.1% 47.8%
Gross Profit 57.9% 52.2%
Operating expenses:
Sales and marketing expense 26.3% 8.6%
General and administrative expense 12.0% 10.8%
Research and development expense 4.1% 10.2%
Total operating expenses 42.4% 29.6%
Income before income tax 15.5% 22.6%
Income tax expense 3.3% 5.8%
Net income (loss) 12.3% 16.8%
Based on this data, an analyst could conclude that Arlington’s total gross profit is higher than Bardo’s.
6) The Arlington Company prepared a common-size income statement to compare its results with its key competitor,
Bardo Company. Please refer to the following data:
Arlington Co. Bardo Co.
Revenues 100.0% 100.0%
Cost of goods sold 42.1% 47.8%
Gross Profit 57.9% 52.2%
Operating expenses:
Sales and marketing expense 26.3% 8.6%
General and administrative expense 12.0% 10.8%
Research and development expense 4.1% 10.2%
Total operating expenses 42.4% 29.6%
Income before income tax 15.5% 22.6%
Income tax expense 3.3% 5.8%
Net income (loss) 12.3% 16.8%
Based on this data, an analyst could conclude that Arlington’s performance is not as good as Bardo’s because it has
much higher sales and marketing expenses.
39
7) Arlington Company has prepared the following common-size income statement to compare its performance with
industry averages:
Arlington Co. Industry
Revenues 100.0% 100.0%
Cost of goods sold 43.8% 39.7%
Gross Profit 56.2% 60.3%
Operating expenses:
Sales and marketing expense 18.1% 21.4%
General and administrative expense 12.0% 14.2%
Research and development expense 4.1% 4.0%
Total operating expenses 34.2% 39.6%
Income before income tax 22.0% 20.7%
Income tax expense 4.4% 4.2%
Net income (loss) 17.6% 16.5%
Based on the above data, an analyst could conclude that Arlington‘s total net income is higher than the industry
average.
8) Arlington Company has prepared the following common-size income statement to compare its performance with
industry averages:
Arlington Co. Industry
Revenues 100.0% 100.0%
Cost of goods sold 43.8% 39.7%
Gross Profit 56.2% 60.3%
Operating expenses:
Sales and marketing expense 18.1% 21.4%
General and administrative expense 12.0% 14.2%
Research and development expense 4.1% 4.0%
Total operating expenses 34.2% 39.6%
Income before income tax 22.0% 20.7%
Income tax expense 4.4% 4.2%
Net income (loss) 17.6% 16.5%
Based on the above data, an analyst could conclude that Arlington achieves better results than the industry average
by controlling its operating expenses more effectively.
9) Arlington Company has prepared the following common-size income statement to compare its performance with
industry averages:
Arlington Co. Industry
Revenues 100.0% 100.0%
Cost of goods sold 43.8% 39.7%
Gross Profit 56.2% 60.3%
Operating expenses:
Sales and marketing expense 18.1% 21.4%
General and administrative expense 12.0% 14.2%
Research and development expense 4.1% 4.0%
Total operating expenses 34.2% 39.6%
Income before income tax 22.0% 20.7%
Income tax expense 4.4% 4.2%
Net income (loss) 17.6% 16.5%
This is an example of benchmarking.
10) If an analyst wishes to compare several different companies that vary in size, which of the following types of
financial statement analysis would be used?
A) Vertical analysis
B) Horizontal analysis
C) Ratio analysis
D) Common-size financial statement analysis
11) Which of the following is the definition of benchmarking?
A) Benchmarking is the study of percentage changes in financial statement line items year to year.
B) Benchmarking is the analysis of a financial statement that shows each item as a percentage of net sales or total
assets.
C) Benchmarking is the practice of comparing a company with other companies in that industry.
D) Benchmarking is the comparison of two companies using horizontal analysis.