
Chapter 14 Analyzing Financial Statements: A Managerial Perspective
14–57
147. The following information for Kinnis, Inc., a retail furniture and design firm, is presented
at December 31, 2018 and 2017:
December 31
Assets 2018 2017
Current assets:
Cash $ 42,000 $ 54,000
Accounts receivable 480,000 345,000
Inventory 5,010,000 4,950,000
Prepaid expenses 84,000 79,000
Total current assets 5,616,000 5,428,000
Building and equipment 1,591,000 1,193,000
Total assets $7,207,000 $6,621,000
Liabilities and Stockholders’ Equity
Current liabilities:
Accounts payable $ 705,000 $ 628,000
Bank loan payable 679,000 625,000
Other accrued payables 215,000 315,000
Total current liabilities 1,599,000 1,568,000
Long-term debt 1,729,000 1,791,000
Total liabilities 3,328,000 3,359,000
Stockholders’ equity:
Common stock 1,307,000 1,305,000
Retained earnings 2,572,000 1,957,000
Total stockholders’ equity 3,879,000 3,262,000
Total liabilities and stockholders’ equity $7,207,000 $6,621,000
There were 100,000 shares of common stock outstanding at the end of both years. The
income tax rate is 35%. Interest expense totaled $139,000 for 2018 and $158,000 for
2017. The market price per share was $110 at the end of 2017 and $134 at the end of
2018. Net income was $615,000 for 2018 and $739,000 in 2017. Net sales totaled
$4,568,000 and $3,253,000 for 2018 and 2017, respectively.
a. Calculate the following for 2018 and 2017:
1. Earnings per share
2. Price–earnings ratio
3. Return on total assets
4. Return on common stockholders’ equity
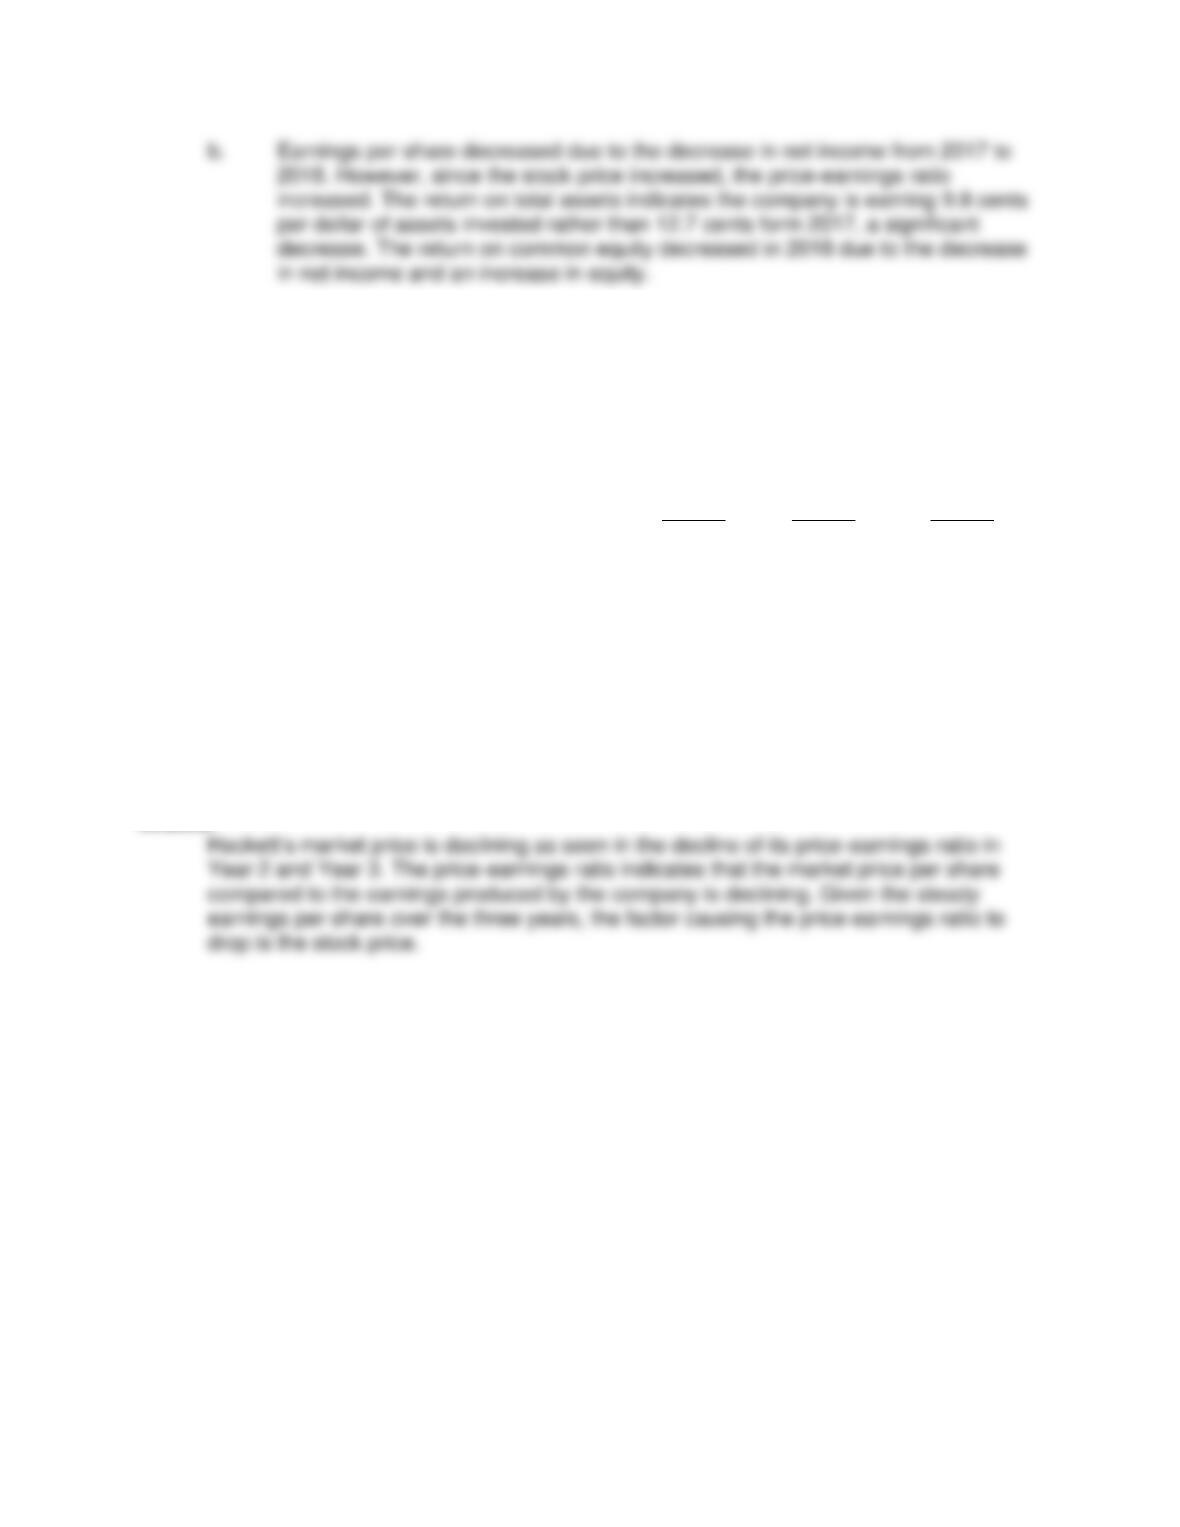
b. Comment on any trends apparent in the ratios.
Answer
Test Bank to accompany Jiambalvo Managerial Accounting, 6th Edition
14–58
148. Jim Parker is interested in purchasing the stock of Hackett, a company that sells bricks
to the construction industry. Before purchasing the stock, Parker would like to learn as
much as possible about the company in which he is contemplating the potential
investment. However, the only information that Parker has is a portion of Hackett’s
annual report for the current year (Year 3), which contains no comparative data other
than the summary of the ratios listed below:
Year 3 Year 2 Year 1
Current ratio 2.8:1 2.3:1 2.1:1
Acid-test ratio 0.8:1 1.0:1 1.2:1
Accounts receivable turnover 8.9 times 10.1 times 12.5 times
Inventory turnover 6.1 times 8.1 times 8.3 times
Return on total assets 15.50% 12.10% 10.30%
Return on common stockholders’ equity 18.10% 14.70% 11.90%
Price-earnings ratio 12.3 17.2 17.7
Earnings per share $1.53 $1.52 $1.55
Is the market price of the company’s stock increasing or decreasing? Support your
answer with accounting justification citing specific information in the analysis.
Answer

Chapter 14 Analyzing Financial Statements: A Managerial Perspective
14–59
149. Comparative financial statements for Smart Buy are shown below for the year’s ending
December 31, 2018 and 2017:
December 31
Assets 2018 2017
Current assets:
Cash $ 14,000 $ 12,458
Accounts receivable 45,489 35,486
Inventory 39,239 32,568
Other 3,400 2,581
Total current assets 102,128 83,093
Long-term investments 128,580 104,600
Property, plant and equipment, net 789,145 771,258
Total assets $1,019,853 $958,951
Liabilities and Stockholders’ Equity
Current liabilities:
Accounts payable $ 98,789 $ 85,451
Other current liabilities 3,456 5,157
Total current liabilities 102,245 90,608
Long-term debt 456,781 414,760
Total liabilities 559,026 505,368
Stockholders’ equity:
Common stock 375,000 375,000
Retained earnings 85,827 78,583
Total stockholders’ equity 460,827 453,583
Total liabilities and stockholders’ equity $1,019,853 $958,951
Year Ended December 31
2018 2017
Net sales $2,281,789 $2,074,354
Cost of goods sold 1,505,981 1,348,330
Gross margin 775,808 726,024
Operating expenses 458,245 420,408
Operating income 317,563 305,616
Interest expense 36,542 33,181
Earnings before income taxes 281,021 272,435
Income tax expense 98,357 95,352
Net earnings $ 182,664 $ 177,083
Smart Buy had 50,000 common shares outstanding throughout 2018. The December 31,
2018 market price is $43 per share. The income tax rate is 35%. Calculate the following
profitability ratios for 2018 for Smart Buy:
a. Earnings per share
b. Price-earnings ratio
c. Gross margin percentage
d. Return on total assets
e. Return on common stockholders’ equity
Answer

Test Bank to accompany Jiambalvo Managerial Accounting, 6th Edition
14–60
150. Comparative financial statements for TJ Cleaners for December 31, 2018 and 2017
follow:
December 31
Assets 2018 2017
Current assets:
Cash $ 12,000 $ 12,458
Accounts receivable 45,489 37,486
Inventory 40,239 33,568
Prepaid expenses 3,400 2,581
Total current assets 101,128 86,093
Long-term investments 128,580 104,600
Property, plant, and equipment, net 867,565 739,258
Total assets $1,097,273 $929,951
Liabilities and Stockholders’ Equity
Current liabilities:
Accounts payable $ 98,789 $ 85,451
Other current liabilities 5,456 5,157
Total current liabilities 104,245 90,608
Long-term debt 486,781 424,760
Total liabilities 591,026 515,368
Stockholders’ equity:
Common stock 375,000 336,000
Retained earnings 131,247 78,583
Total stockholders’ equity 506,247 414,583
Total liabilities and stockholders’ equity $1,097,273 $929,951
Year Ended December 31
2018 2017
Net sales $2,111,789 $2,174,354
Cost of goods sold 1,505,981 1,648,330
Gross margin 605,808 526,024
Operating expenses 418,245 420,408
Operating income 187,563 105,616
Interest expense 36,542 33,181
Earnings before income taxes 151,021 72,435
Income taxes expense 98,357 15,352
Net earnings $ 52,664 $ 57,083
TJ sells all items on account. Calculate the following for TJ Cleaners for 2018:
a. Asset turnover
b. Accounts receivable turnover
c. Days’ sales in inventory
d. Inventory turnover
e. Days’ sales in inventory
Answer

Chapter 14 Analyzing Financial Statements: A Managerial Perspective
14–61
151. The following information for BuyRite Rooms, a retail furniture and design firm, is
presented for 2018 and 2017:
December 31
Assets 2018 2017
Current assets:
Cash $ 42,000 $ 54,000
Accounts receivable 580,000 445,000
Inventory 5,010,000 4,950,000
Prepaid expenses 84,000 79,000
Total current assets 5,716,000 5,528,000
Building and equipment, net 1,097,000 1,095,000
Total assets $6,813,000 $6,623,000
Liabilities and stockholders’ equity
Current liabilities:
Accounts payable $ 605,000 $ 628,000
Bank loan payable 679,000 625,000
Other accrued payables 215,000 315,000
Total current liabilities 1,499,000 1,568,000
Long-term debt 1,729,000 1,791,000
Total liabilities 3,228,000 3,359,000
Stockholders’ equity:
Common stock 1,307,000 1,307,000
Retained earnings 2,278,000 1,957,000
Total stockholders’ equity 3,585,000 3,264,000
Total liabilities and stockholders’ equity $6,813,000 $6,623,000
There were 100,000 shares of common stock outstanding during both years. In addition,
the following information is provided:
2018 2017
Market price per share at the end of year $ 134 $ 110
Net income for the year 815,000 639,000
Cost of goods sold for the year 2,900,000 2,700,000
Net sales for the year 5,568,000 5,253,000
a. Calculate asset turnover, accounts receivable turnover, days’ sales in
receivables, inventory turnover, and days’ sales in inventory for 2017 and 2018.
Use three significant digits for all calculations.
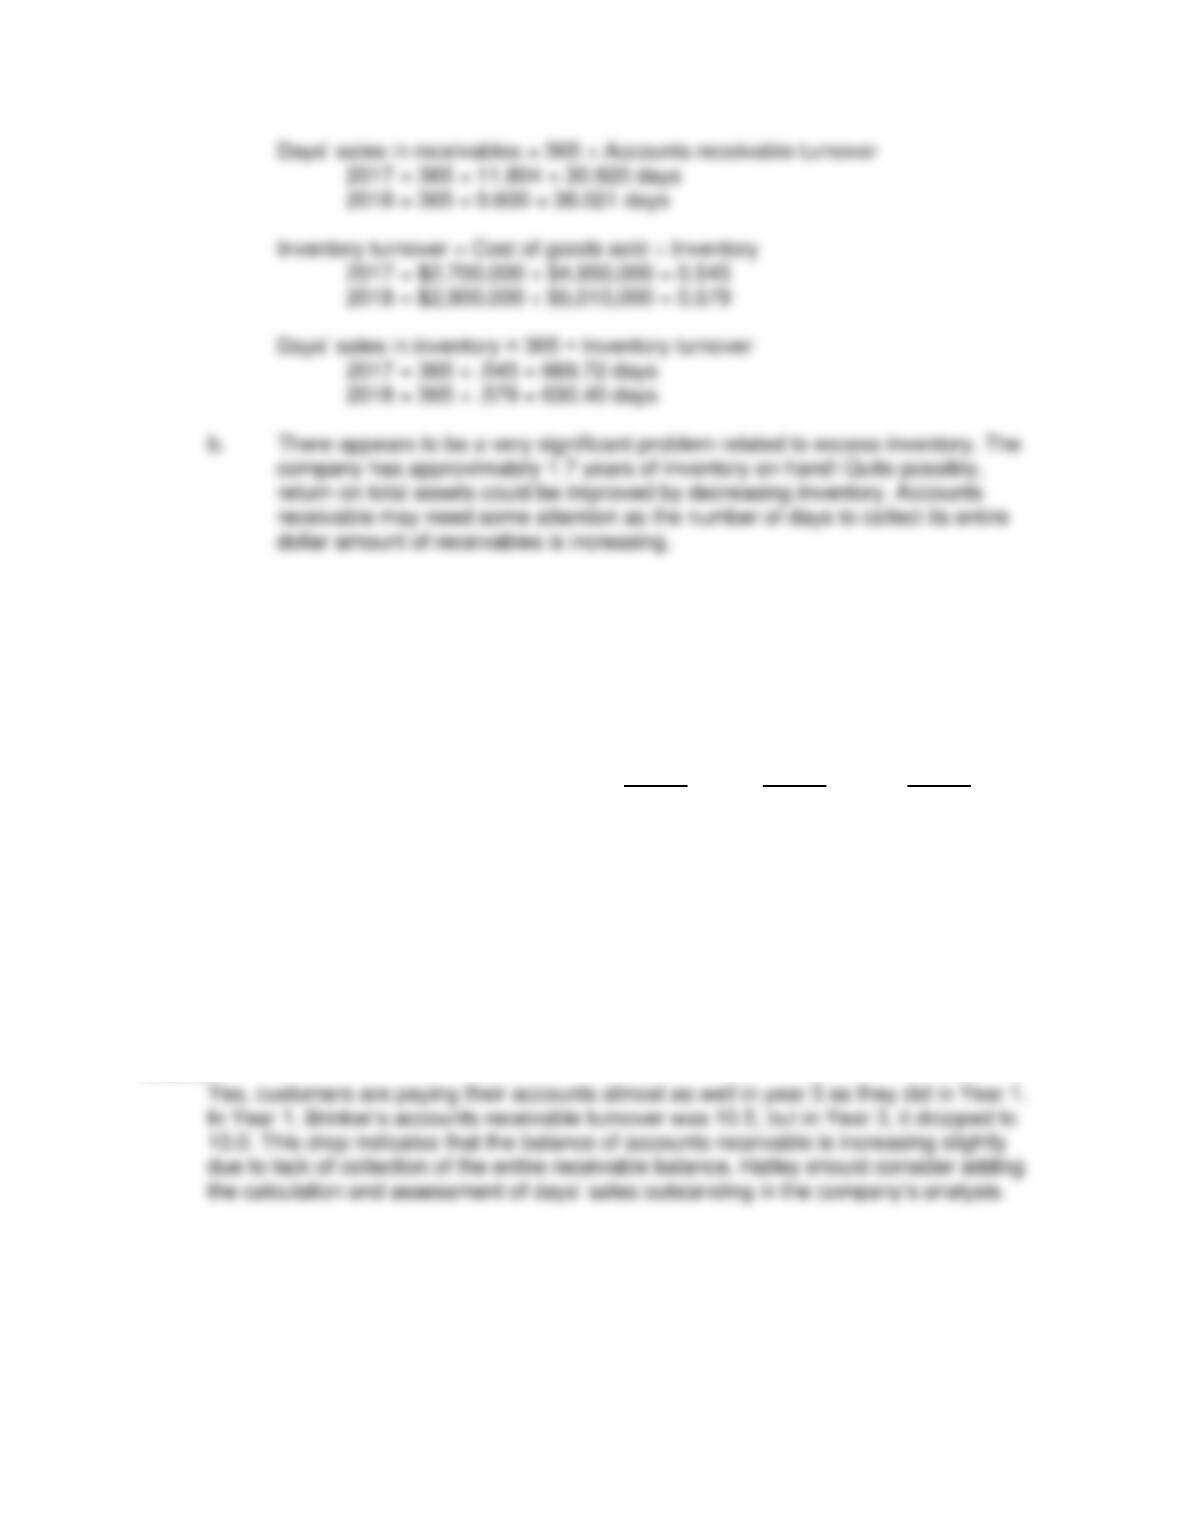
b. How well does BuyRite Rooms appear to manage its accounts receivable and
inventory? What suggestions do you have for the company’s managers?
Answer
Test Bank to accompany Jiambalvo Managerial Accounting, 6th Edition
14–62
152. Hank Hatley is interested in purchasing the stock of Brinker, a company that sells bricks
to the construction industry. Before purchasing the stock, Hatley would like to learn as
much as possible about the company in which he is contemplating a potential
investment. However, the only information that Hatley has is a portion of Brinker’s
annual report for the current year (Year 3), which contains no comparative data other
than the summary of the ratios listed below:
Year 3 Year 2 Year 1
Current ratio 2.6:1 2.3:1 2.1:1
Acid-test ratio 0.8:1 1.0:1 1.2:1
Accounts receivable turnover 10.0 times 10.1 times 10.5 times
Inventory turnover 6.1 times 8.1 times 8.3 times
Return on total assets 15.50% 12.10% 10.30%
Return on common stockholders’ equity 18.10% 14.70% 11.90%
Price-earnings ratio 12.3 17.2 17.7
Earnings per share $1.53 $1.52 $1.55
Are customers paying their accounts as well as they were in Year 1? Support your
answer with accounting justification citing specific information in the analysis.
Answer

Chapter 14 Analyzing Financial Statements: A Managerial Perspective
14–63
153. The following information for 2018 and 2017 is presented for BuyRite:
December 31
Assets 2018 2017
Current assets:
Cash $ 42,000 $ 54,000
Accounts receivable 580,000 445,000
Inventory 5,010,000 4,950,000
Prepaid expenses 84,000 79,000
Total current assets 5,716,000 5,528,000
Building and equipment, net 1,097,000 1,095,000
Total assets $6,813,000 $6,623,000
Liabilities and Stockholders’ Equity
Current liabilities:
Accounts payable $ 605,000 $ 628,000
Bank loan payable 679,000 625,000
Other accrued payables 215,000 315,000
Total current liabilities 1,499,000 1,568,000
Long-term debt 1,729,000 1,791,000
Total liabilities 3,228,000 3,359,000
Stockholders’ equity:
Common stock 1,307,000 1,307,000
Retained earnings 2,278,000 1,957,000
Total stockholders’ equity 3,585,000 3,264,000
Total liabilities and stockholders’ equity $6,813,000 $6,623,000
There were 100,000 shares of common stock outstanding throughout both 2017 and 2018.
Additional information follows:
2018 2017
Market price per share at the end of year $ 134 $ 110
Net income for the year 815,000 639,000
Cost of goods sold for the year 2,900,000 2,700,000
Net sales for the year 5,568,000 5,253,000
a. Calculate the 1) current ratio, 2) acid-test ratio, and the 3) debt–to-equity ratio for
2017 and 2018. Calculate to three significant digits.
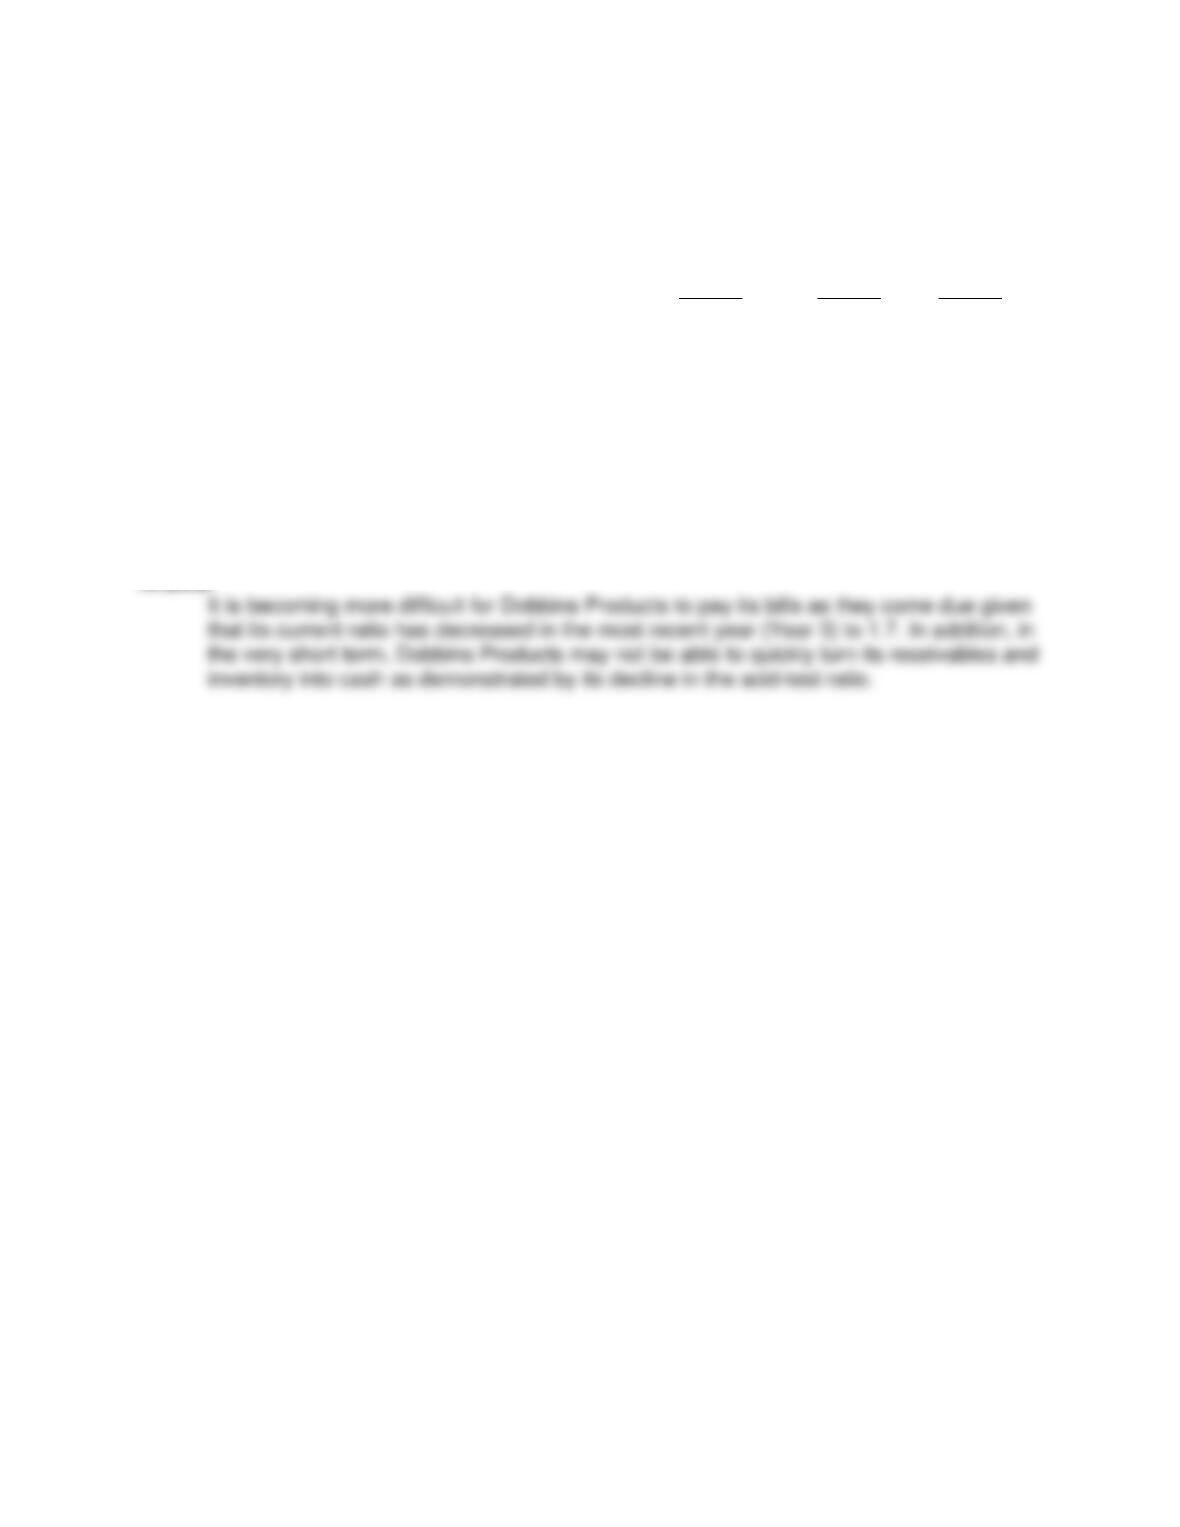
b. The company intends to apply for a loan. What concerns might the loan officer
have about lending to the company?
Test Bank to accompany Jiambalvo Managerial Accounting, 6th Edition
14–64
154. Wyatt Parks is interested in purchasing the stock of Dobbins Products, a company that
sells bricks to the construction industry. Before purchasing the stock, Parks would like to
learn as much as possible about the company. However, all he has to go on is the
current year’s (Year 3) annual report, which contains no comparative data other than the
summary of the ratios given below:
Year 3 Year 2 Year 1
Current ratio 1.7 2.3 2.1
Acid-test (quick) ratio 0.8 1.0 1.2
Accounts receivable turnover 8.9 times 10.1 times 12.5 times
Inventory turnover 6.1 times 8.1 times 8.3 times
Return on total assets 15.50% 12.10% 10.30%
Return on common stockholders’ equity 18.10% 14.70% 11.90%
Price-earnings ratio 12.3 17.2 17.7
Earnings per share $1.53 $1.52 $1.55
Is it becoming easier for the company to pay its bills as they come due? Support your
answer with accounting justification citing specific information in the analysis.
Answer

Chapter 14 Analyzing Financial Statements: A Managerial Perspective
14–65
155. Comparative financial statements for Smart Buy for the years ending December 31,
2018 and 2017 are shown below:
December 31
Assets 2018 2017
Current assets:
Cash $ 14,000 $ 12,458
Accounts receivable 45,489 35,486
Inventory 39,239 32,568
Prepaid expenses 3,400 2,581
Total current assets 102,128 83,093
Long-term investments 128,580 104,600
Property, plant and equipment, net 789,145 771,258
Total assets $1,019,853 $958,951
Liabilities and Stockholders’ Equity
Current liabilities:
Accounts payable $ 98,789 $ 85,451
Other current liabilities 3,456 5,157
Total current liabilities 102,245 90,608
Long-term debt 456,781 414,760
Total liabilities 559,026 505,368
Stockholders’ equity:
Common stock 100,000 100,000
Additional paid-in capital 275,000 275,000
Retained earnings 85,827 78,583
Total stockholders’ equity 460,827 453,583
Total liabilities and stockholders’ equity $1,019,853 $ 958,951
Year Ended December 31
2018 2017
Net sales $2,281,789 $2,074,354
Cost of goods sold 1,505,981 1,348,330
Gross margin 775,808 726,024
Operating expenses 458,245 420,408
Operating income 317,563 305,616
Interest expense 36,542 33,181
Earnings before income taxes 281,021 272,435
Income tax expense 98,357 95,352
Net earnings $ 182,664 $ 177,083
Calculate the following ratios for 2018 for Smart Buy:
a. Current ratio
b. Quick ratio
c. Debt-to-equity ratio
d. Times interest earned
Answer

Test Bank to accompany Jiambalvo Managerial Accounting, 6th Edition
14–66
CHALLENGE EXERCISES
156. Comparative balance sheets for Save-A-Penny for the years ending December 31, 2018
and 2017 are shown below:
December 31
Assets
2018
2017
Current assets:
Cash
$ 15,600
$ 14,200
Accounts receivable
19,800
17,500
Inventory
21,200
24,500
Prepaid expenses
3,100
4,800
Total current assets
59,700
61,000
Property, plant and equipment, net
285,300
266,000
Total assets
$345,000
$327,000
Liabilities and Stockholders’ Equity
Current liabilities:
Accounts payable
$ 14,500
$ 15,900
Other current liabilities
26,500
23,100
Total current liabilities
41,000
39,000
Long-term debt
216,000
204,000
Total liabilities
257,000
243,000
Stockholders’ equity:
Common stock
22,000
19,800
Retained earnings
66,000
64,200
Total stockholders’ equity
88,000
84,000
Total liabilities and stockholders’ equity
$345,000
$327,000
Selected additional amounts for Save-A-Penny follow for the years ending December 31,
2018 and 2017:
Year Ended December 31
2018
2017
Net sales
$432,000
$398,000
Interest expense
12,900
12,000
Income tax expense
15,900
15,600
Net earnings
37,100
36,400
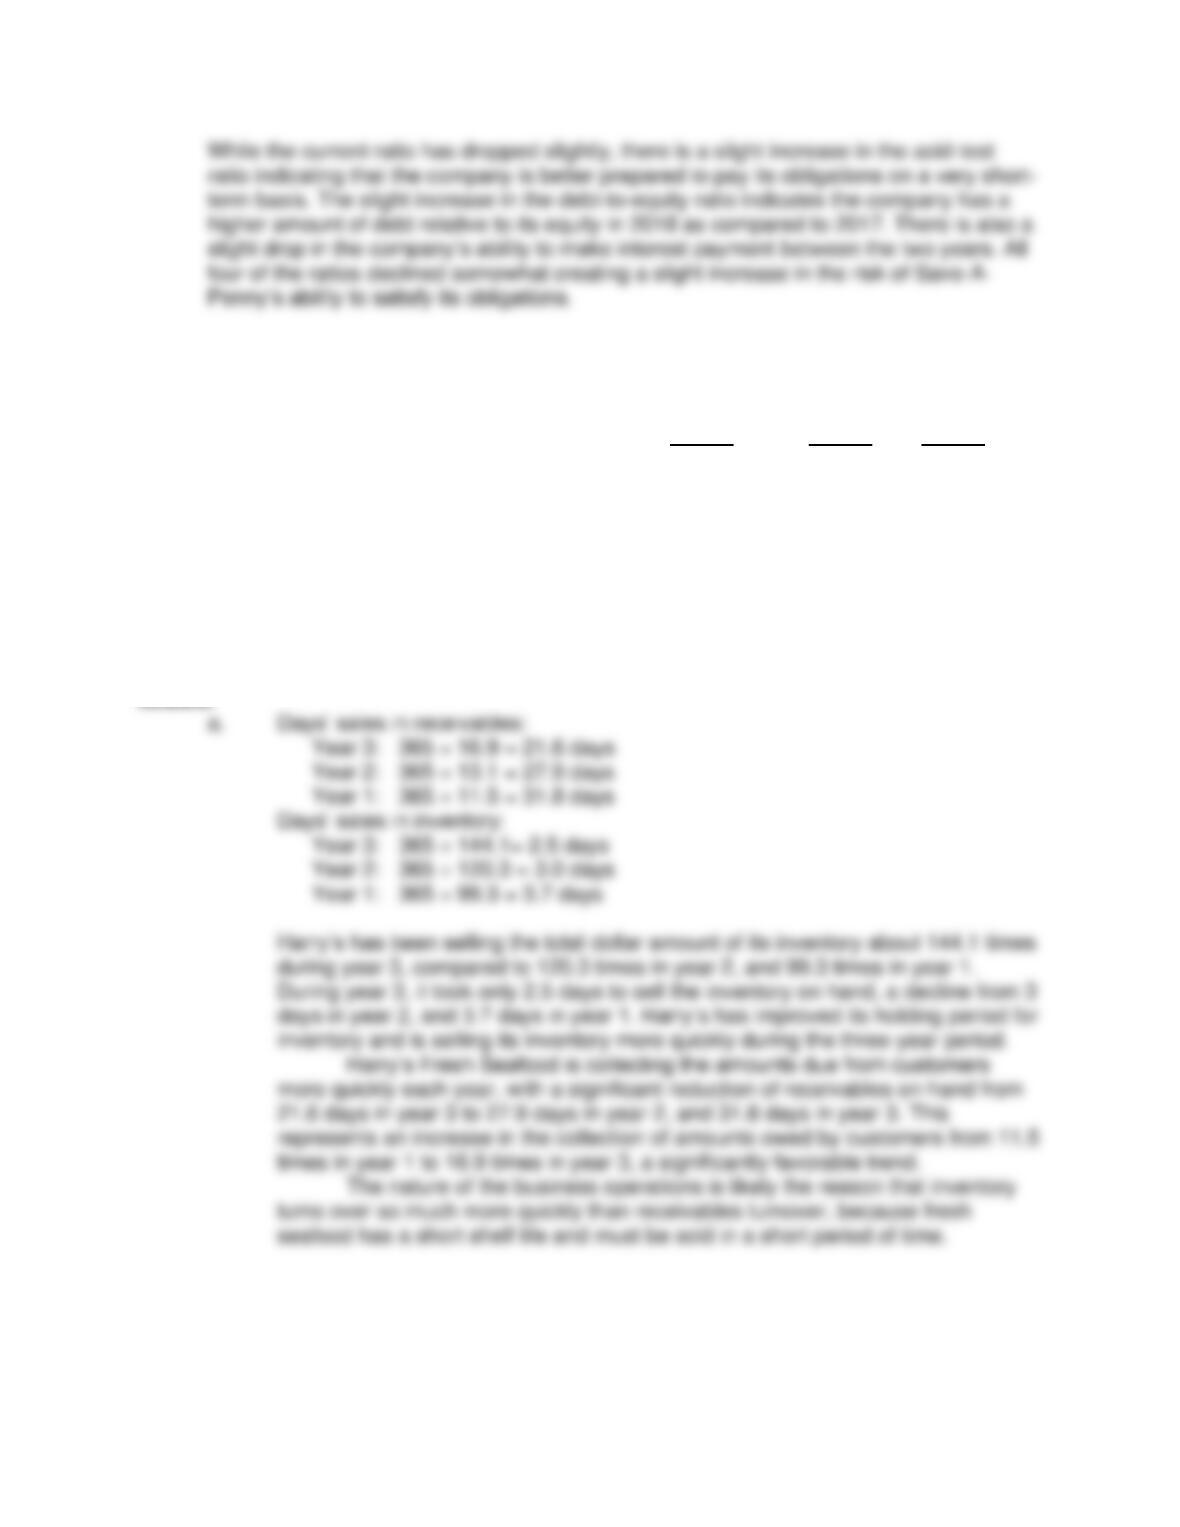
Calculate at least 3 debt-related ratios for Save-A-Penny for 2018 and 2017. Evaluate
the risk considerations and any changes between the two years as it relates to Save-A-
Penny’s ability to satisfy its obligations.
Chapter 14 Analyzing Financial Statements: A Managerial Perspective
14–67
157. Harry’s Fresh Seafood just completed its first three years of operations. The accountant
performed the following ratio analysis for the company:
Year 3 Year 2 Year 1
Accounts receivable turnover 16.9 times 13.1 times 11.5 times
Inventory turnover 144.1 times 120.3 times 99.3 times
a. Calculate day’s sale in receivables and day’s sales in inventory for all three
years. Interpret the ratios.
b. Evaluate the efficiency with which Harry’s Fresh Seafood manages its
receivables and inventory. Interpret the ratios and support your answer with
accounting justification citing specific information in the analysis.
c. For what reason do the two turnovers differ so dramatically?
Answer

Test Bank to accompany Jiambalvo Managerial Accounting, 6th Edition
14–68
158. Comparative balance sheets for Save-A-Penny for the years ending December 31, 2018
and 2017 are shown below:
December 31
Assets
2018
2017
Current assets:
Cash
$ 15,600
$ 14,200
Accounts receivable
19,800
17,500
Inventory
21,200
24,500
Prepaid expenses
3,100
4,800
Total current assets
59,700
61,000
Property, plant and equipment, net
285,300
266,000
Total assets
$345,000
$327,000
Liabilities and Stockholders’ Equity
Current liabilities:
Accounts payable
$ 14,500
$ 15,900
Other current liabilities
26,500
23,100
Total current liabilities
41,000
39,000
Long-term debt
216,000
204,000
Total liabilities
257,000
243,000
Stockholders’ equity:
Common stock, $2 par value
22,000
19,800
Retained earnings
66,000
64,200
Total stockholders’ equity
88,000
84,000
Total liabilities and stockholders’ equity
$345,000
$327,000
Additional information follows for the years ending December 31, 2018 and 2017:
Year Ended December 31
2018
2017
Net sales
$432,000
$398,000
Net earnings
37,100
36,400
Income tax expense
15,900
14,200
End of year stock price per share
18.00
15.00
Dividends paid
4,000
1,800
The shares outstanding during 2018 totaled 10,200, with 9,900 outstanding during 2017.
Calculate earnings per share, the price-earnings ratio, and return on common
stockholders’ equity for Save-A-Penny for 2018 and 2017. Evaluate the company’s
profitability and any changes between the two years.
Answer
Chapter 14 Analyzing Financial Statements: A Managerial Perspective
14–69
Test Bank to accompany Jiambalvo Managerial Accounting, 6th Edition
14–70
SHORT-ANSWER ESSAYS
159. List three reasons why managers need to be able to analyze financial statements.
Answer
160. What are the three major financial statements and what information does each contain?
161. Explain the nature of horizontal and vertical analysis.
Answer
162. Explain why net interest is added back to net income to calculate return on total assets.
Answer
163. What sources other than financial statements are used to analyze a company and what
information is available from those sources?
Answer
Chapter 14 Analyzing Financial Statements: A Managerial Perspective
14–71
164. Why is the accounts receivable turnover that is computed from published financial
statements often misleading?
Answer
165. What is financial leverage and how can you tell if it is being used effectively?
Answer
166. Turnover ratios measure a key business ‘efficiency’. What efficiency is measured by
asset turnover? Why is efficiency important for a company?
Answer