
Chapter 14 Analyzing Financial Statements: A Managerial Perspective
14–41
128. Comparative financial statements for Cross, Inc. are shown below:
December 31
Assets 2018 2017
Current assets:
Cash $ 89,103 $ 68,203
Accounts receivable 142,000 135,000
Inventory 96,708 85,694
Prepaid expenses 21,203 5,118
Total current assets 349,014 294,015
Property, plant and equipment, net 822,576 718,144
Total assets $1,171,590 $1,012,159
Liabilities and Stockholders’ Equity
Current liabilities:
Accounts payable $ 85,443 $ 62,394
Other current liabilities 38,112 33,507
Total current liabilities 123,555 95,901
Long-term debt 302,430 290,324
Total liabilities 425,985 386,225
Stockholders’ equity:
Common stock 600,000 600,000
Retained earnings 145,605 25,934
Total stockholders’ equity 745,605 625,934
Total liabilities and stockholders’ equity $1,171,590 $1,012,159
Year Ended December 31
2018 2017
Net sales $17,005,852 $13,809,585
Cost of goods sold 12,250,257 9,825,614
Gross margin 4,755,595 3,983,971
Operating expense 3,585,657 3,400,258
Operating income 1,169,938 583,713
Interest expense 28,500 27,300
Earnings before tax 1,141,438 556,413
Income taxes 342,431 166,924
Net income $ 799,007 $ 389,489
How much is days’ sales in inventory for Cross, Inc. for 2018?
A. 2.9 days
B. 510 days
C. 34.8 days
D. 126.7 days

Test Bank to accompany Jiambalvo Managerial Accounting, 6th Edition
14–42
129. Comparative financial statements for Cross, Inc. are shown below:
December 31
Assets 2018 2017
Current assets:
Cash $ 89,103 $ 68,203
Accounts receivable 142,000 135,000
Inventory 96,708 85,694
Prepaid expenses 21,203 5,118
Total current assets 349,014 294,015
Property, plant and equipment, net 822,576 718,144
Total assets $1,171,590 $1,012,159
Liabilities and Stockholders’ Equity
Current liabilities:
Accounts payable $ 85,443 $ 62,394
Other current liabilities 38,112 33,507
Total current liabilities 123,555 95,901
Long-term debt 302,430 290,324
Total liabilities 425,985 386,225
Stockholders’ equity:
Common stock 600,000 600,000
Retained earnings 145,605 25,934
Total stockholders’ equity 745,605 625,934
Total liabilities and stockholders’ equity $1,171,590 $1,012,159
Year Ended December 31
2018 2017
Net sales $17,005,852 $13,809,585
Cost of goods sold 12,250,257 9,825,614
Gross margin 4,755,595 3,983,971
Operating expense 3,585,657 3,400,258
Operating income 1,169,938 583,713
Interest expense 28,500 27,300
Earnings before tax 1,141,438 556,413
Income taxes 342,431 166,924
Net income $ 799,007 $ 389,489
How much is accounts receivable turnover for Cross, Inc. for 2018?
A. 3.1 times
B. 28.0 times
C. 119.8 times
D. 5.6 times

Chapter 14 Analyzing Financial Statements: A Managerial Perspective
14–43
130. Comparative financial statements for Cross, Inc. are shown below:
December 31
Assets 2018 2017
Current assets:
Cash $ 89,103 $ 68,203
Accounts receivable 142,000 135,000
Inventory 96,708 85,694
Prepaid expenses 21,203 5,118
Total current assets 349,014 294,015
Property, plant and equipment, net 822,576 718,144
Total assets $1,171,590 $1,012,159
Liabilities and Stockholders’ Equity
Current liabilities:
Accounts payable $ 85,443 $ 62,394
Other current liabilities 38,112 33,507
Total current liabilities 123,555 95,901
Long-term debt 302,430 290,324
Total liabilities 425,985 386,225
Stockholders’ equity:
Common stock 600,000 600,000
Retained earnings 145,605 25,934
Total stockholders’ equity 745,605 625,934
Total liabilities and stockholders’ equity $1,171,590 $1,012,159
Year Ended December 31
2018 2017
Net sales $17,005,852 $13,809,585
Cost of goods sold 12,250,257 9,825,614
Gross margin 4,755,595 3,983,971
Operating expense 3,585,657 3,400,258
Operating income 1,169,938 583,713
Interest expense 28,500 27,300
Earnings before tax 1,141,438 556,413
Income taxes 342,431 166,924
Net income $ 799,007 $ 389,489
What is the most likely explanation for the change in Cross’ accounts receivable turnover
from 2017 to 2018?
A. The company is collecting amounts due from customers more agressively.
B. The company’s sales are primarily cash sales which do not result in receivables.
C. The company makes primarily credit sales and has very easy credit terms.
D. None of these answer choices are possible explanations.

Test Bank to accompany Jiambalvo Managerial Accounting, 6th Edition
14–44
131. Comparative financial statements for Cross, Inc. are shown below:
December 31
Assets 2018 2017
Current assets:
Cash $ 89,103 $ 68,203
Accounts receivable 142,000 135,000
Inventory 96,708 85,694
Prepaid expenses 21,203 5,118
Total current assets 349,014 294,015
Property, plant and equipment, net 822,576 718,144
Total assets $1,171,590 $1,012,159
Liabilities and Stockholders’ Equity
Current liabilities:
Accounts payable $ 85,443 $ 62,394
Other current liabilities 38,112 33,507
Total current liabilities 123,555 95,901
Long-term debt 302,430 290,324
Total liabilities 425,985 386,225
Stockholders’ equity:
Common stock 600,000 600,000
Retained earnings 145,605 25,934
Total stockholders’ equity 745,605 625,934
Total liabilities and stockholders’ equity $1,171,590 $1,012,159
Year Ended December 31
2018 2017
Net sales $17,005,852 $13,809,585
Cost of goods sold 12,250,257 9,825,614
Gross margin 4,755,595 3,983,971
Operating expense 3,585,657 3,400,258
Operating income 1,169,938 583,713
Interest expense 28,500 27,300
Earnings before tax 1,141,438 556,413
Income taxes 342,431 166,924
Net income $ 799,007 $ 389,489
How much is Cross’ current ratio at the end of 2018?
A. 1.9
B. 2.8
C. 0.4
D. 0.3

Chapter 14 Analyzing Financial Statements: A Managerial Perspective
14–45
132. Comparative financial statements for Cross, Inc. are shown below:
December 31
Assets 2018 2017
Current assets:
Cash $ 89,103 $ 68,203
Accounts receivable 142,000 135,000
Inventory 96,708 85,694
Prepaid expenses 21,203 5,118
Total current assets 349,014 294,015
Property, plant and equipment, net 822,576 718,144
Total assets $1,171,590 $1,012,159
Liabilities and Stockholders’ Equity
Current liabilities:
Accounts payable $ 85,443 $ 62,394
Other current liabilities 38,112 33,507
Total current liabilities 123,555 95,901
Long-term debt 302,430 290,324
Total liabilities 425,985 386,225
Stockholders’ equity:
Common stock 600,000 600,000
Retained earnings 145,605 25,934
Total stockholders’ equity 745,605 625,934
Total liabilities and stockholders’ equity $1,171,590 $1,012,159
Year Ended December 31
2018 2017
Net sales $17,005,852 $13,809,585
Cost of goods sold 12,250,257 9,825,614
Gross margin 4,755,595 3,983,971
Operating expense 3,585,657 3,400,258
Operating income 1,169,938 583,713
Interest expense 28,500 27,300
Earnings before tax 1,141,438 556,413
Income taxes 342,431 166,924
Net income $ 799,007 $ 389,489
How much is Cross’ acid-test ratio at the end of 2018?
A. 2.8
B. 0.7
C. 2.7
D. 1.9

Test Bank to accompany Jiambalvo Managerial Accounting, 6th Edition
14–46
133. Comparative financial statements for Cross, Inc. are shown below:
December 31
Assets 2018 2017
Current assets:
Cash $ 89,103 $ 68,203
Accounts receivable 142,000 135,000
Inventory 96,708 85,694
Prepaid expenses 21,203 5,118
Total current assets 349,014 294,015
Property, plant and equipment, net 822,576 718,144
Total assets $1,171,590 $1,012,15
Liabilities and Stockholders’ Equity
Current liabilities:
Accounts payable $ 85,443 $ 62,394
Other current liabilities 38,112 33,507
Total current liabilities 123,555 95,901
Long-term debt 302,430 290,324
Total liabilities 425,985 386,225
Stockholders’ equity:
Common stock 600,000 600,000
Retained earnings 145,605 25,934
Total stockholders’ equity 745,605 625,934
Total liabilities and stockholders’ equity $1,171,590 $1,012,159
Year Ended December 31
2018 2017
Net sales $17,005,852 $13,809,585
Cost of goods sold 12,250,257 9,825,614
Gross margin 4,755,595 3,983,971
Operating expense 3,585,657 3,400,258
Operating income 1,169,938 583,713
Interest expense 28,500 27,300
Earnings before tax 1,141,438 556,413
Income taxes 342,431 166,924
Net income $ 799,007 $ 389,489
How much is the company’s debt–to-equity ratio for 2018?
A. 0.571
B. 1.065
C. 0.364
D. 0.018

Chapter 14 Analyzing Financial Statements: A Managerial Perspective
14–47
134. Swanson Company has a current ratio of 2.1 and the following assets on December 31,
2017:
Cash $ 98,500
Accounts receivable, net 499,700
Inventory 960,000
Prepaid expenses 23,100
Equipment, net 2,284,800
Total assets $3,866,100
How much are the company’s current liabilities on December 31, 2017?
A. $285,000
B. $742,000
C. $753,000
D. $1,841,000
135. Chua Company has current liabilities totaling $1,500,000 and the following assets on
December 31 of the current year:
Cash $ 300,000
Accounts receivable, net 600,000
Inventory 960,000
Prepaid expenses 25,000
Equipment, net 2,200,000
Total assets $4,085,000
How much is the company’s acid-test ratio on December 31?
A. 0.20
B. 0.60
C. 1.26
D. 1.24
136. Chua Company has has a current ratio of 2.5 and the following assets on December 31,
2017:
Cash $ 300,000
Accounts receivable, net 600,000
Inventory 960,000
Prepaid expenses 25,000
Equipment, net 2,200,000
Total assets $4,085,000
The company paid an account payable of $175,000 immediately on January 1, 2018.
What effect did this have on the current ratio?
A. An increase to 2.95
B. There was no effect since both cash and accounts payable changed by the same
amount.
C. An increase to 2.50
D. A decrease to 2.26
Test Bank to accompany Jiambalvo Managerial Accounting, 6th Edition
14–48
137. Chua Company had a current ratio of 2.5 to 1 on December 31, 2017. On that date, the
company’s assets were as follows:
Cash $ 100,000
Accounts receivable, net 600,000
Inventory 960,000
Prepaid expenses 25,000
Equipment, net 2,200,000
Total assets $3,885,000
What impact will the declaration of a cash dividend by Chua have on its current ratio?
A. An increase in the current ratio
B. A decrease in the current ratio
C. No efffect on the current ratio
D. There is not enough information provided to determine the answer.
138. Chua Company had a current ratio of 2.5 to 1 on December 31, 2017. On that date, the
company’s assets were as follows:
Cash $ 100,000
Accounts receivable, net 600,000
Inventory 960,000
Prepaid expenses 25,000
Equipment, net 2,200,000
Total assets $3,885,000
What impact will the sale of inventory to customers for cash have on Chua’s debt–to–
equity ratio?
A. An increase in the debt–to-equity ratio
B. A decrease in the debt-to-equity ratio
C. No efffect on the debt-to-equity ratio
D. There is not enough information provided to determine the answer.
Chapter 14 Analyzing Financial Statements: A Managerial Perspective
14–49
Test Bank to accompany Jiambalvo Managerial Accounting, 6th Edition
14–50
MATCHING
139. Match each of the following terms with the phrase that most closely describes it. Each
answer may be used only once.
1. Balance sheet
2. Financial leverage
3. Gross margin
4. Horizontal analysis
5. Income statement
6. Investing activity
7. Management discussion and analysis
8. Operating activity
9. Statement of cash flows
10. Vertical analysis
A. Determines a the percentage change in each line item of financial statements
from one year to the next
B. Activities that impact long-term assets
C. A report that explains changes in various financial statement items
D. Using debt to increase returns to stockholders
E. Sales less cost of goods sold
F. Contains assets, liabilities, and stockholders’ equity at the end of the period
G. Indicates the revenues and expenses for the period
H. Indicates the sources and uses of cash and cash equivalents
I. Restates financial statement on a percentage basis based on total assets or net
sales
J. Indicates the cash generated by the ongoing activities of the business
Answers to Matching
Chapter 14 Analyzing Financial Statements: A Managerial Perspective
14–51
EXERCISES
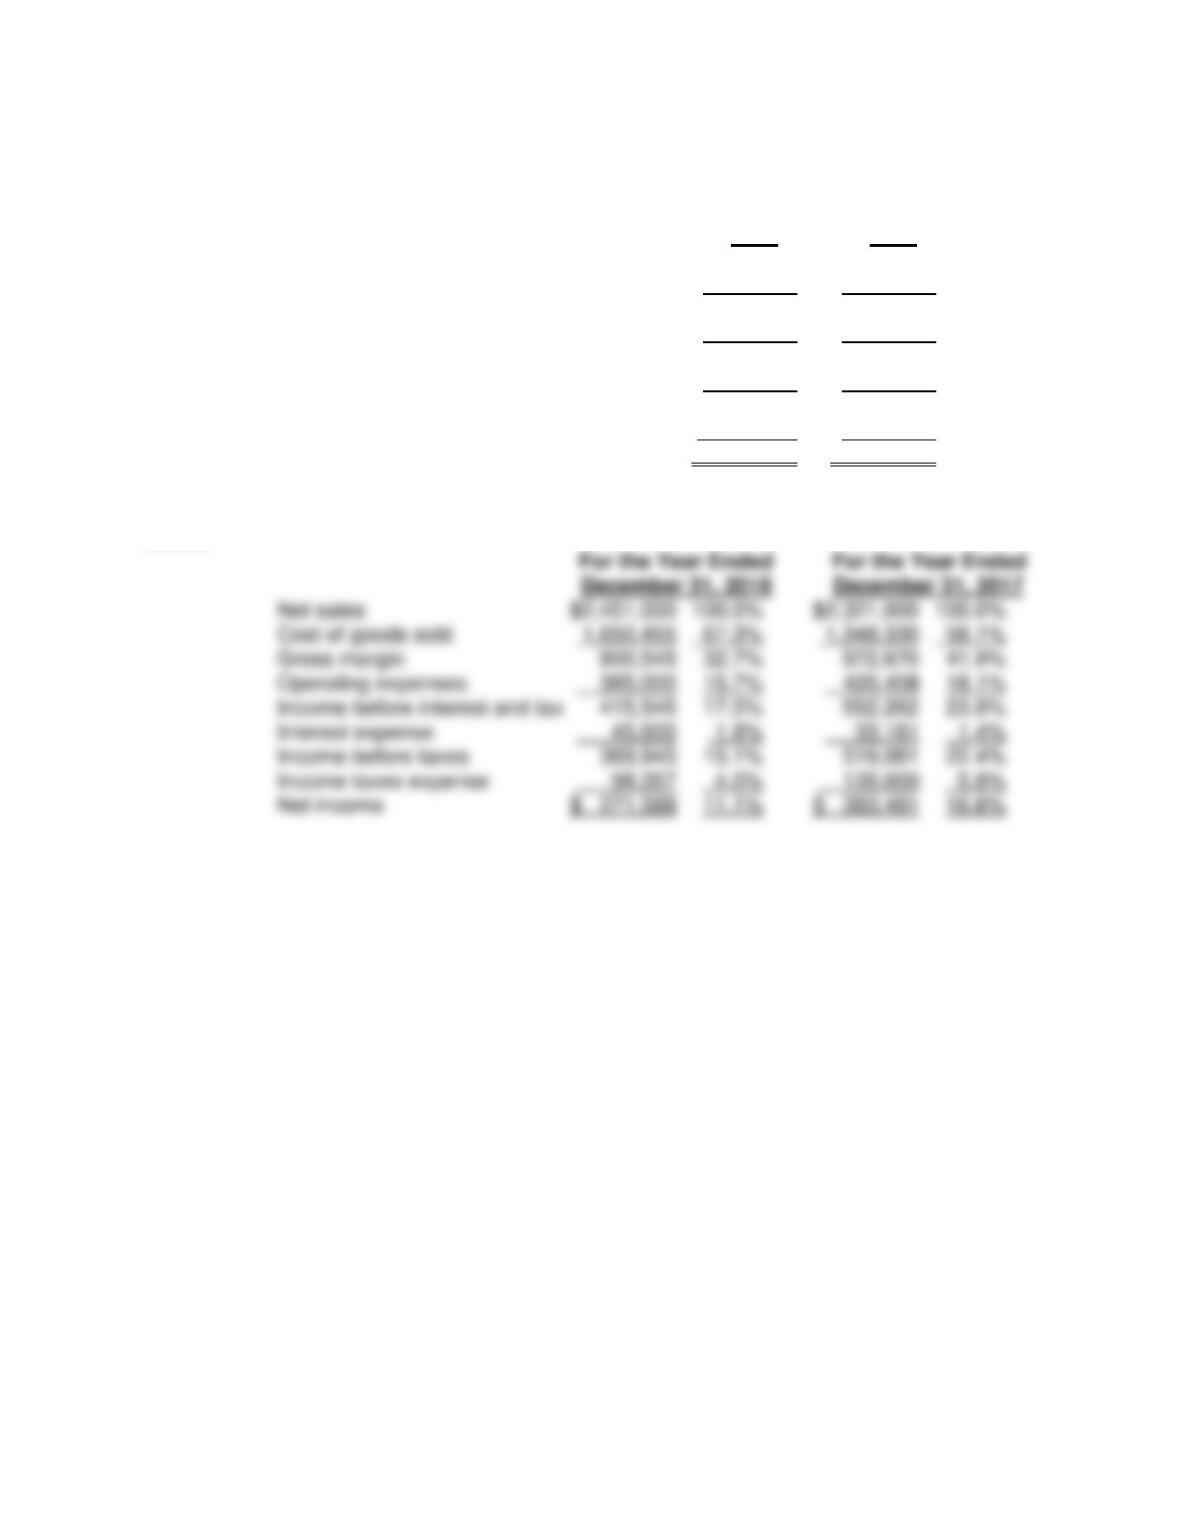
140. The liabilities and stockholders’ equity sections of comparative balance sheets for
Jenson International are presented below for 2018 and 2017:
December 31
2018 2017
Liabilities and Stockholders’ Equity
Current liabilities:
Accounts payable $ 67,500 $ 85,451
Other current liabilities 3,488 5,157
Total current liabilities 70,988 90,608
Long term debt 333,777 436,215
Total liabilities 404,765 526,823
Stockholders’ equity:
Common stock 100,000 100,000
Additional paid in capital 275,000 275,000
Retained earnings 350,171 78,583
Total stockholders’ equity 725,171 453,583
Total liabilities and stockholders’ equity $1,129,936 $980,406
Prepare a horizontal analysis of the liabilities and stockholders’ equity sections of
Jenson International’s balance sheets.
Answer
Test Bank to accompany Jiambalvo Managerial Accounting, 6th Edition
14–52
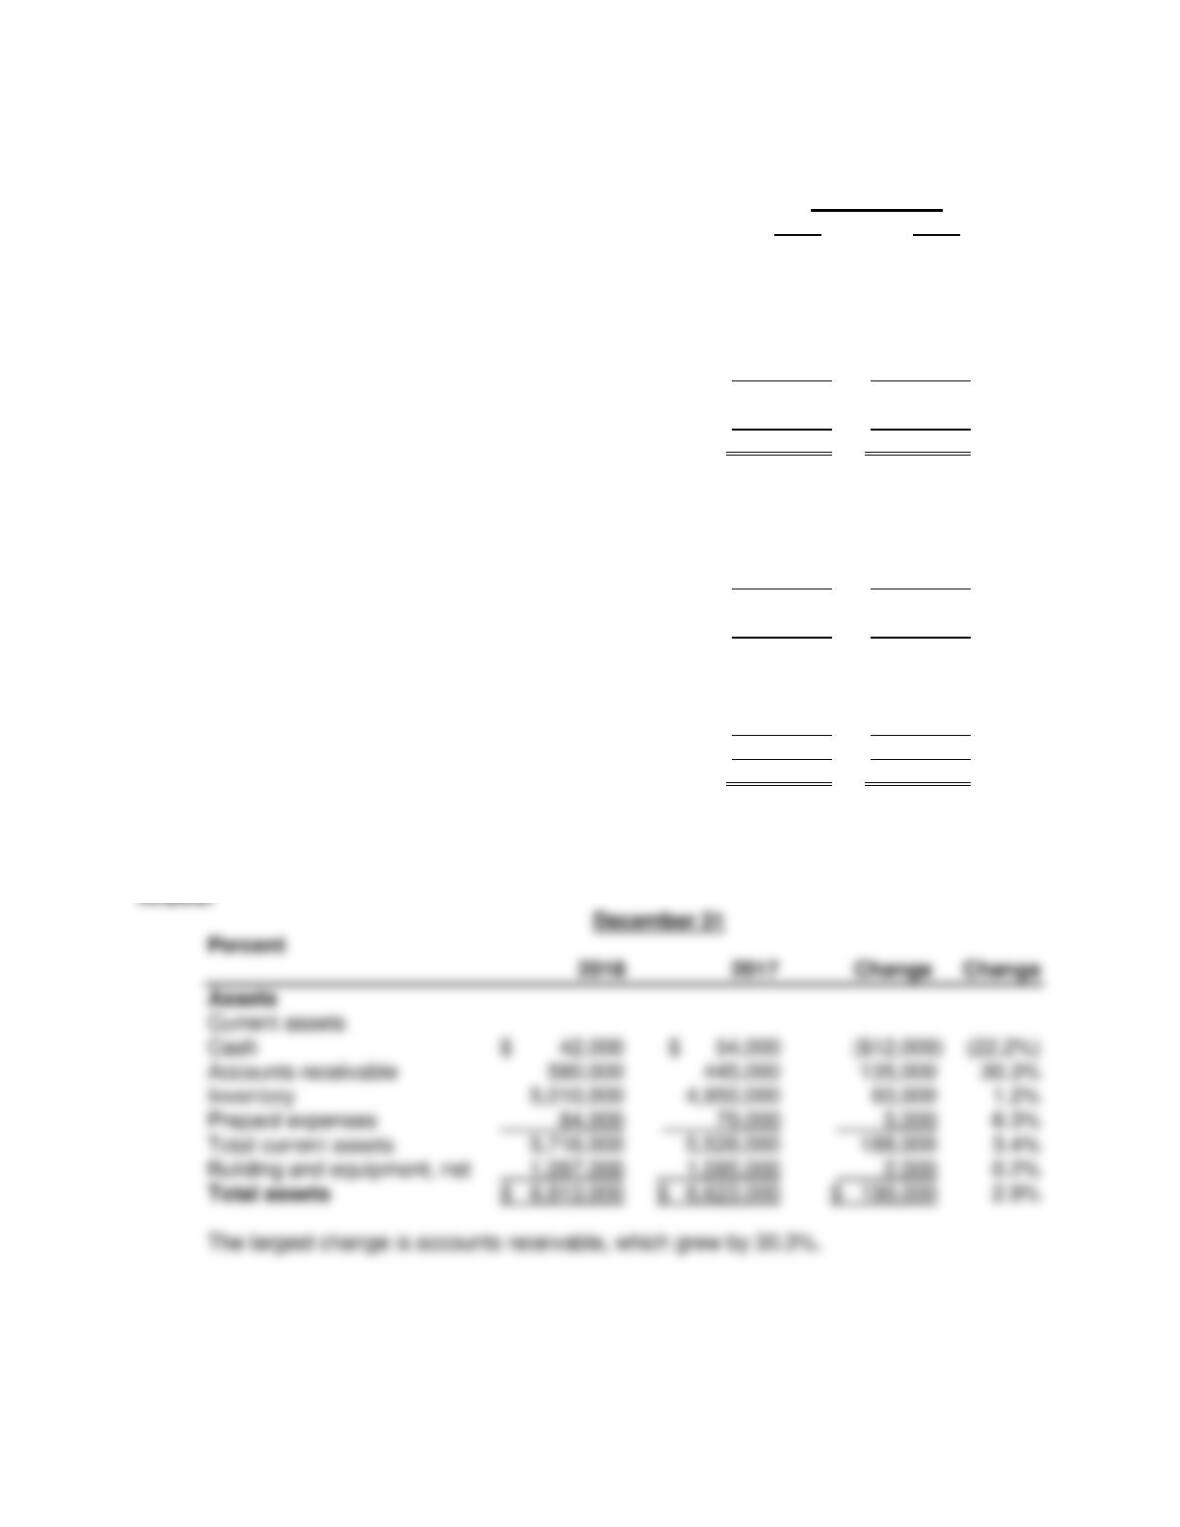
141. Comparative income statements for Jenson International are shown below for 2018 and
2017:
Year Ended December 31
2018 2017
Net sales $2,451,000 $2,321,000
Cost of goods sold 1,650,455 1,348,330
Gross margin 800,545 972,670
Operating expenses 385,000 420,408
Operating income 415,545 552,262
Interest expense 45,600 33,181
Income before taxes 369,945 519,081
Income taxes expense 98,357 135,600
Net income $ 271,588 $ 383,481
Prepare a vertical analysis of the company’s income statements.
Answer
Chapter 14 Analyzing Financial Statements: A Managerial Perspective
14–53
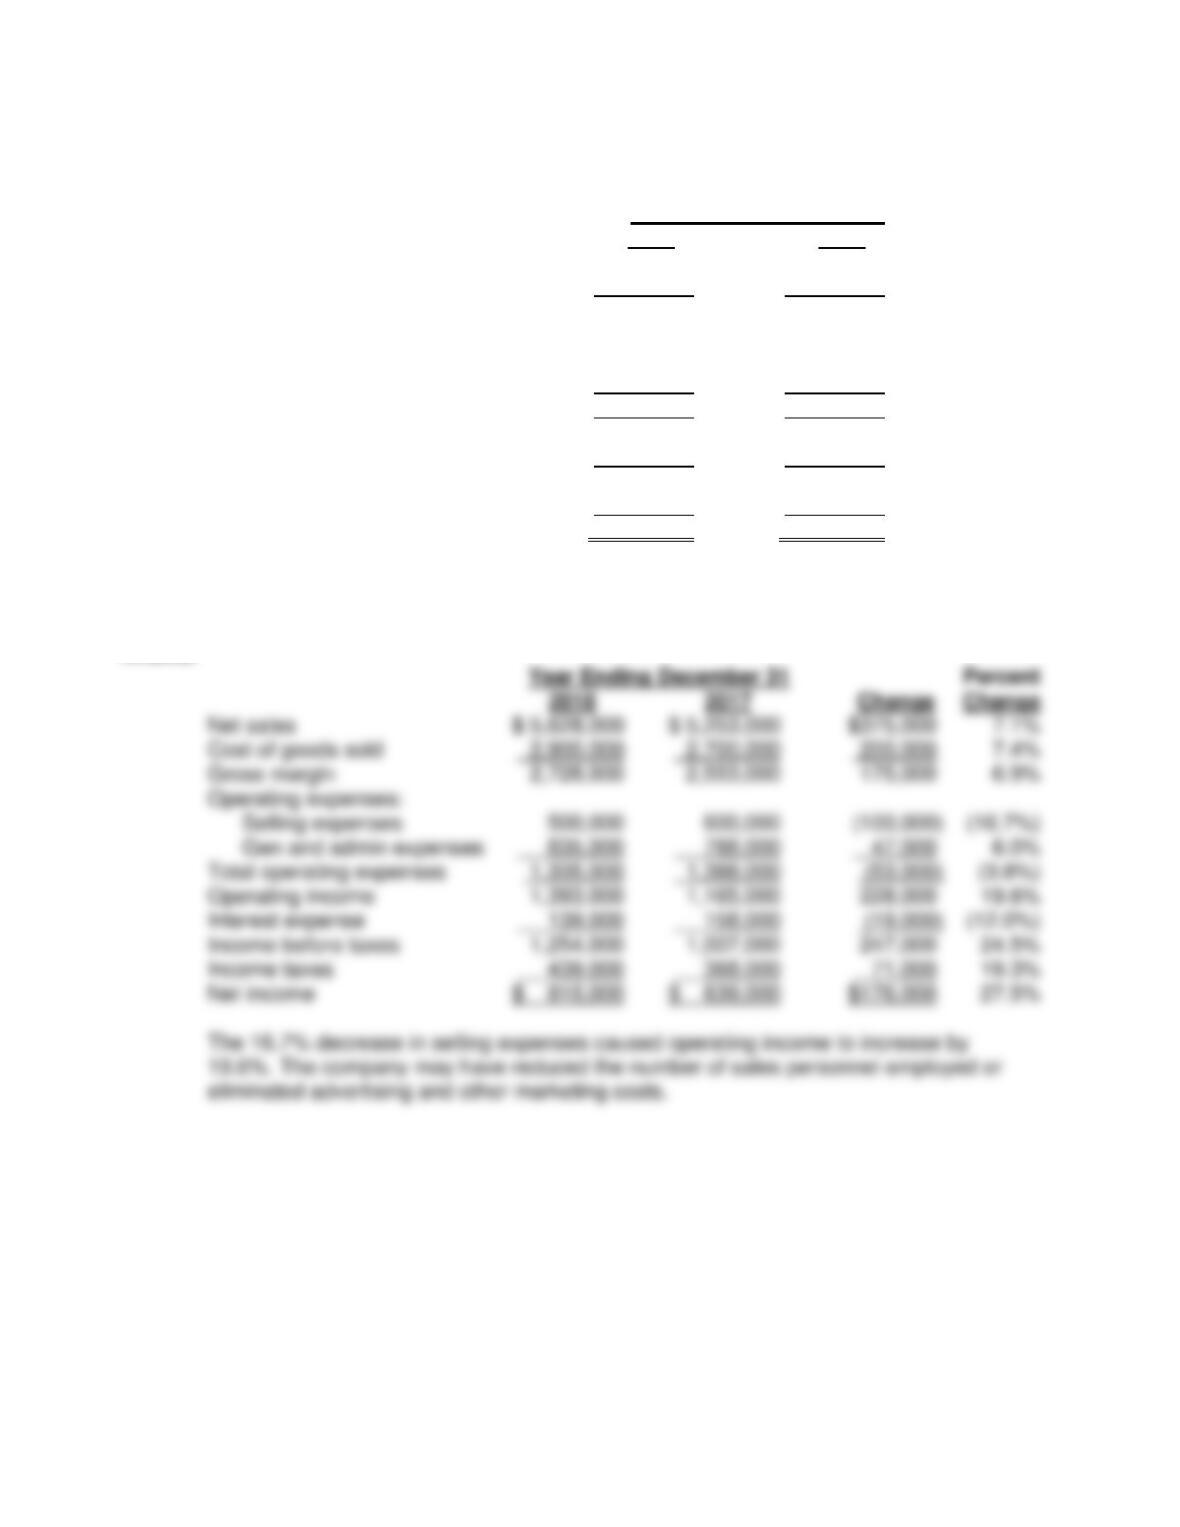
142. The following information for Redwood Junction, a retail furniture and design firm, is
presented for 2018 and 2017:
December 31
2018 2017
Assets
Current assets
Cash $ 42,000 $ 54,000
Accounts receivable 580,000 445,000
Inventory 5,010,000 4,950,000
Prepaid expenses 84,000 79,000
Total current assets 5,716,000 5,528,000
Building and equipment, net 1,097,000 1,095,000
Total assets $6,813,000 $6,623,000
Liabilities and Stockholders’ Equity
Current liabilities:
Accounts payable $ 605,000 $ 628,000
Bank loan payable 679,000 625,000
Other accrued payables 215,000 315,000
Total current liabilities 1,499,000 1,568,000
Long-term debt 1,729,000 1,791,000
Total liabilities 3,228,000 3,359,000
Stockholders’ equity:
Common stock 1,307,000 1,307,000
Retained earnings 2,278,000 1,957,000
Total stockholders’ equity 3,585,000 3,264,000
Total liabilities and stockholders’ equity $6,813,000 $6,623,000
Perform a horizontal analysis of the assets section of the balance sheets for Redwood
Junction. Identify the largest change.
Test Bank to accompany Jiambalvo Managerial Accounting, 6th Edition
14–54
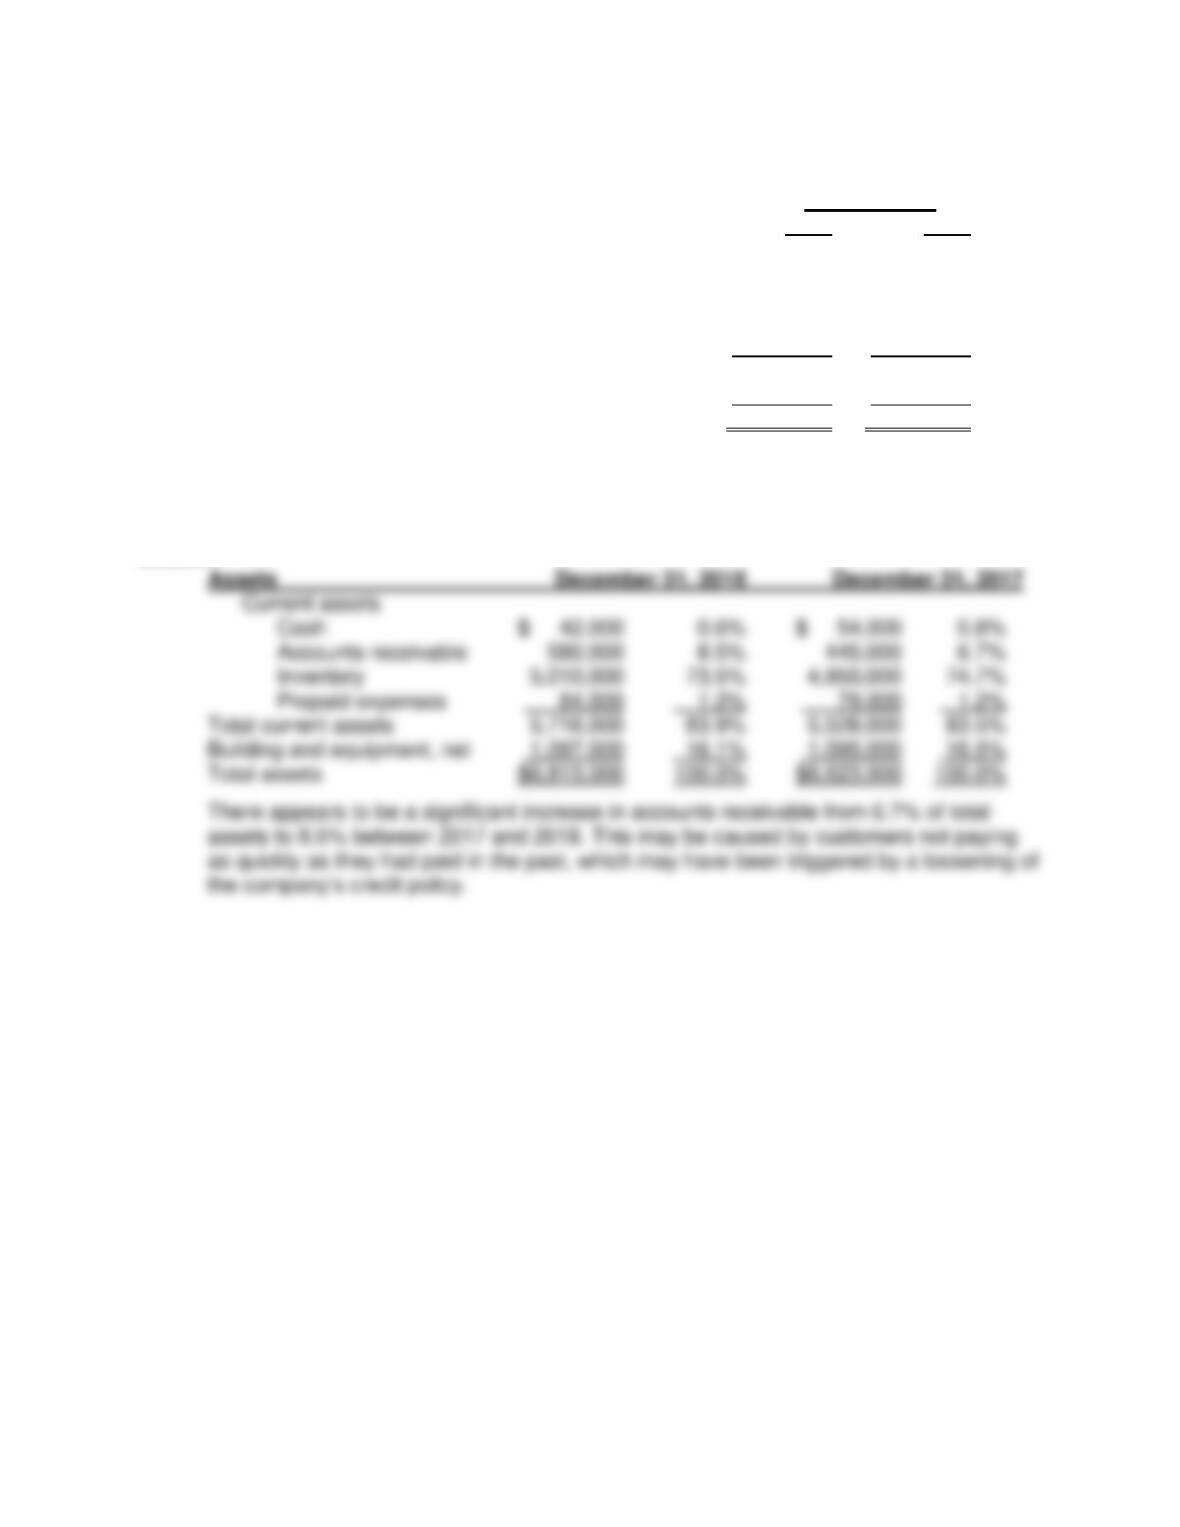
143. The following information for Woodchuck, a retail furniture and design firm, is presented
for the years ending December 31, 2018 and 2017:
Year Ended December 31
2018 2017
Net sales $5,628,000 $5,253,000
Cost of goods sold 2,900,000 2,700,000
Gross margin 2,728,000 2,553,000
Operating expenses:
Selling expenses 500,000 600,000
General and administrative expenses 835,000 788,000
Total operating expenses 1,335,000 1,388,000
Operating income 1,393,000 1,165,000
Interest expense 139,000 158,000
Income before taxes 1,254,000 1,007,000
Income taxes 439,000 368,000
Net income $ 815,000 $ 639,000
Perform a horizontal analysis of the income statements for Woodchuck. Identify the
largest change and list some of the causes that may have led to this change.
Answer
Chapter 14 Analyzing Financial Statements: A Managerial Perspective
14–55
144. The following information for Redwood Junction, a retail furniture and design firm, is
presented for 2018 and 2017:
December 31
Assets 2018 2017
Current assets
Cash $ 42,000 $ 54,000
Accounts receivable 580,000 445,000
Inventory 5,010,000 4,950,000
Prepaid expenses 84,000 79,000
Total current assets 5,716,000 5,528,000
Building and equipment, net 1,097,000 1,095,000
Total assets $6,813,000 $6,623,000
Perform a vertical analysis of the asset section of the balance sheets for the company.
Identify any major changes between 2017 and 2018. Indicate what could have led to the
changes you noted in this analysis.
Answer
Test Bank to accompany Jiambalvo Managerial Accounting, 6th Edition
14–56
145. Will Redmon is the CEO of Allistair Holdings, a company that manufactures and sells
eye care products. Will’s annual bonus depends on meeting a profit target of
$7,000,000, but late in the fourth quarter, the CFO brought Will the bad news that, based
on current orders, it appeared that earnings would be closer to $6,500,000. To deal with
the situation, Will and the CFO decided on the following strategy:
The company has firm orders for $2.5 million of merchandise to be delivered in
January and February of next year (the company’s fiscal year ends on December
31). Will proposes that the goods be shipped in December to a warehouse where
they will be held until required by customers. Customers will be billed in December
and receive a special 15 percent discount for accepting ownership upon shipment to
the warehouse. Allistair will pay for storage and insurance until the goods are
actually delivered to customer locations.
Explain how the strategy may constitute manipulation of earnings.
Answer
146. Will Redmon is the CEO of Allistair, a company that manufactures and sells eye care
products. Will’s annual bonus depends on meeting a profit target of $7,000,000, but late
in the fourth quarter the CFO brought Will the bad news that, based on current orders, it
appeared that earnings would be closer to $6,500,000. To deal with the situation, Will
and the CFO decided on the following strategy:
The company has firm orders for $2.5 million of merchandise to be delivered in
January and February of next year (the company’s fiscal year ends on December
31). Will proposes that the goods be shipped in December to a warehouse where
they will be held until required by customers. Customers will be billed in December
and receive a special 15 percent discount for accepting ownership upon shipment to
the warehouse. Allistair will pay for storage and insurance until the goods are
actually delivered to customer locations.
Comment on why and how a comparison of net income versus cash flow from
operations may reveal that this action was undertaken.
Answer