14-136
146.
14-138
147.
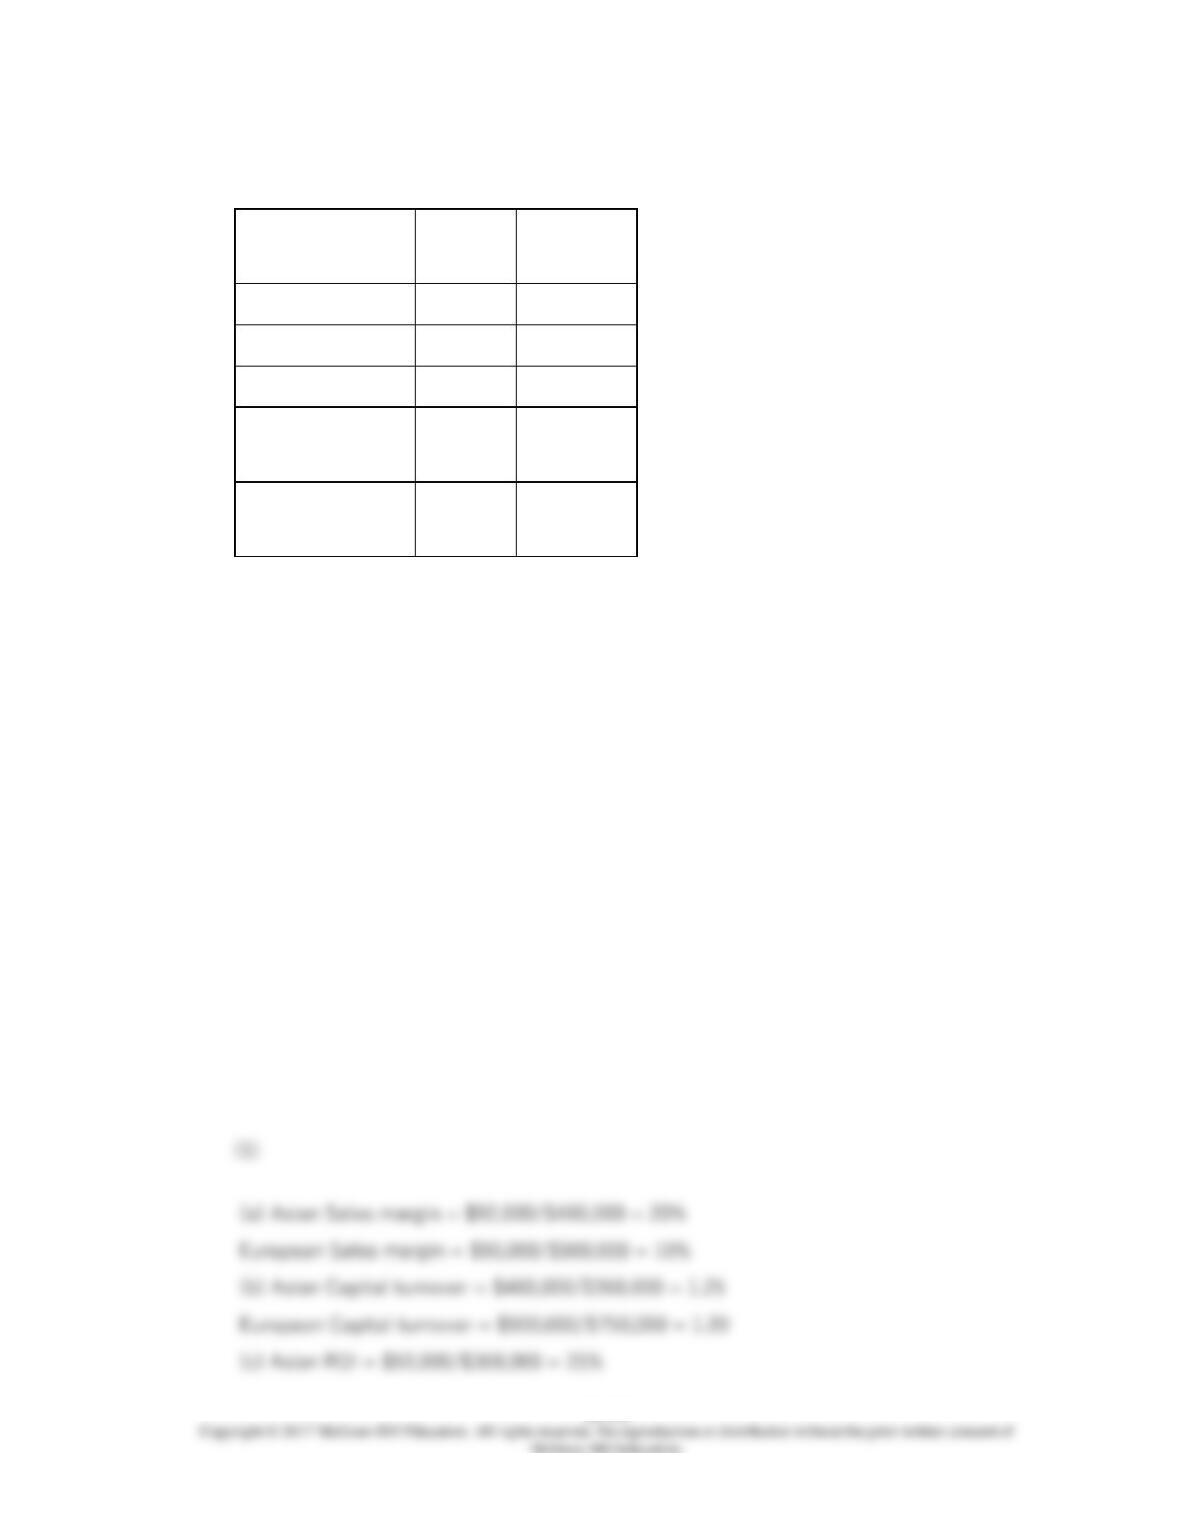
Mallory, Inc. has the following data available for two of its divisions for last year:
Asian
Division
European
Division
Sales
$460,000
$900,000
Contribution Margin
184,000
470,000
Operating income
92,000
90,000
Average operating
assets
368,000
750,000
Weighted average
cost of capital
14%
14%
14-140
148.
149.
Tran Company has the following financial statements for the year ended December 31,
2016.
14-141
Tran Company
Balance Sheet
For 2016
Cash
$1,600,000
Accounts Receivable
3,000,000
Inventory
2,500,000
Current Assets
$7,100,000
Long-Lived Assets
14,500,000
Total Assets
$21,600,000
Current Liabilities
$1,200,000
Long-Term Debt
2,400,000
Shareholder Equity
18,000,000
Total Debt and Equity
$21,600,000
Tran Company
Income Statement
For Year Ended Dec. 31, 2016
Sales
$20,000,000
Cost of Sales
15,000,000
Gross Margin
$5,000,000
Operating Expenses
2,500,000
Operating Income
$2,500,000
Taxes
1,000,000
Net Income
$1,500,000
Tran Company
Cash Flows from Operations
For Year Ended Dec. 31, 2016
Net Income
$1,500,000
Plus Depreciation Expense
1,000,000
14-142
+ Decrease (- Increase) in Acct. Rec.
& Inventory
—
+ Increase (- Decrease) in Current
Liabilities
—
Cash Flows from Operations
$2,500,000
Some additional information about 2016 includes:
Tran
Industry
Data
Year End Stock Price
$23.00
Number of Shares
Outstanding
1,800,000
Sales Multiplier
2.10
Free Cash Flow
Multiplier
22.00
Earnings Multiplier
18.00
Cost of Capital
5.0%
Accounts Receivable
Turnover
6.60
Inventory Turnover
5.80
Current Ratio
2.20
Quick Ratio
1.50
Cash flows from
Operations Ratio
1.50
Free Cash Flow Ratio
1.00
Gross Margin
Percentage
30%
Return on Assets (Net
Book Value)
18%
Return on Equity
22%
Training Expense
$500,000
14-143
Income Tax Rate
40%
Depreciation Expense
$1,000,000
Dividends
—
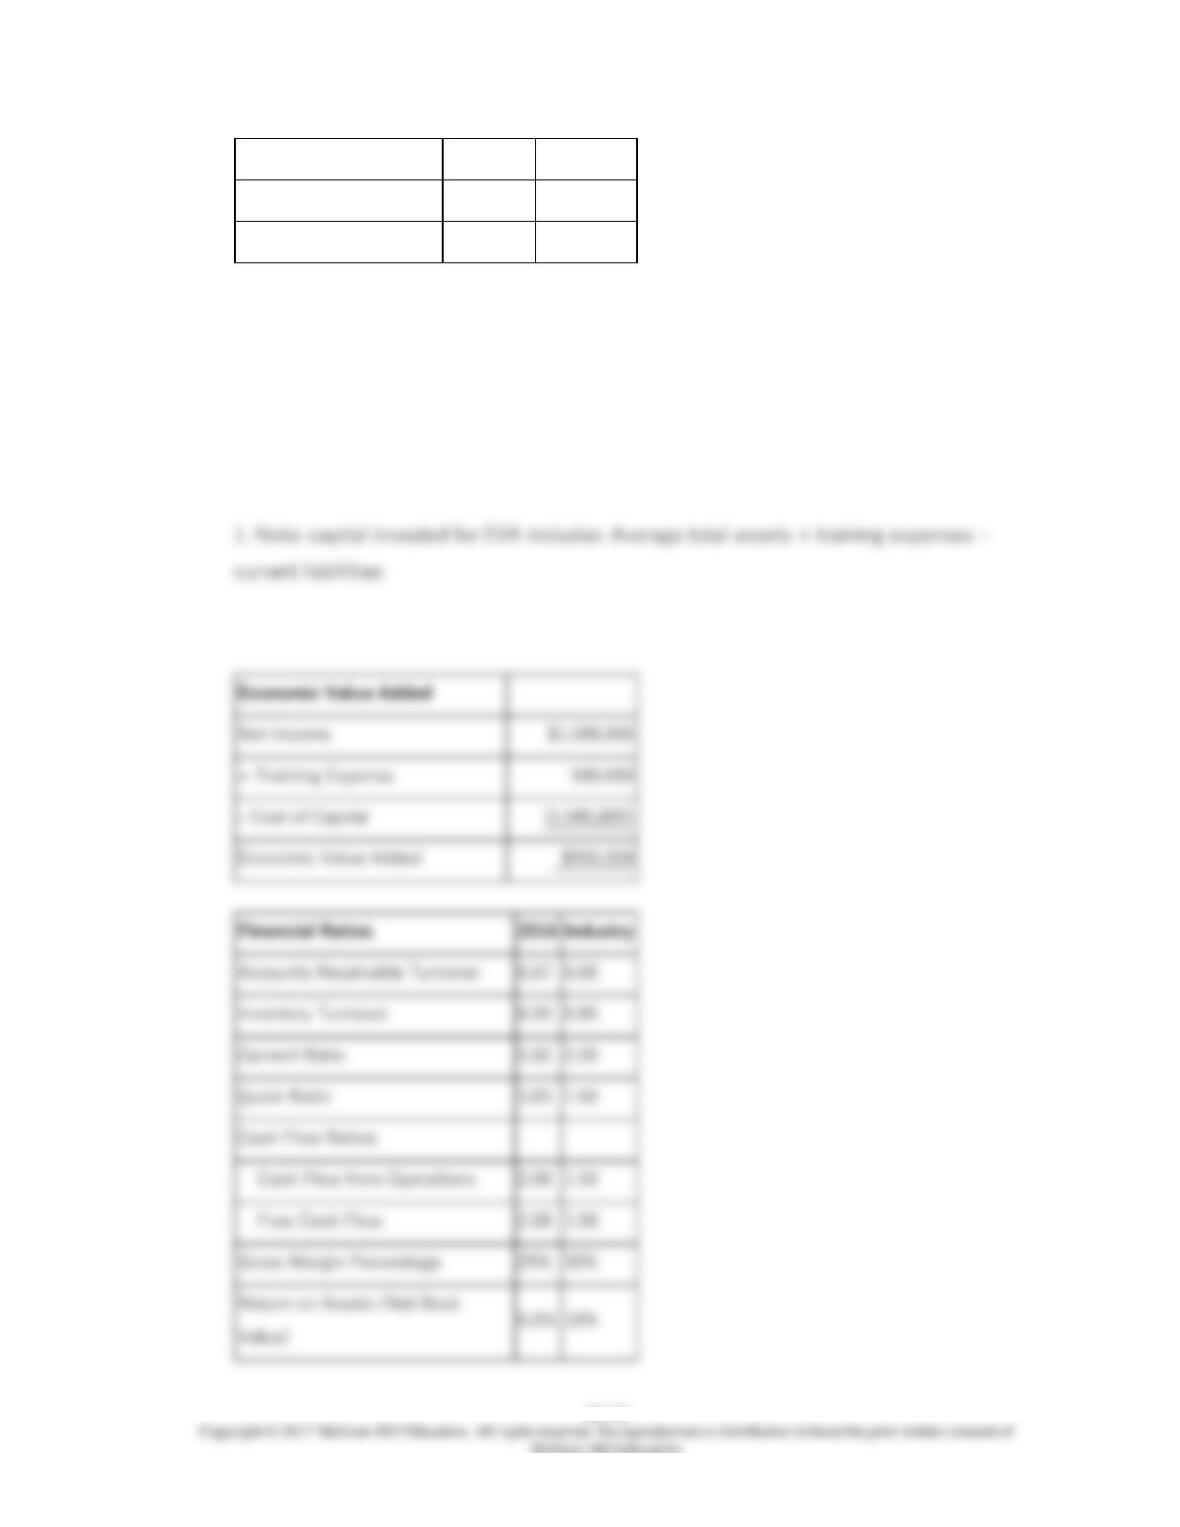
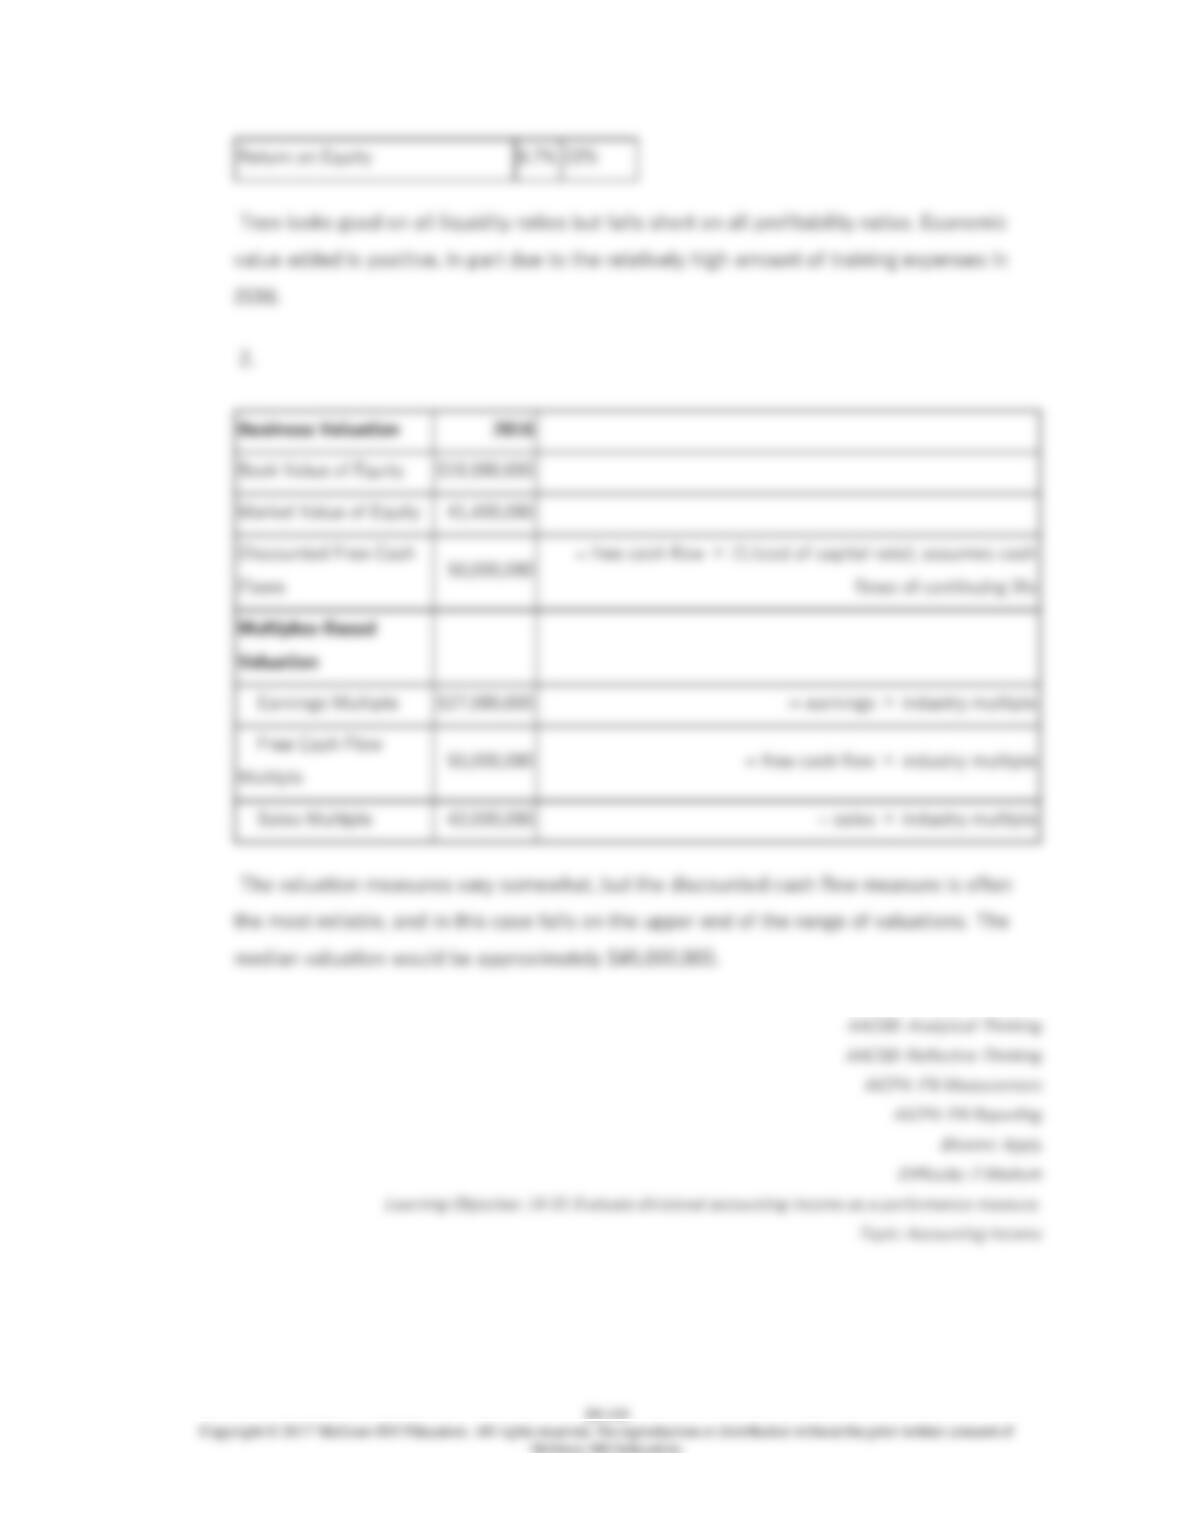
– Cost of Capital
Economic Value Added
6.67
6.60
6.00
5.80
5.92
2.20
3.83
1.50
Cash Flow Ratios
Cash Flow from Operations
2.08
1.00
14-145
150.
Suade Inc. manufactures furniture and is organized into three large divisions: bedroom,
living room, and dining room furniture. The following information presents operating
revenues, operating incomes and invested assets of the company over the last three years.
(all figures in 000s)
Operating Revenues
2016
2017
2018
Dining Room
$8,000
$15,000
$16,000
Living Room
4,500
3,600
2,400
Bedroom
8,800
7,600
6,600
Operating Income
Dining Room
$2,500
$3,100
$1,800
Living Room
450
900
600
Bedroom
1,200
1,500
1,600
Invested Assets
Dining Room
$12,000
$12,500
$12,500
Living Room
2,500
2,400
2,200
Bedroom
4,500
4,700
4,900
The following table shows the number of managers covered by the current compensation
package of Suade Inc.:
Number of Managers
2016
2017
2018
Dining Room
300
350
375
Living Room
40
40
37
Bedroom
120
140
175
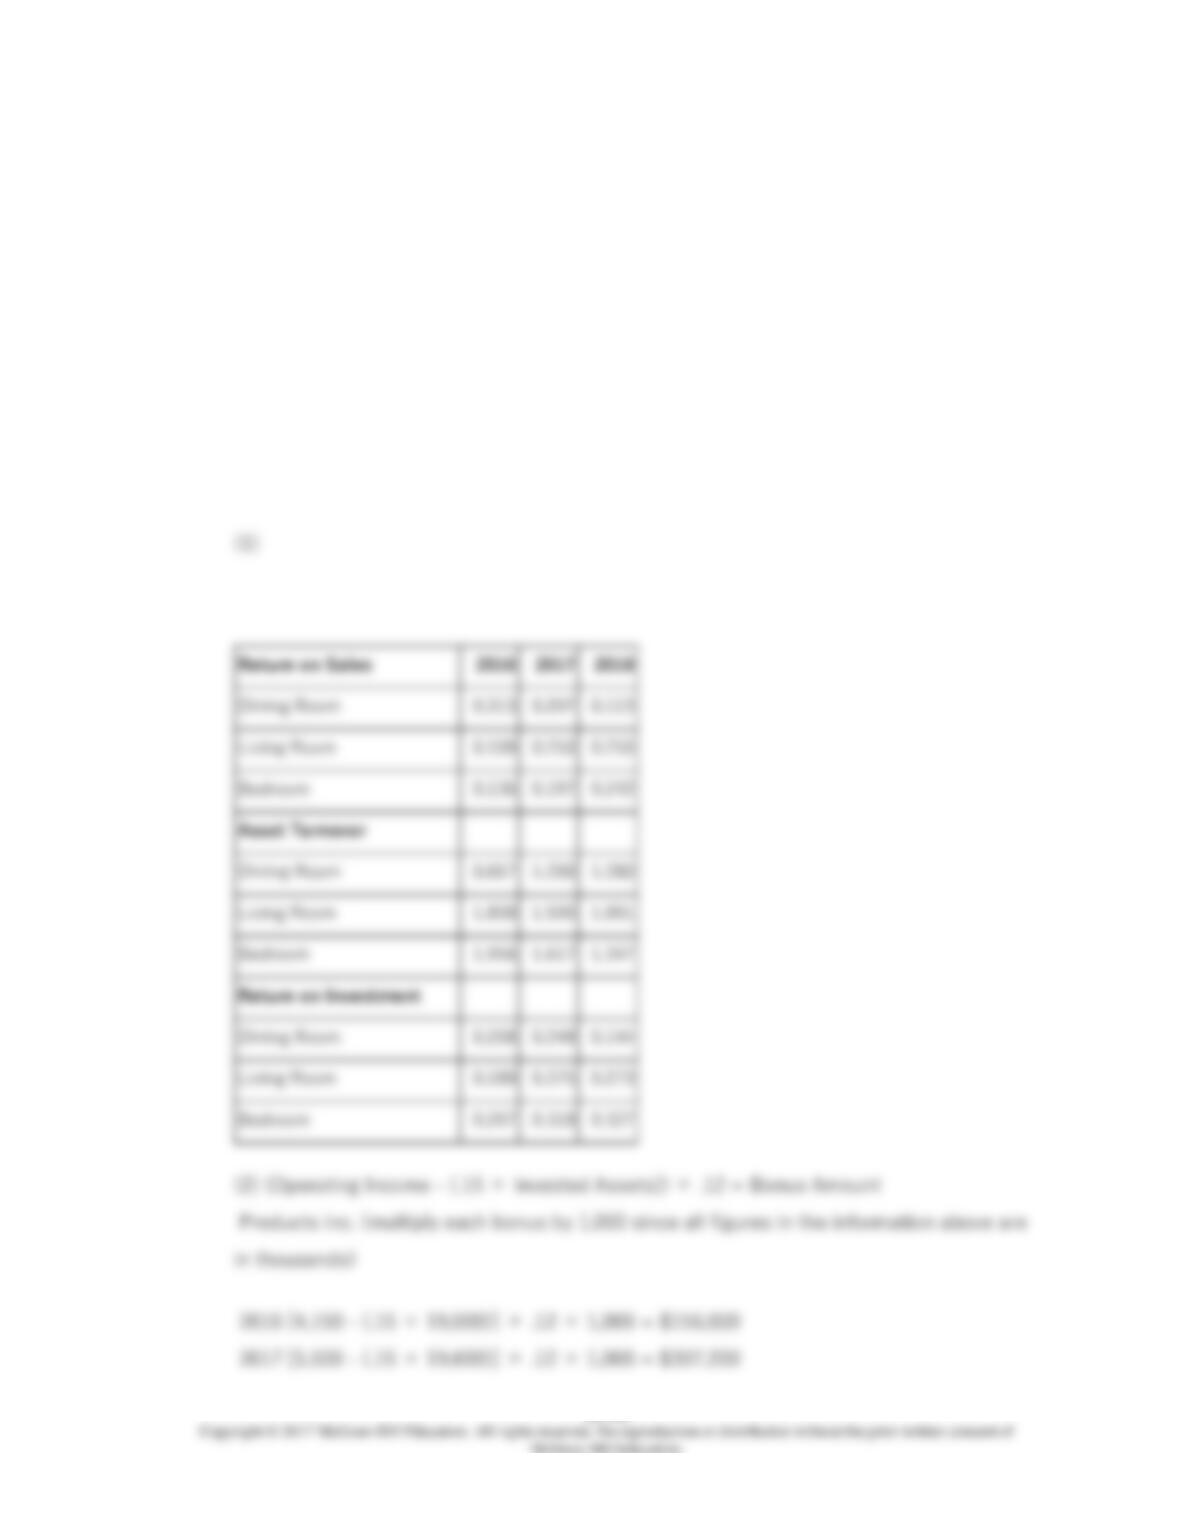
The current compensation package is an annual bonus award. The managers share in the
bonus pool. The pool is calculated as 12% of the annual residual income of the company.
The residual income is defined as operating income minus an interest charge of 15% of
invested assets.
Required:
14-146
14-147
151.
The High Seas, Inc. manufactures water vessels and is organized into three large divisions:
jet skis, fishing boats, and yachts. The following information presents operating revenues,
operating incomes, and invested assets of the company over the last three years:
14-148
Operating Revenues
(all figures in $000s)
2016
2017
2018
Jet Skis
$2,000
$3,000
$4,000
Fishing Boats
5,000
5,000
4,000
Yachts
8,000
7,000
8,000
Operating Income
Jet Skis
$500
$700
$1,000
Fishing Boats
3,000
2,500
2,000
Yachts
4,000
3,000
3,500
Invested Assets
Jet Skis
$1,200
$1,500
$2,000
Fishing Boats
$2,000
$1,500
$1,500
Yachts
3,000
2,500
3,000
The following table shows the number of managers covered by the current compensation
package of The High Seas, Inc.:
Number of Managers
2016
2017
2018
Jet Skis
50
60
70
Fishing Boats
200
180
160
Yachts
250
200
250
The current compensation package is an annual bonus award. The managers share in the
bonus pool. The pool is calculated as 10% of the annual residual income of the company.
The residual income is defined as operating income minus an interest charge of 14% of
invested assets.
Required:
(1) Compute the bonus amount to be paid during each year. Also, compute the (average)
individual executive bonus amounts.
(2) If the bonus was calculated by divisional residual income, what would be the bonus
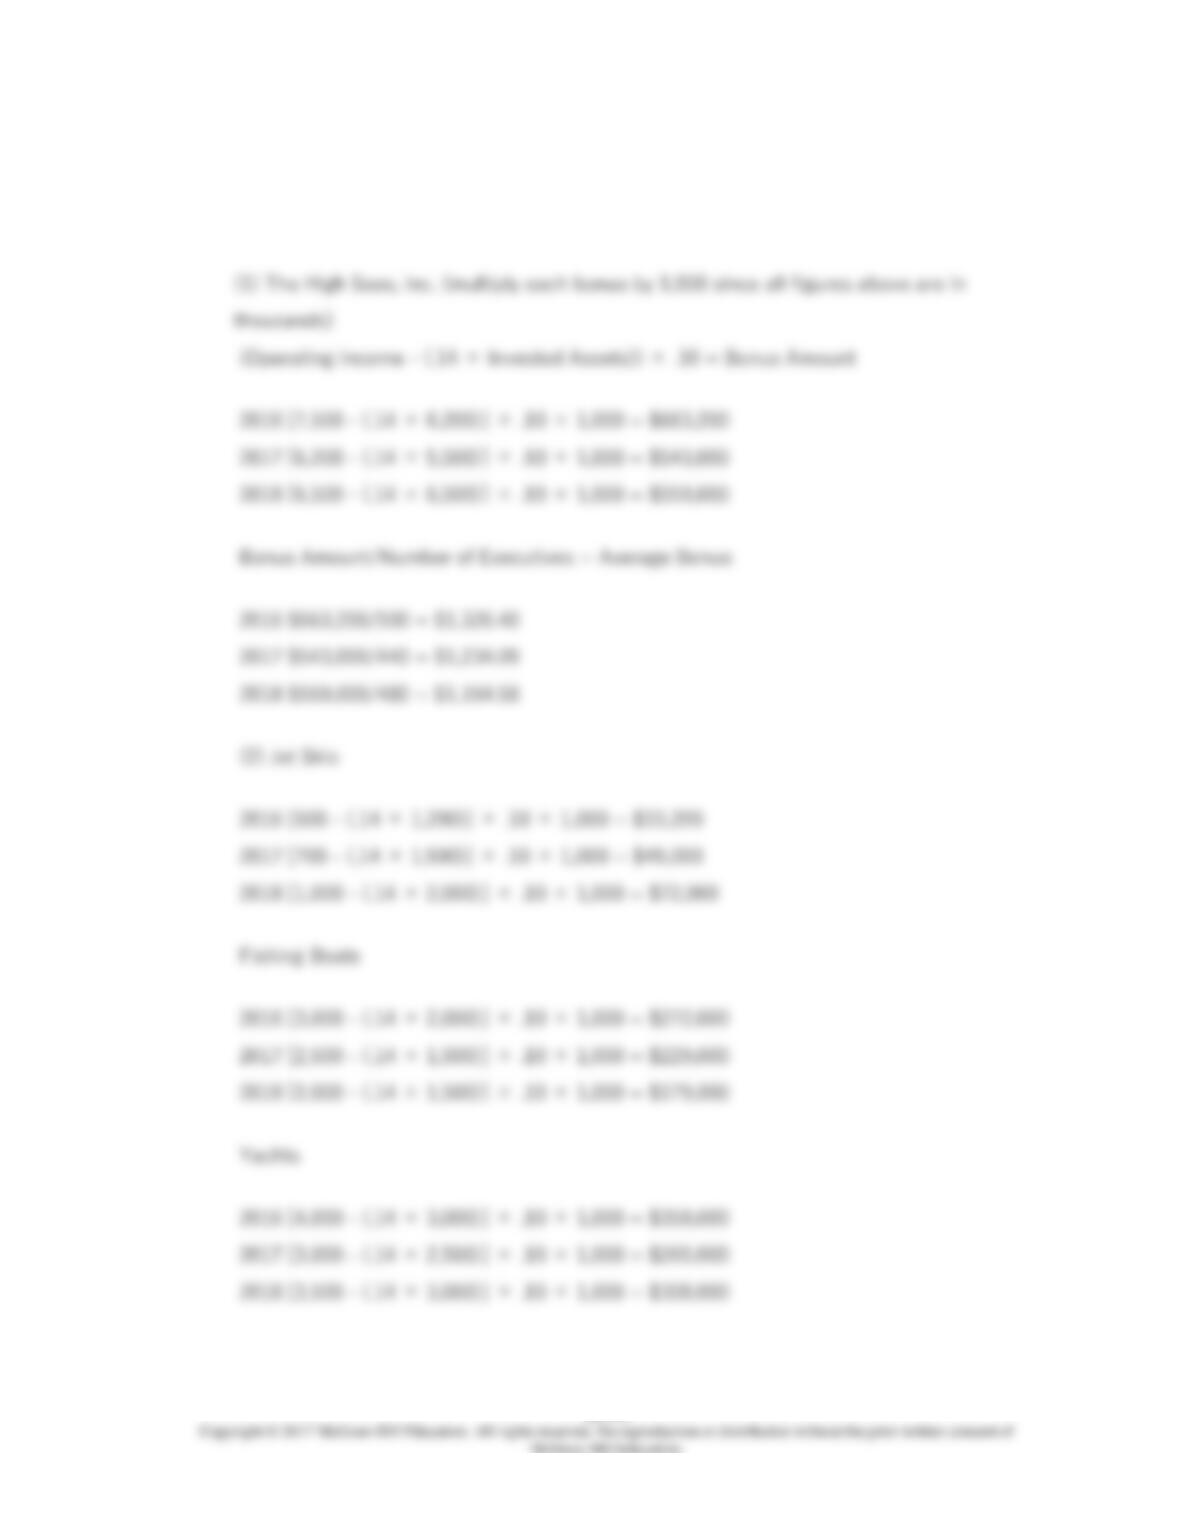
14-149