147.
Refer to the following selected financial information from Dodge Company. Compute the
company’s acid-test ratio.
Cash
$42,250
Short-term investments
60,000
Accounts receivable, net
79,500
Merchandise inventory
115,000
Prepaid expenses
9,700
Accounts payable
111,400
148.
Refer to the following selected financial information from Marston Company. Compute the
company’s accounts receivable turnover for Year 2.
Year 2
Year 1
Accounts receivable, net
86,500
82,750
Net sales
723,000
693,000
149.
Refer to the following selected financial information from Marston Company. Compute the
company’s days’ sales uncollected for Year 2.
Year 2
Year 1
Accounts receivable, net
86,500
82,750
Net sales
723,000
693,000
150.
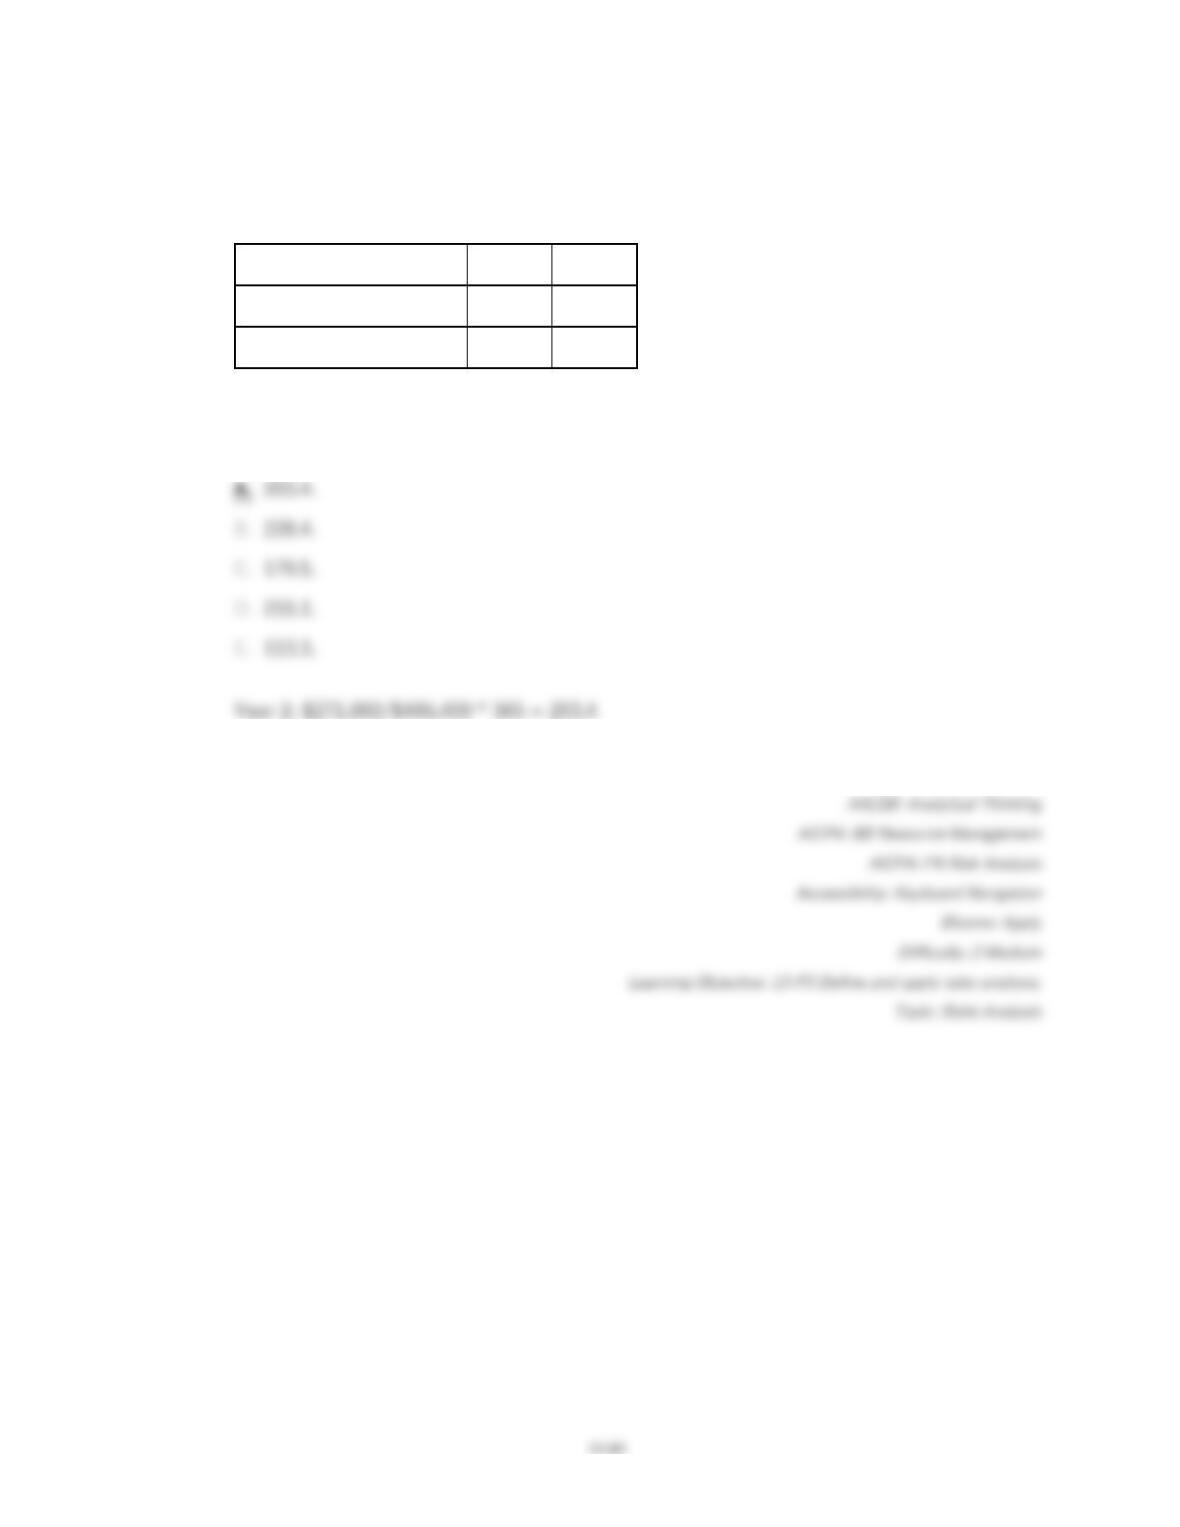
Refer to the following selected financial information from Graceworks Corp. Compute the
company’s inventory turnover for Year 2.
Year 2
Year 1
Merchandise inventory
271,000
253,500
Cost of goods sold
486,400
433,100
151.
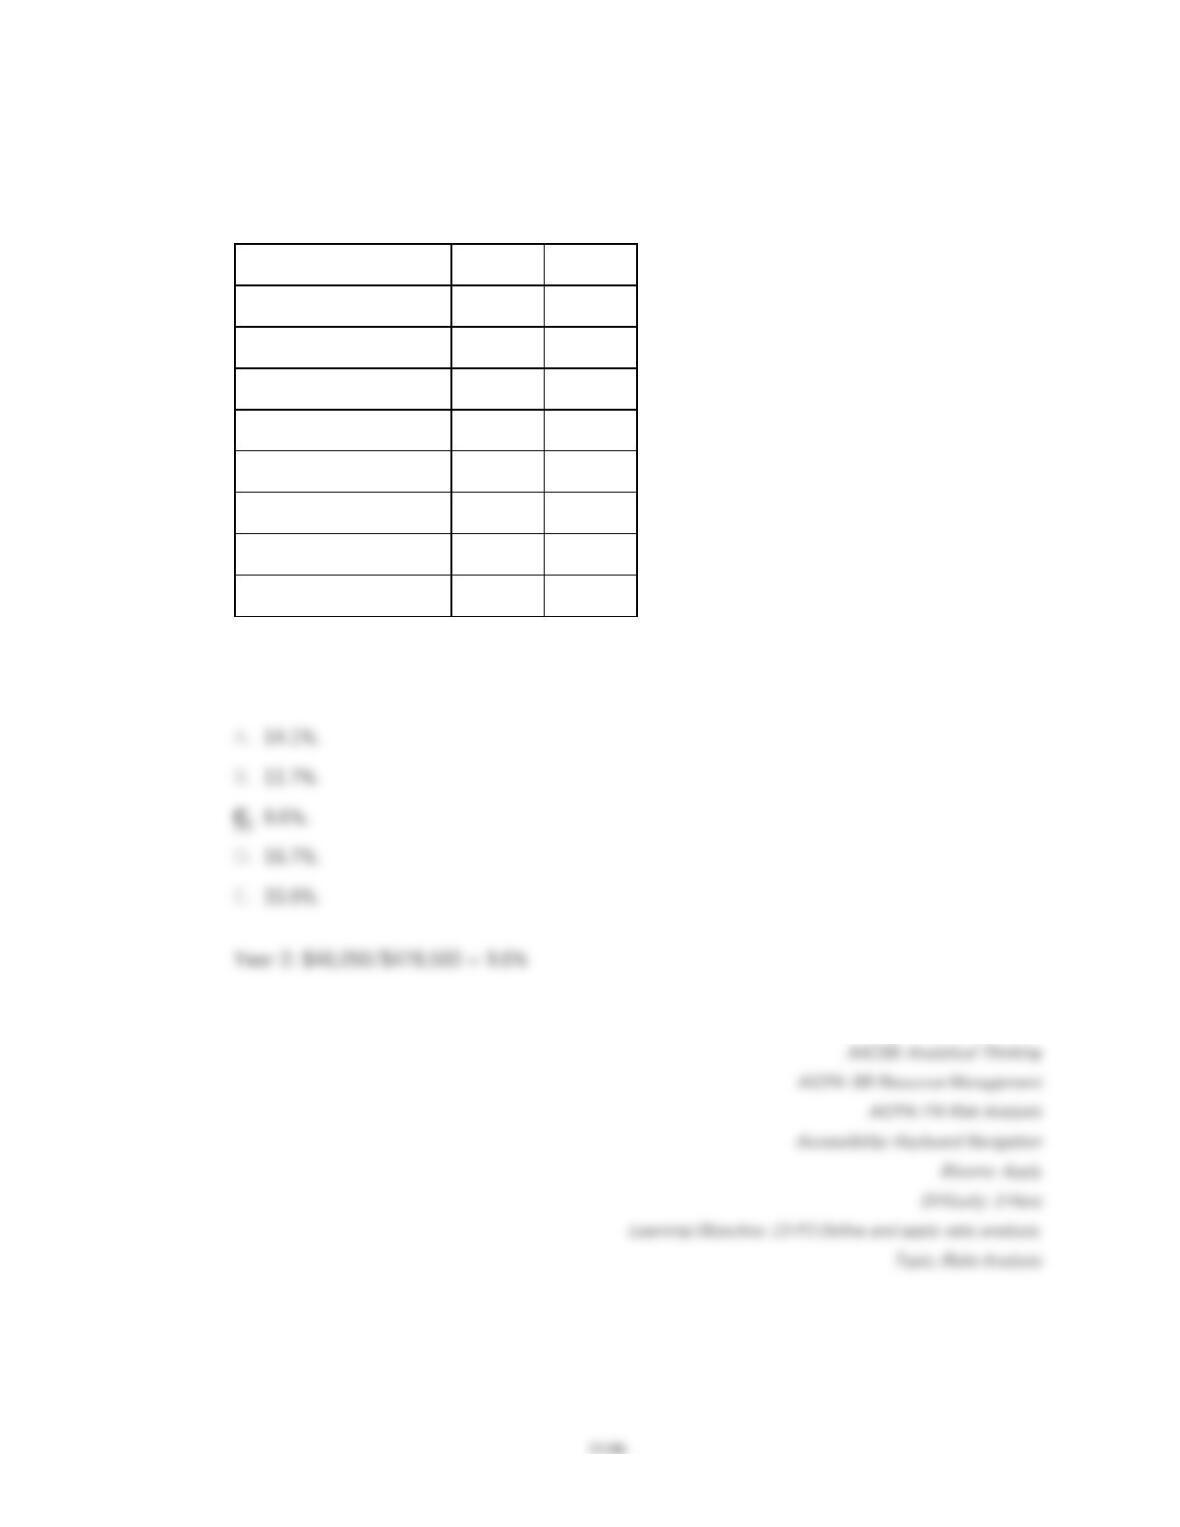
Refer to the following selected financial information from Graceworks, Corp. Compute the
company’s days’ sales in inventory for Year 2.
Year 2
Year 1
Merchandise inventory
271,000
253,500
Cost of goods sold
486,400
433,100
152.
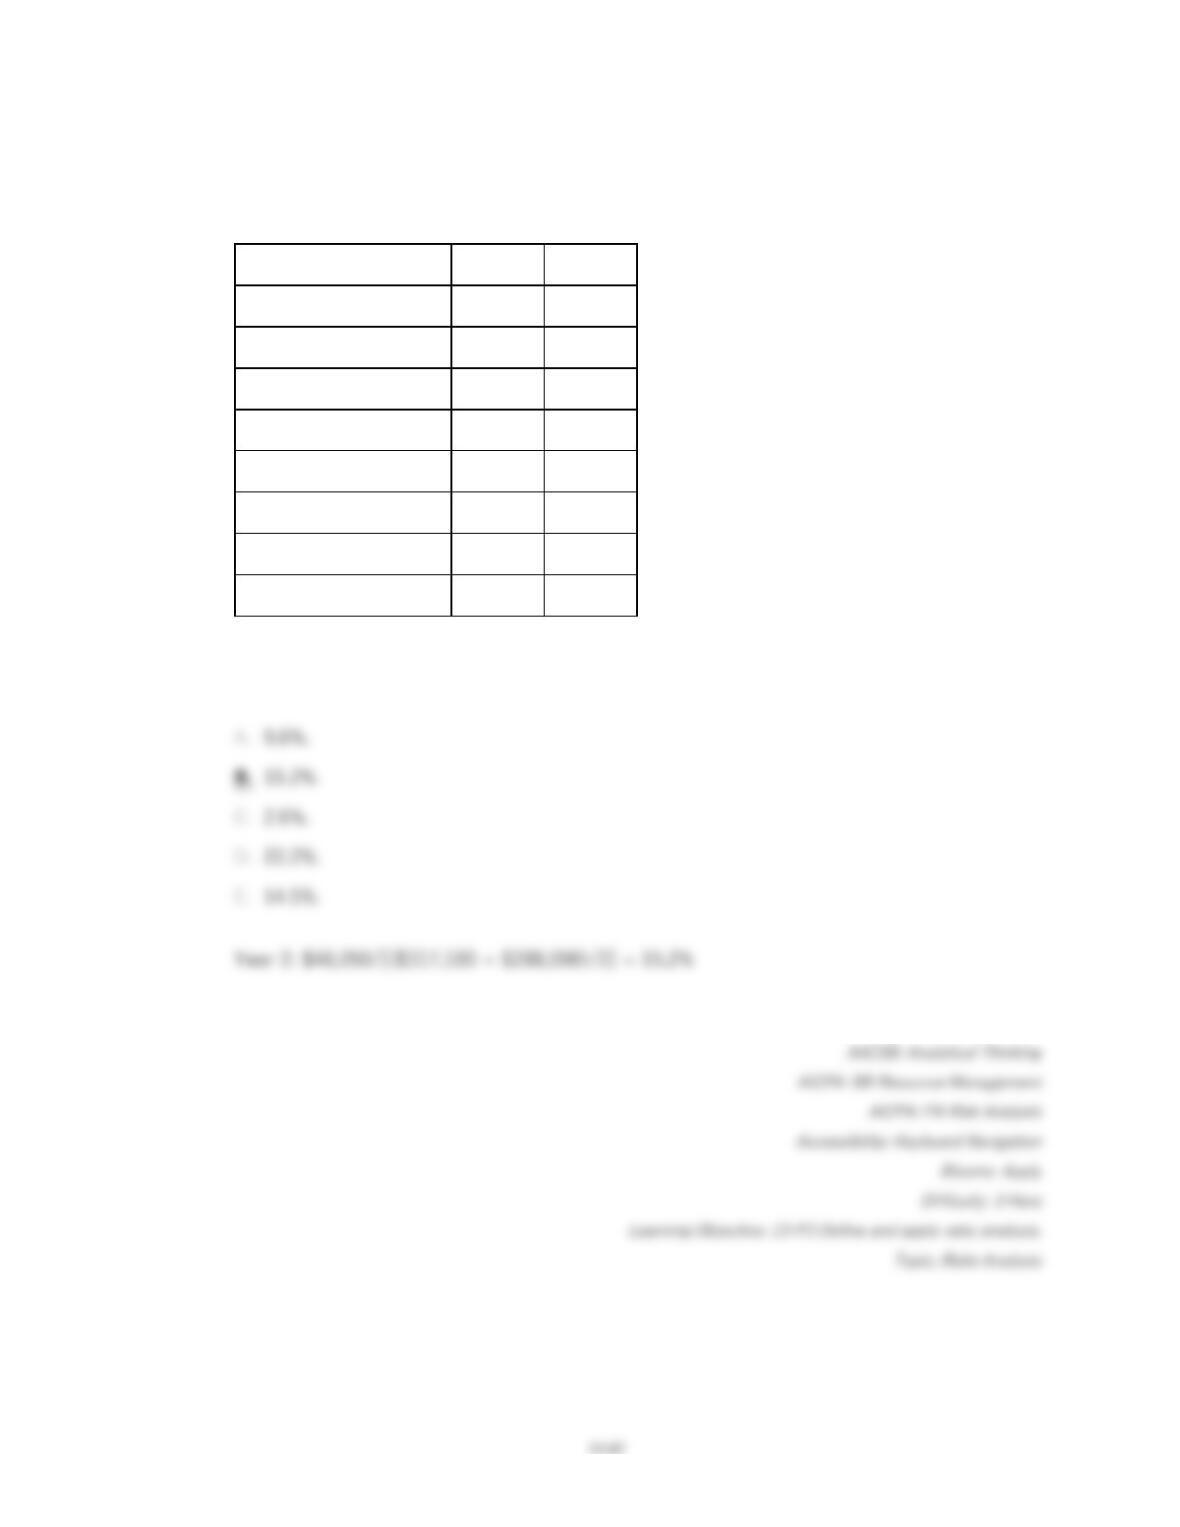
Refer to the following selected financial information from Shakley’s Incorporated. Compute
the company’s profit margin for Year 2.
Year 2
Year 1
Net sales
$478,500
$426,250
Cost of goods sold
276,300
250,120
Interest expense
9,700
10,700
Net income before tax
67,250
52,680
Net income after tax
46,050
39,900
Total assets
317,100
288,000
Total liabilities
181,400
167,300
Total equity
135,700
120,700
153.
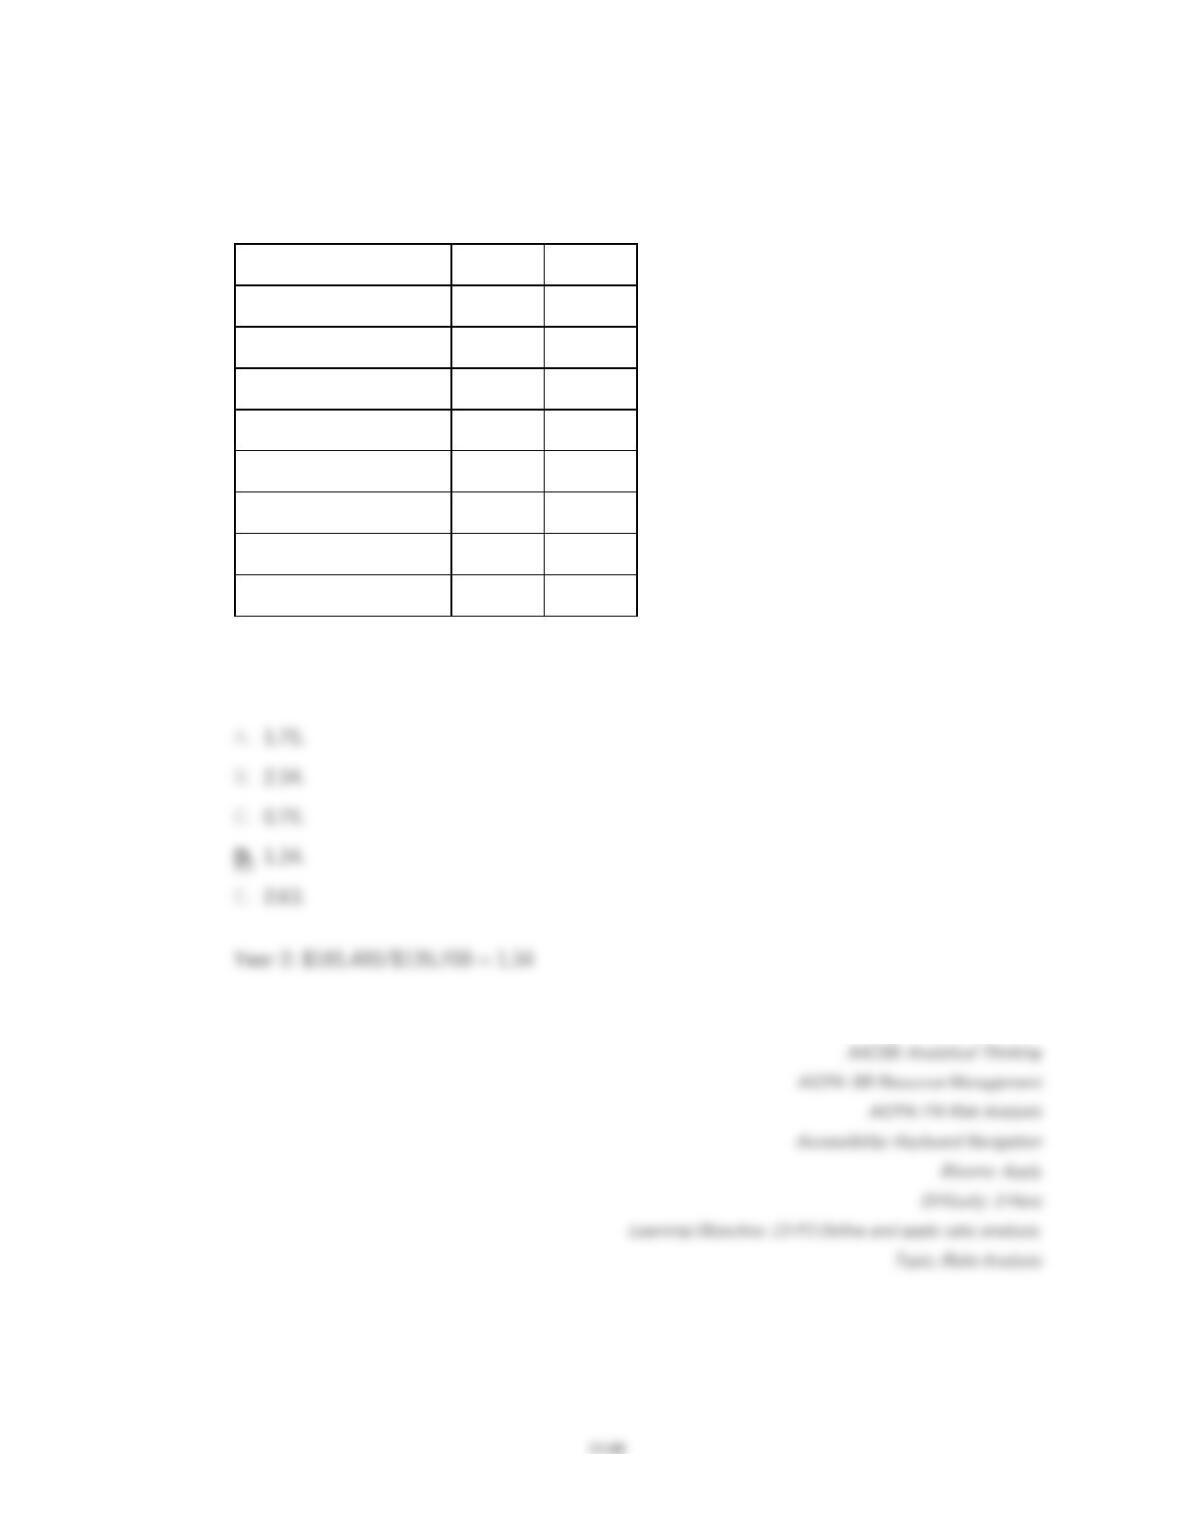
Refer to the following selected financial information from Shakley’s Incorporated. Compute
the company’s return on total assets for Year 2.
Year 2
Year 1
Net sales
$478,500
$426,250
Cost of goods sold
276,300
250,120
Interest expense
9,700
10,700
Net income before tax
67,250
52,680
Net income after tax
46,050
39,900
Total assets
317,100
288,000
Total liabilities
181,400
167,300
Total equity
135,700
120,700
154.
Refer to the following selected financial information from Shakley’s Incorporated. Compute
the company’s debt–to-equity ratio for Year 2.
Year 2
Year 1
Net sales
$478,500
$426,250
Cost of goods sold
276,300
250,120
Interest expense
9,700
10,700
Net income before tax
67,250
52,680
Net income after tax
46,050
39,900
Total assets
317,100
288,000
Total liabilities
181,400
167,300
Total equity
135,700
120,700
155.
Refer to the following selected financial information from Shakley’s Incorporated. Compute
the company’s times interest earned for Year 2.
Year 2
Year 1
Net sales
$478,500
$426,250
Cost of goods sold
276,300
250,120
Interest expense
9,700
10,700
Net income before tax
67,250
52,680
Net income after tax
46,050
39,900
Total assets
317,100
288,000
Total liabilities
181,400
167,300
Total equity
135,700
120,700
156.
Refer to the following selected financial information from Graphics, Inc. Compute the
company’s times interest earned.
Interest expense
9,100
Income tax expense
22,700
Net income after tax
56,500
157.
Refer to the following selected financial information from Keller Company. Compute the
company’s debt to equity for Year 2.
Year 2
Year 1
Total assets
327,800
301,000
Total liabilities
171,400
169,300
Total equity
156,400
131,700
158.
Washburn Company reported sales of $1,722,000 for Year 1 and $1,831,000 for Year 2.
Using Year 1 as the base year, what was the percentage change for sales from Year 1 to
Year 2?
159.
Washburn Company reported cost of goods sold of $977,000 for Year 1 and $953,000 for
Year 2. Using Year 1 as the base year, what was the percentage change for cost of goods
sold from Year 1 to Year 2?
160.
Flaherty Corporation used data for 3 years to perform a trend analysis of its operating
expenses, which were $54,305 in Year 1; $63,421 in Year 2 and $70,340 in Year 3. Using
Year 1 as the base year, the operating expense trend percent (rounded to the nearest
whole percent) for Year 2 is:
13–95
161.
Flaherty Corporation used data for 3 years to perform a trend analysis of its operating
expenses, which were $54,305 in Year 1; $63,421 in Year 2 and $70,340 in Year 3. Using
Year 1 as the base year, the operating expense trend percent (rounded to the nearest
whole percent) for Year 3 is:
Matching Questions
162.
Match each of the following terms with the appropriate definitions.
1. Market
A statement with data for two or more
successive accounting periods placed in
side-by-side columns, often with changes
2. Comparative
financial
Examination of financial data across
3. Horizontal
The availability of resources to meet
short-term obligations and to efficiently
4. Financial
statement
The comparison of a company’s financial
condition and performance to a base
5. Vertical
The application of analytical tools to
general-purpose financial statements and
A company’s ability to generate positive
7. Debt to equity
A company’s ability to generate future
8. Common-size
financial
A measure of solvency presented as the
A company’s ability to provide financial
rewards sufficient to attract and retain
10. Liquidity and
A statement where each amount is
expressed as a percent of a base amount to
reveal the relative importance of each
163.
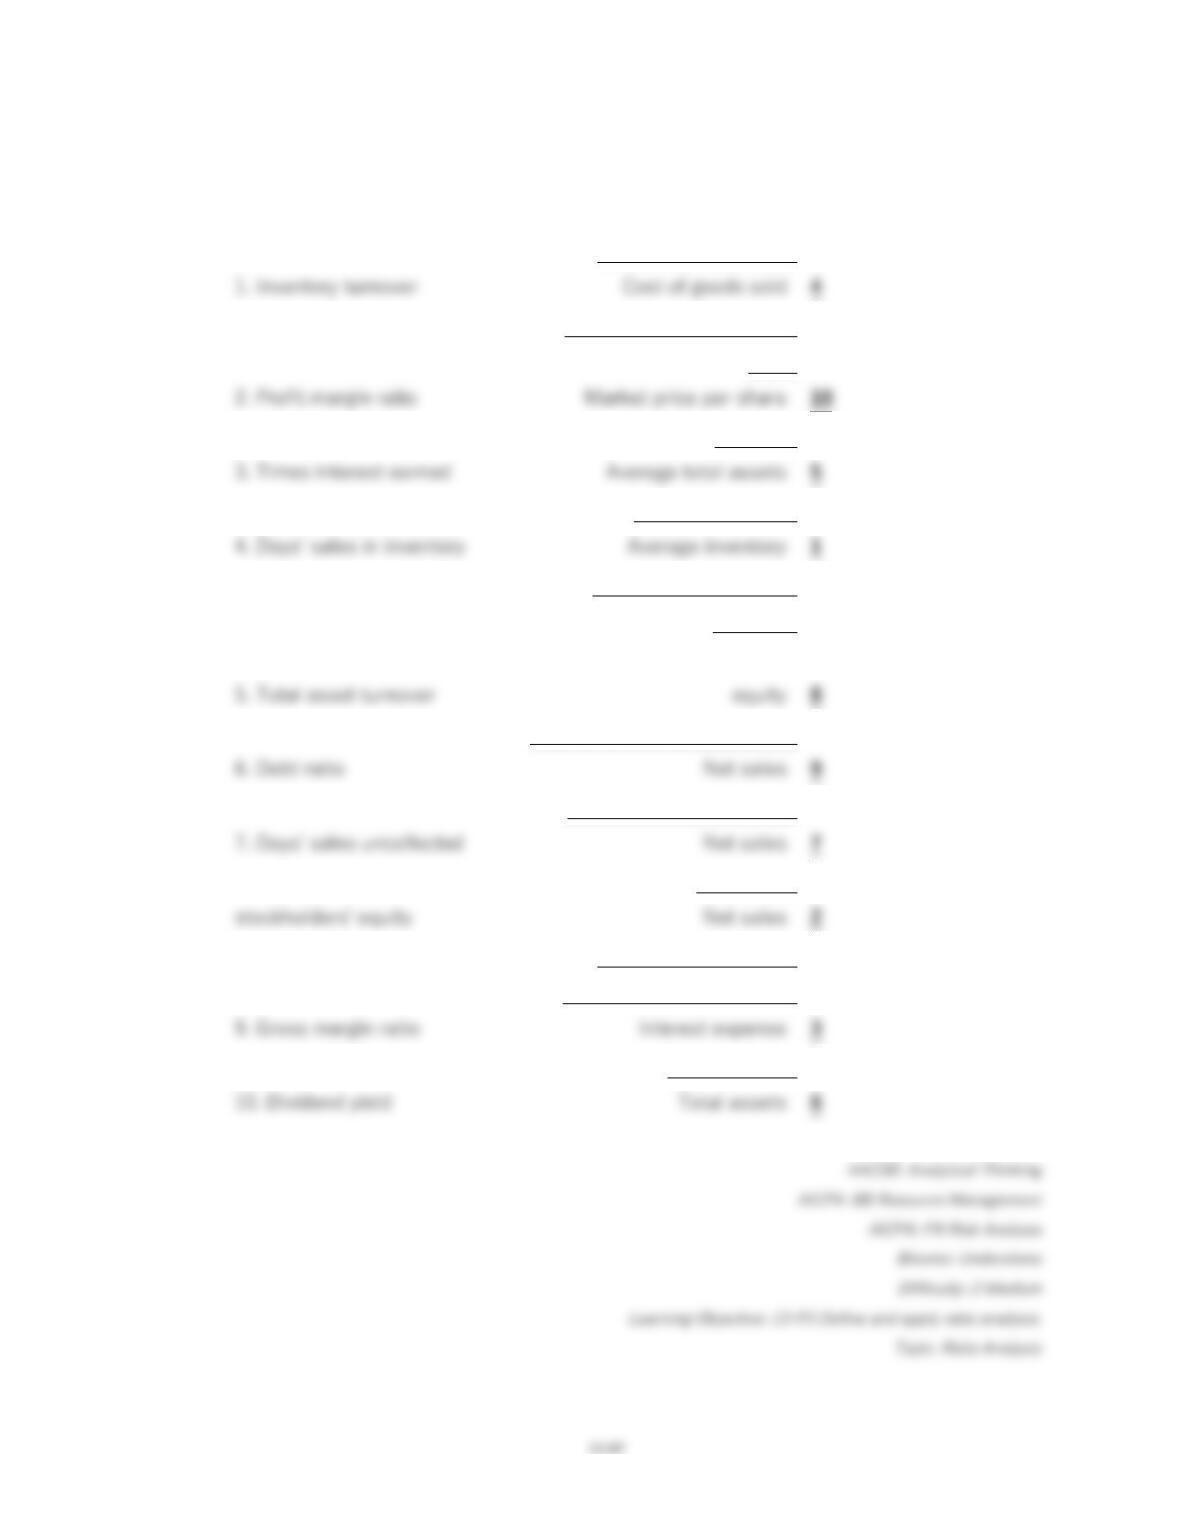
Match each of the following terms with the appropriate formulas.
Ending inventory * 365
Annual cash dividends per
share
Net sales
Cost of goods sold
Net income – Preferred
dividends
Average common stockholders’
Net sales – Cost of goods sold
Accounts receivable * 365
8. Return on common
Net income
Income before interest
expense and income taxes
Total liabilities

Short Answer Questions
164.
Identify the financial analysis building block most appropriately associated with each ratio
listed below by placing the letter of the building block a through d beside each ratio 1
through 10. Each building block may be used more than once.
A. Liquidity and Efficiency
B. Solvency
C. Profitability
D. Market Prospects
__________ (1) Price Earnings Ratio
__________ (2) Dividend Yield
__________ (3) Accounts Receivable Turnover
__________ (4) Days’ Sales in Inventory
__________ (5) Return on Total Assets
__________ (6) Equity Ratio
__________ (7) Debt Ratio
__________ (8) Inventory Turnover
__________ (9) Basic Earnings per Share
__________ (10) Times Interest Earned
165.
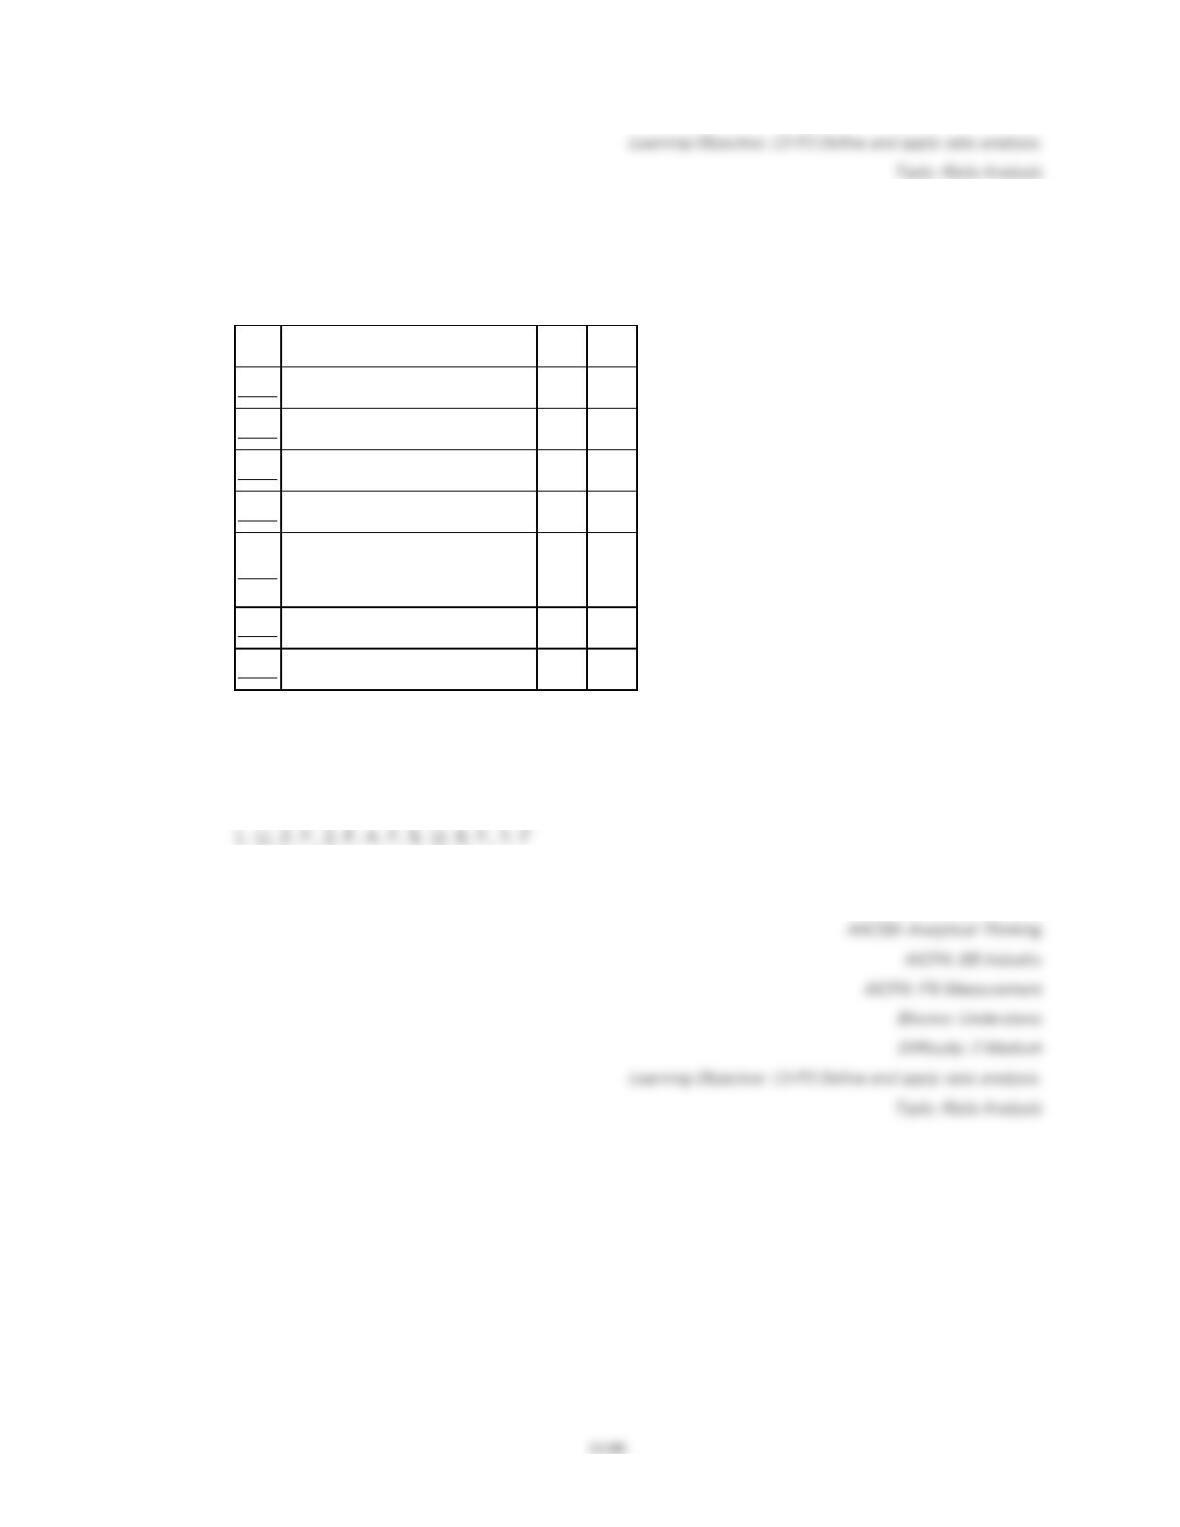
For each ratio listed, identify whether the change in ratio value from 2016 to 2017 is
usually regards as favorable (F) or unfavorable (U).
Ratio
2017
2016
1. Profit margin
9%
10%
2. Debt ratio
41%
43%
3. Gross margin
39%
35%
4. Acid-test ratio
1.10
1.05
5. Accounts receivable
turnover
5.7
6.2
6. Basic earnings per share
$0.98
$0.73
7. Days’ sales in inventory
83
96
166.
Explain the purpose of financial statement analysis for both external and internal users.
167.
Identify and explain the four building blocks of financial statement analysis.