177) Match each of the following terms with the appropriate definitions.
A. Comparative financial statement
B. Horizontal analysis
C. Liquidity and efficiency
D. Vertical analysis
E. Financial statement analysis
F. Market prospects
G. Solvency
H. Debt to equity ratio
I. Profitability
J. Common-size financial statement
______ (1) A company’s ability to generate positive market expectations.
______ (2) The application of analytical tools to general-purpose financial statements and related
data for making business decisions.
______ (3) A measure of solvency presented as the ratio of total liabilities to total equity.
______ (4) A statement with amounts for two or more successive accounting periods placed in
side-by-side columns, often with changes shown in dollar amounts and percentages.
______ (5) A company’s ability to provide financial rewards sufficient to attract and retain
capital.
______ (6)A statement where each amount is expressed as a percent of a base amount to reveal
the relative importance of each financial statement item.
______ (7) The comparison of a company’s financial condition and performance to a base
amount.
______ (8) Examination of financial data across time.
______ (9) A company’s ability to generate future revenues and meet long-term obligations.
______ (10) The availability of resources to meet short-term obligations and to efficiently
generate revenues.
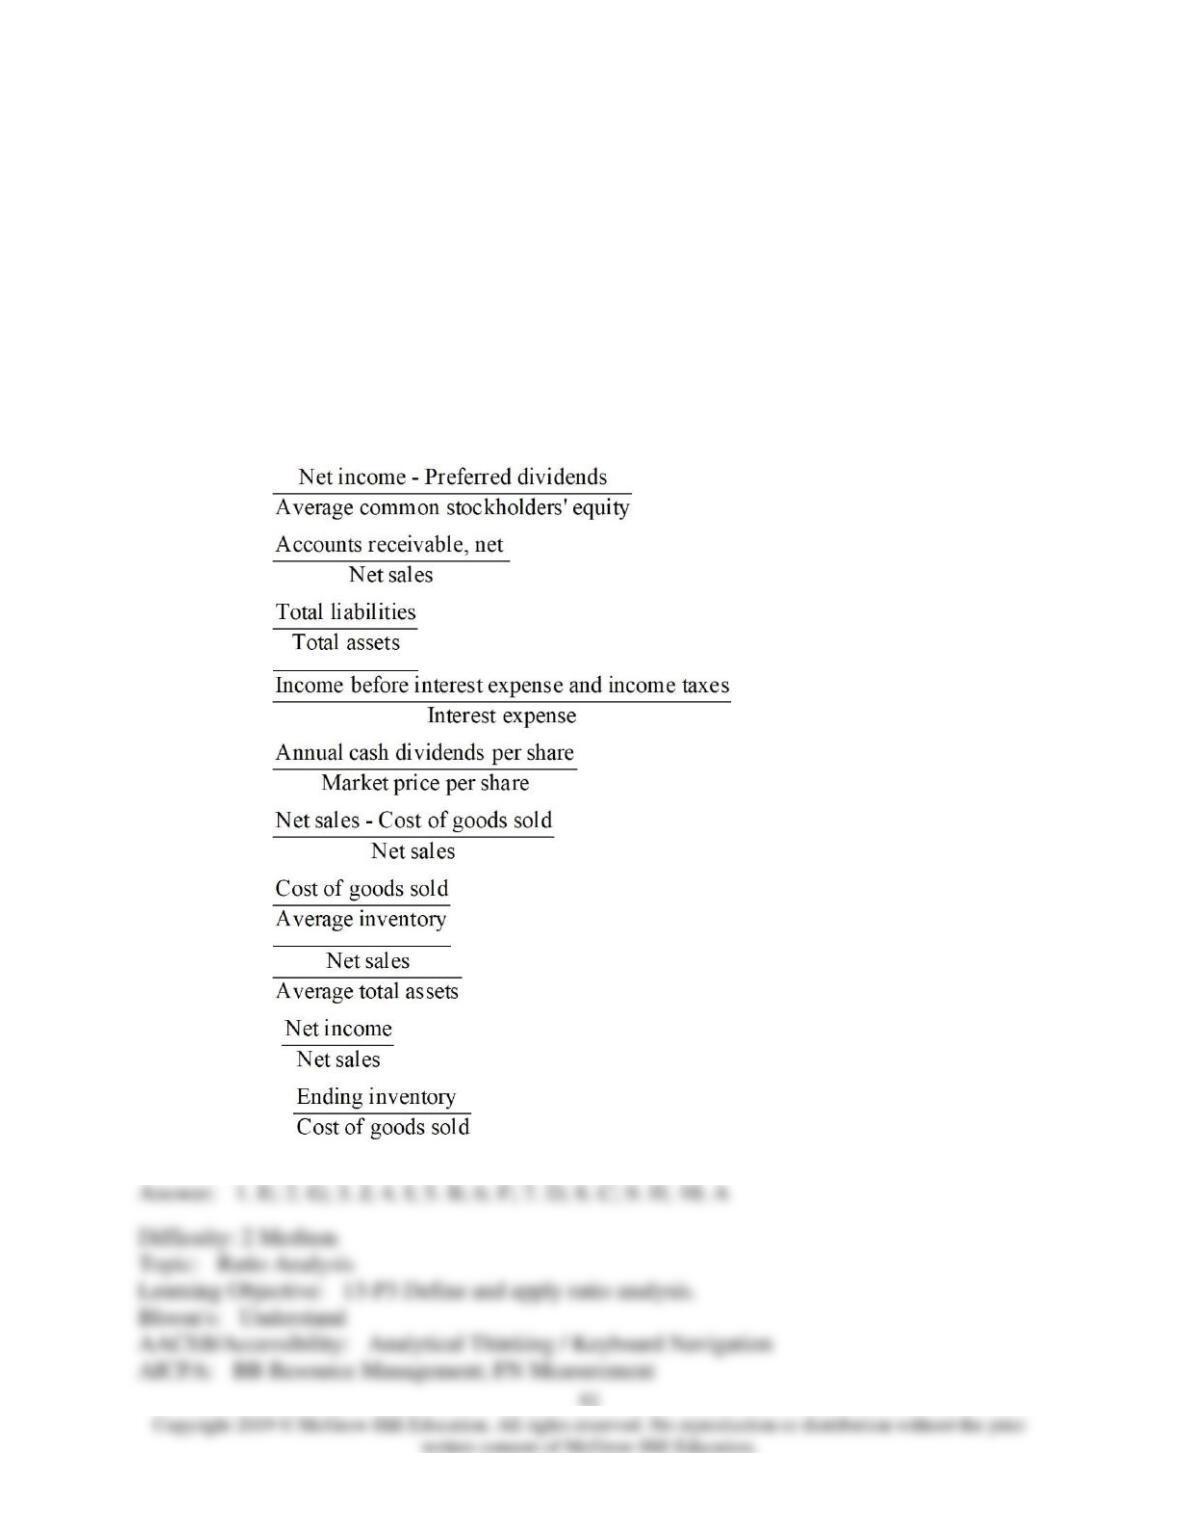
178) Match each of the following terms with the appropriate formulas.
A. Days’ sales in inventory
B. Dividend yield
C. Total asset turnover
D. Inventory turnover
E. Return on common stockholders’ equity
F. Gross margin ratio
G. Days’ sales uncollected
H. Profit margin ratio
I. Times interest earned
J. Debt ratio
________ (1)
________ (2) * 365
________ (3)
________ (4)
________ (5)
________ (6)
________ (7)
________ (8)
________ (9)
________ (10) * 365
179) Identify the financial analysis building block most appropriately associated with each ratio
listed below by placing the letter of the building block a through d beside each ratio 1 through
10. Each building block may be used more than once.
A. Liquidity and Efficiency
B. Solvency
C. Profitability
D. Market Prospects
________ (1) Price Earnings Ratio
________ (2) Dividend Yield
________ (3) Accounts Receivable Turnover
________ (4) Days’ Sales in Inventory
________ (5) Return on Total Assets
________ (6) Equity Ratio
________ (7) Debt Ratio
________ (8) Inventory Turnover
________ (9) Basic Earnings per Share
________ (10) Times Interest Earned
180) Explain the purpose of financial statement analysis for both external and internal users.
181) Identify and explain the four building blocks of financial statement analysis.
182) What are the four standards for comparisons in financial analysis? Give an example of each.
183) Identify and describe three common tools of financial statement analysis.
184) What is the purpose of a good financial statement analysis report? What are the key
components?
185) Describe the purpose of horizontal financial statement analysis and how it is applied.
186) Describe the purpose of vertical financial statement analysis and how it is applied.
187) Describe ratio analysis including its purpose, application, and interpretation.
188) A company’s sales in Year 1 were $280,000, and its sales in Year 2 were $341,600. Using
Year 1 as the base year, what is the sales trend percent for Year 2?
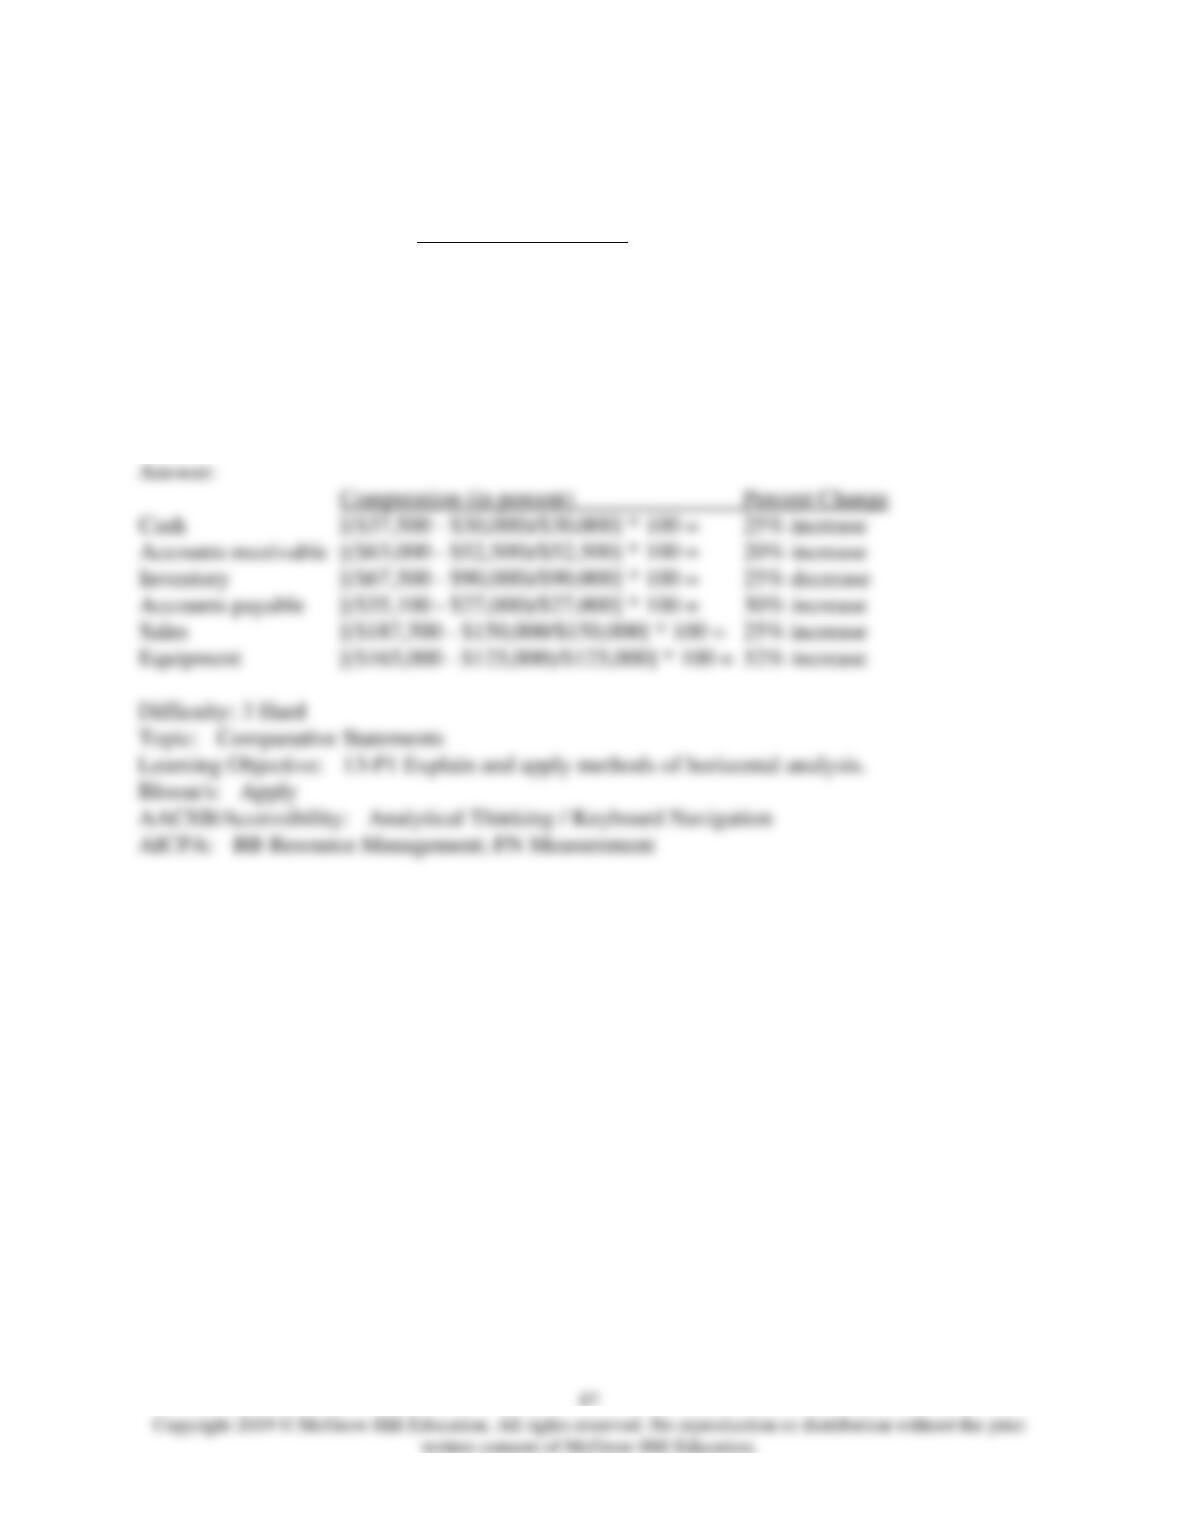
189) Calculate the percent increase or decrease for each of the following financial statement
items:
Year 2 Year 1
Cash $ 37,500 $ 30,000
Accounts receivable 63,000 52,500
Inventory 67,500 90,000
Accounts payable 35,100 27,000
Sales 187,500 150,000
Equipment 165,000 125,000
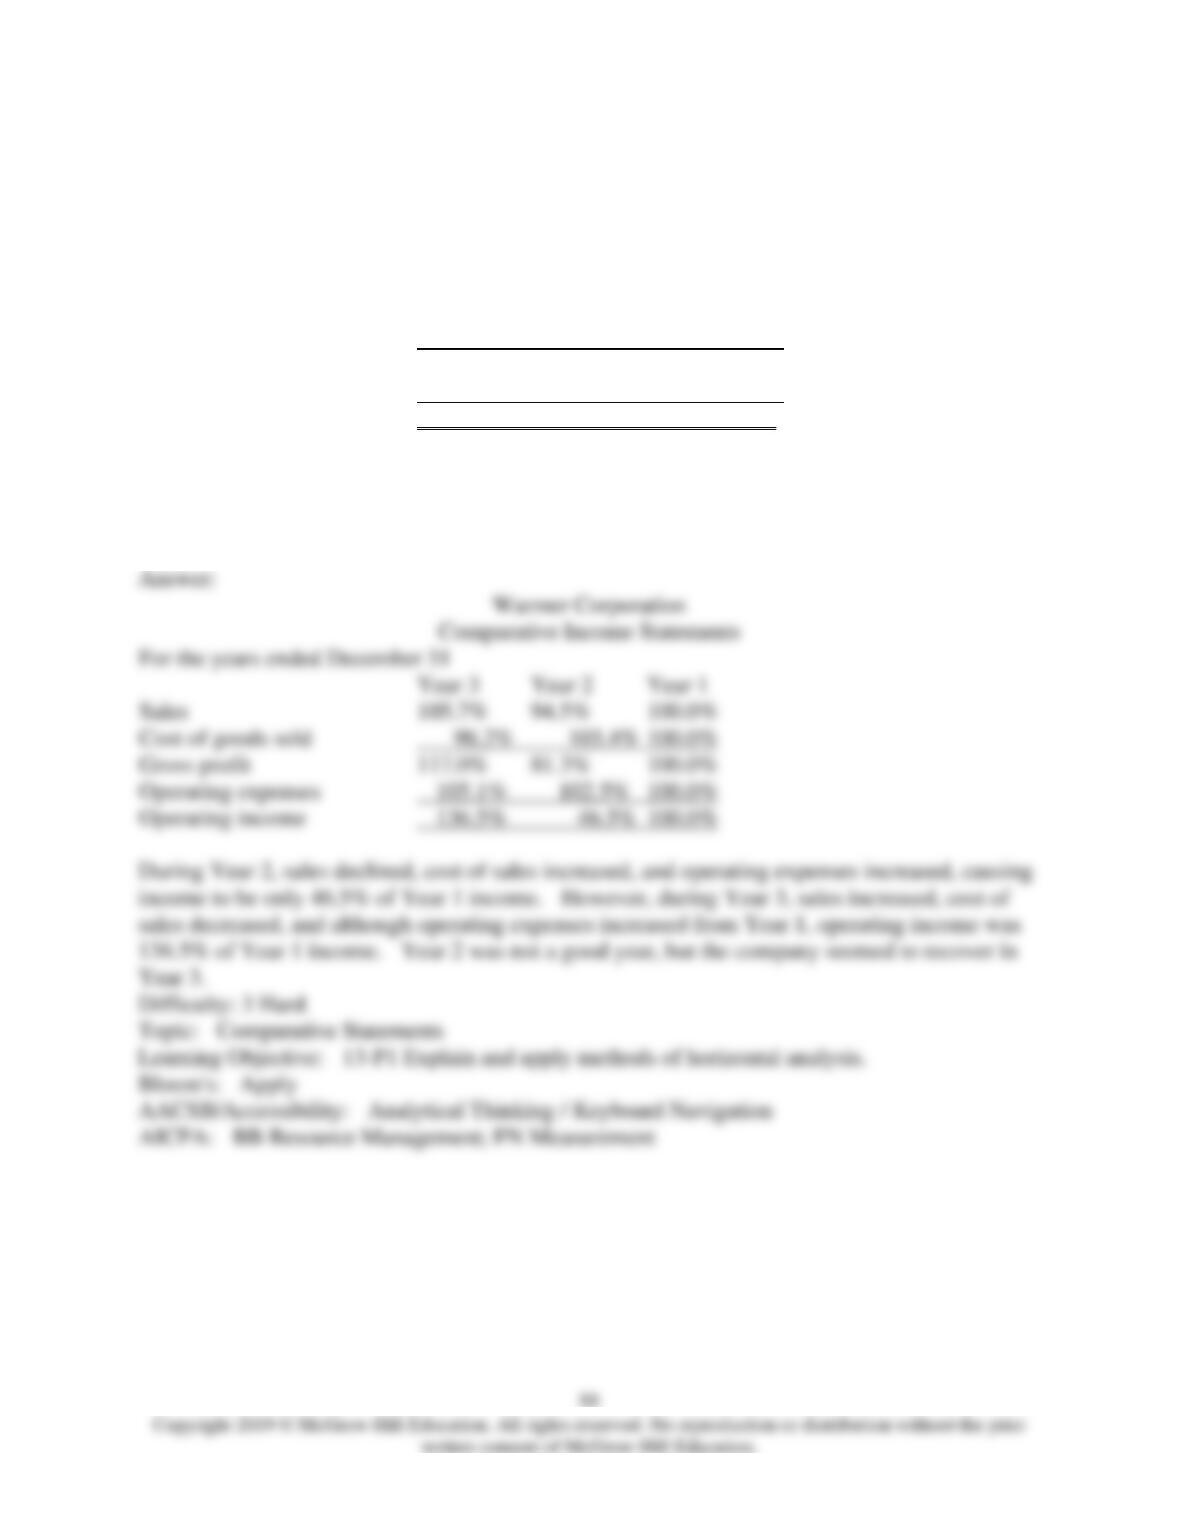
190) Comparative statements for Warmer Corporation are shown below:
Warmer Corporation
Comparative Income Statements
For the years ended December 31
Year 3 Year 2 Year 1
Sales $14,800 $13,229 $13,994
Cost of goods sold 8,225 8,661 8,375
Gross profit 6,575 4,568 5,619
Operating expenses 3,664 3,576 3,487
Operating income $ 2,911 $ 992 $ 2,132
Calculate trend percentages for all income statement amounts shown and comment on the results.
Use Year 1 as the base year.Comment on the results.
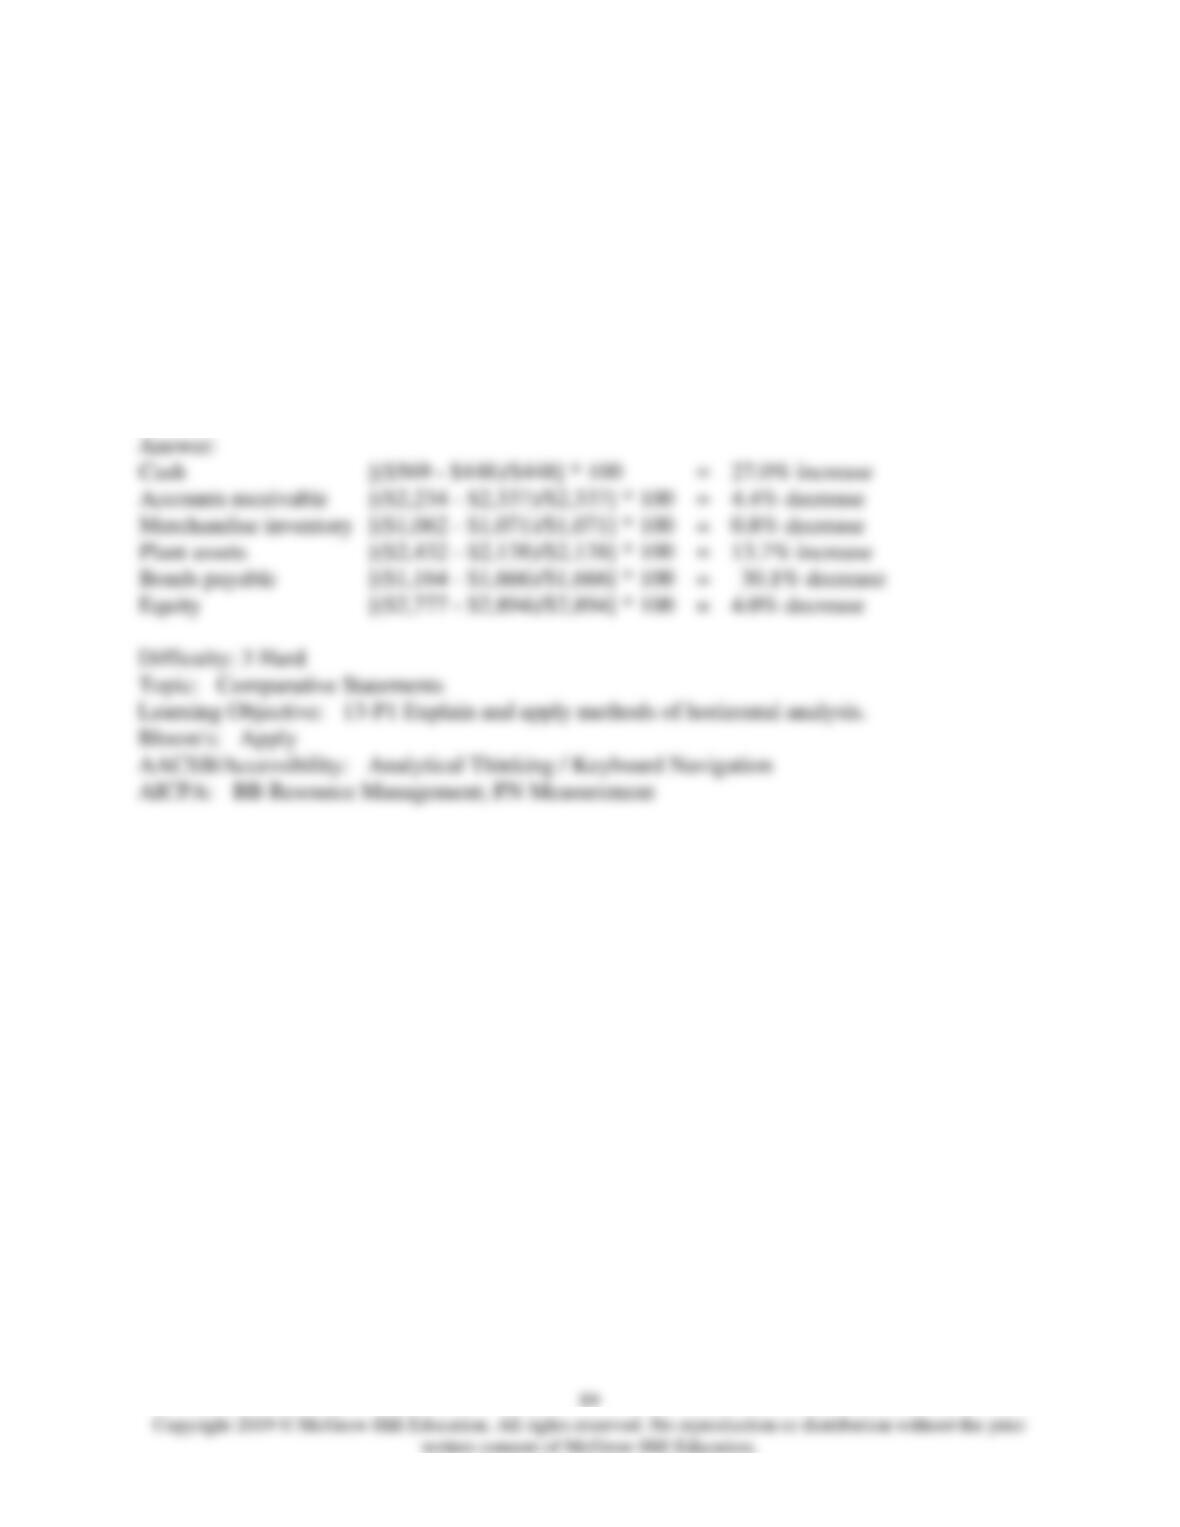
191) Calculate the percent increases for each of the following selected balance sheet items.
Year 2 Year 1
Cash $ 569 $ 448
Accounts receivable 2,234 2,337
Merchandise inventory 1,062 1,071
Plant assets 2,432 2,138
Bonds payable 1,164 1,666
Equity 2,777 2,894
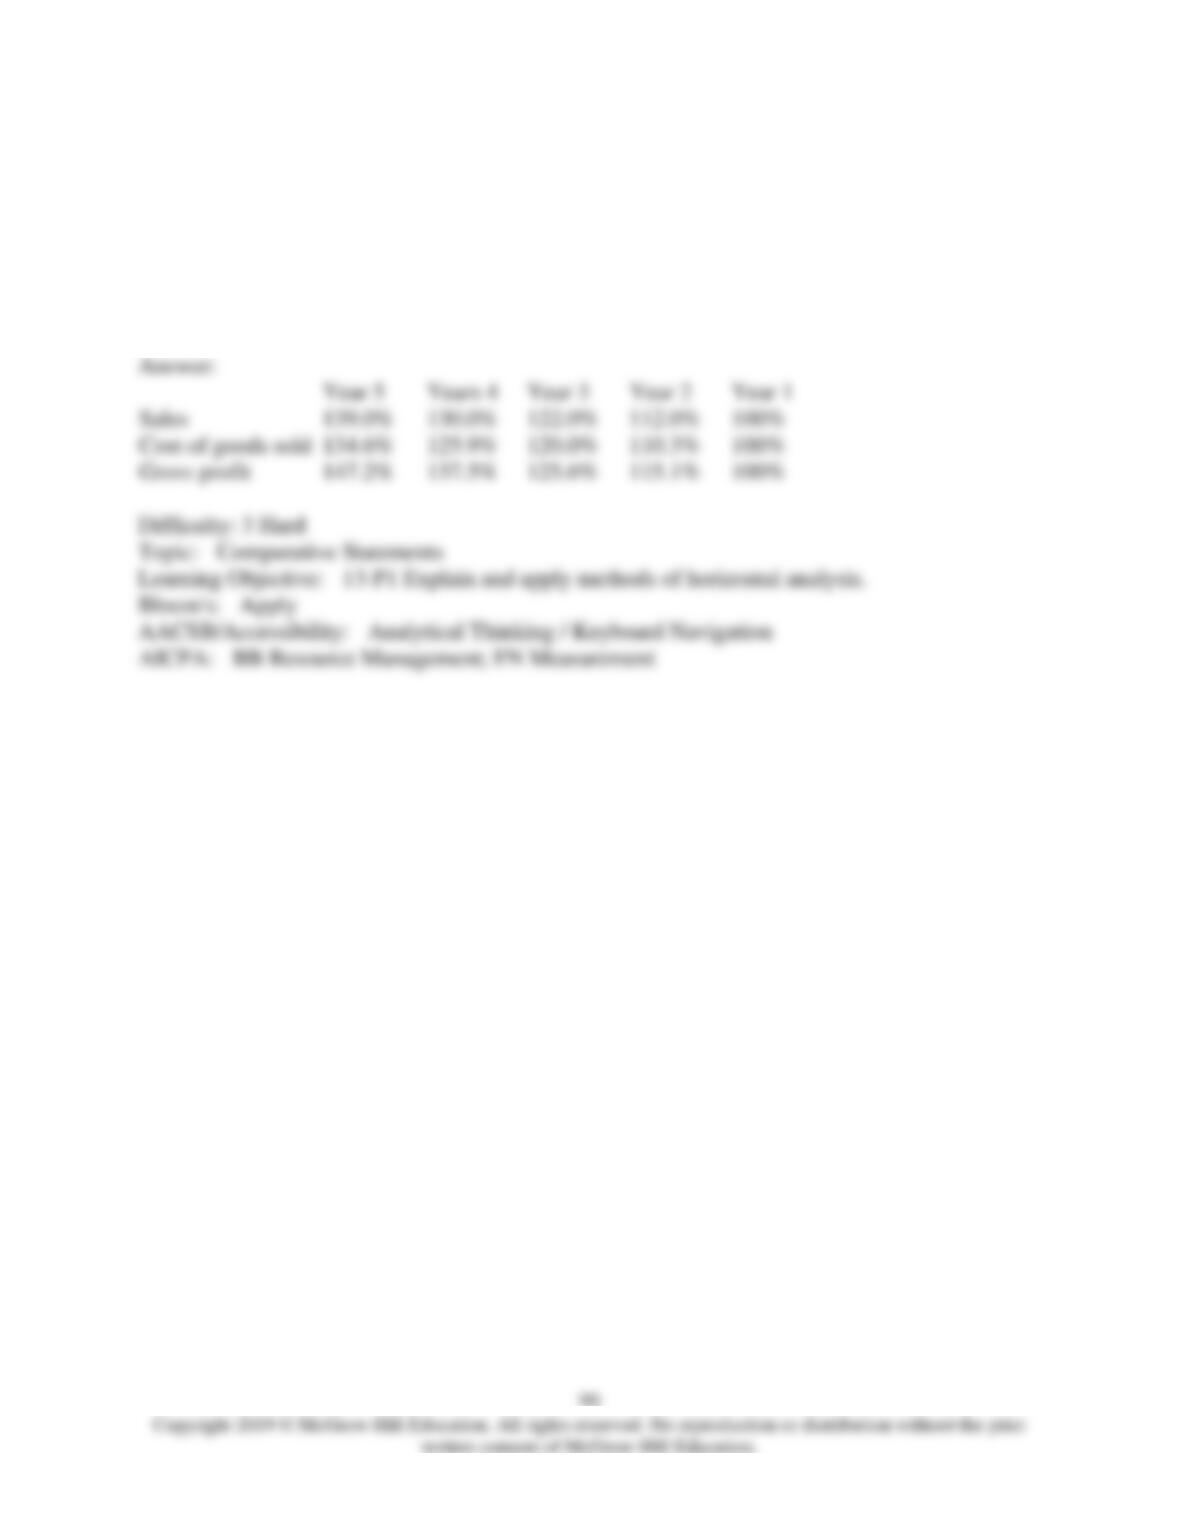
192) For the following financial statement items, calculate trend percentages using Year 1 as the
base year:
Year 5 Year 4 Year 3 Year 2 Year 1
Sales $1,195,400 $1,118,000 $1,049,000 $963,200 $860,000
Cost of sales 752,400 704,000 671,000 616,700 559,000
Gross profit $443,000 $414,000 $378,000 $346,500 $301,000
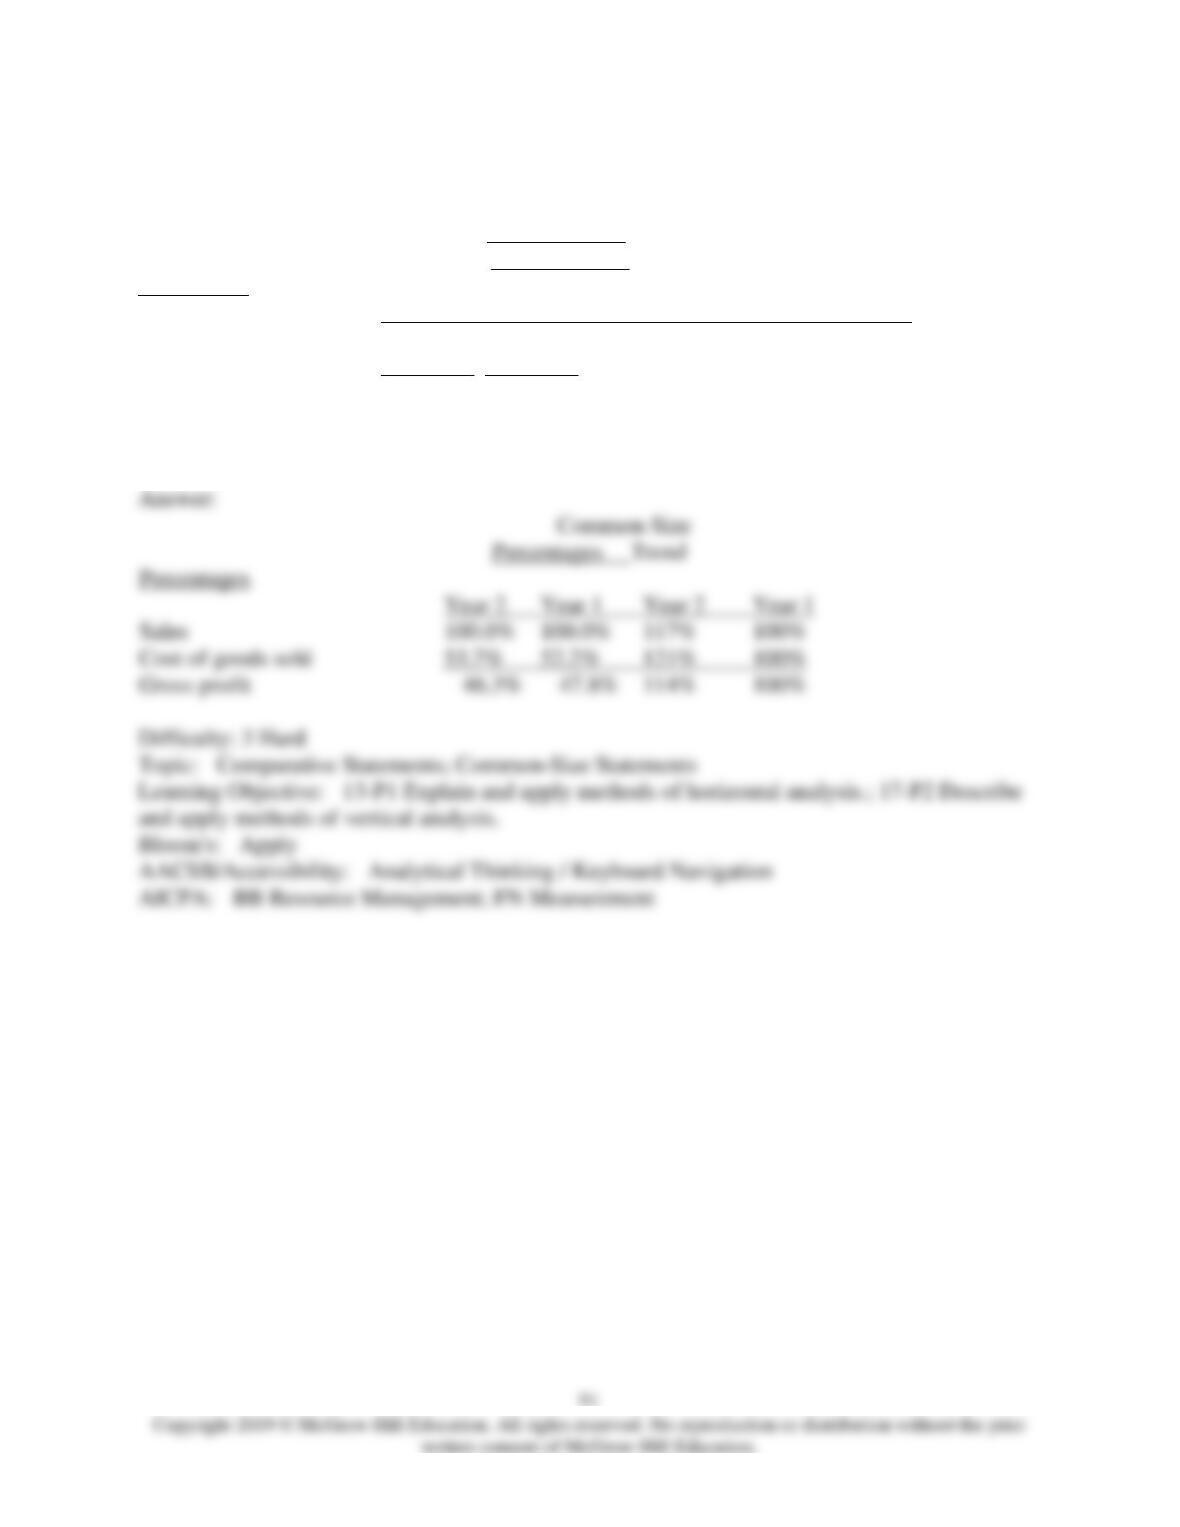
193) Express the following income statement information in common-size percentages and in
trend percentages using Year 1 as the base year.
Common-Size
Percentages Trend
Percentages
Year 2 Year 1 Year 2 Year 1 Year 2 Year 1
Sales $540,000 $460,000 ____ ____ ____ ____
Cost of goods sold. 290,000 240,000 ____ ____ ____ ____
Gross profit $250,000 $220,000 ____ ____ ____ ____
92
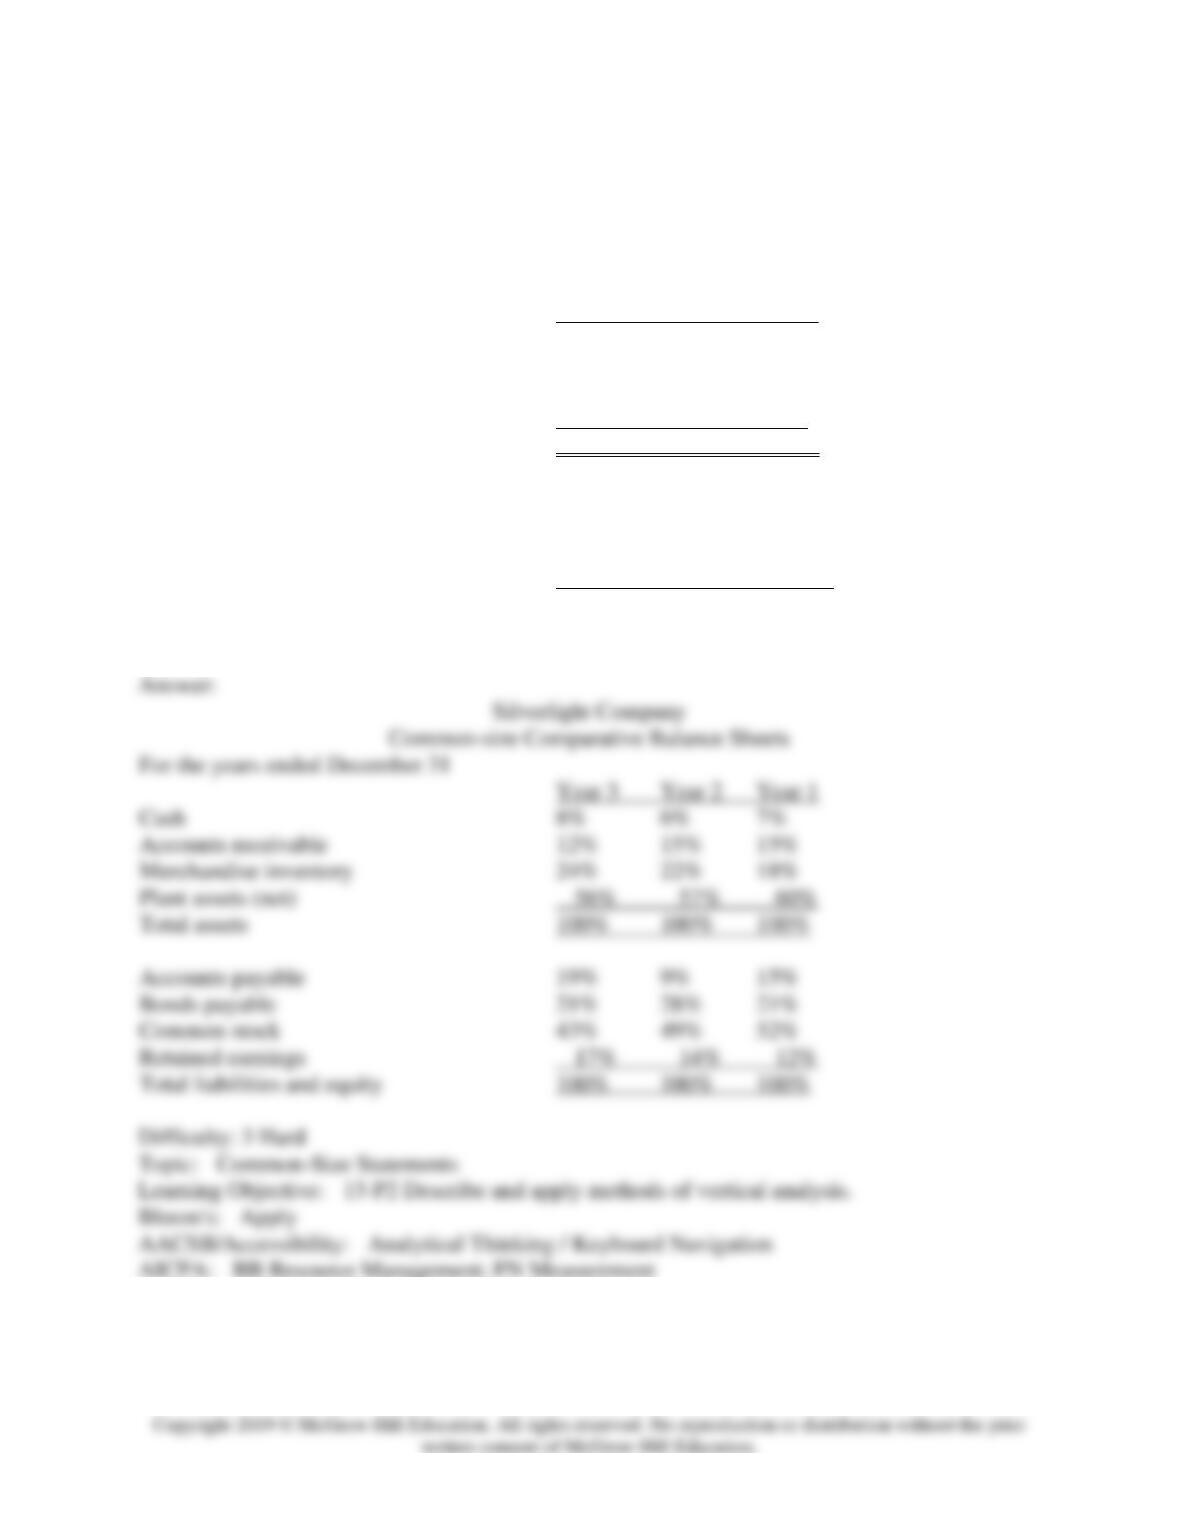
194) The comparative balance sheet for Silverlight Co. is shown below. Express the balance
sheet in common-size percentages.
Silverlight Company
Comparative Balance Sheets (in $000)
For the years ended December 31
Year 3 Year 2 Year 1
Cash $ 49.6 $ 34.2 $ 35.7
Accounts receivable 74.4 85.5 76.5
Merchandise inventory 148.8 125.4 91.8
Plant assets (net) 347.2 324.9 306.0
Total assets $620.0 $570.0 $510.0
Accounts payable $117.8 $ 51.3 $ 76.5
Bonds payable 130.2 159.6 107.1
Common stock 266.6 279.3 265.2
Retained earnings 105.4 79.8 61.2
Total liabilities and equity $620.0 $570.0 $510.0
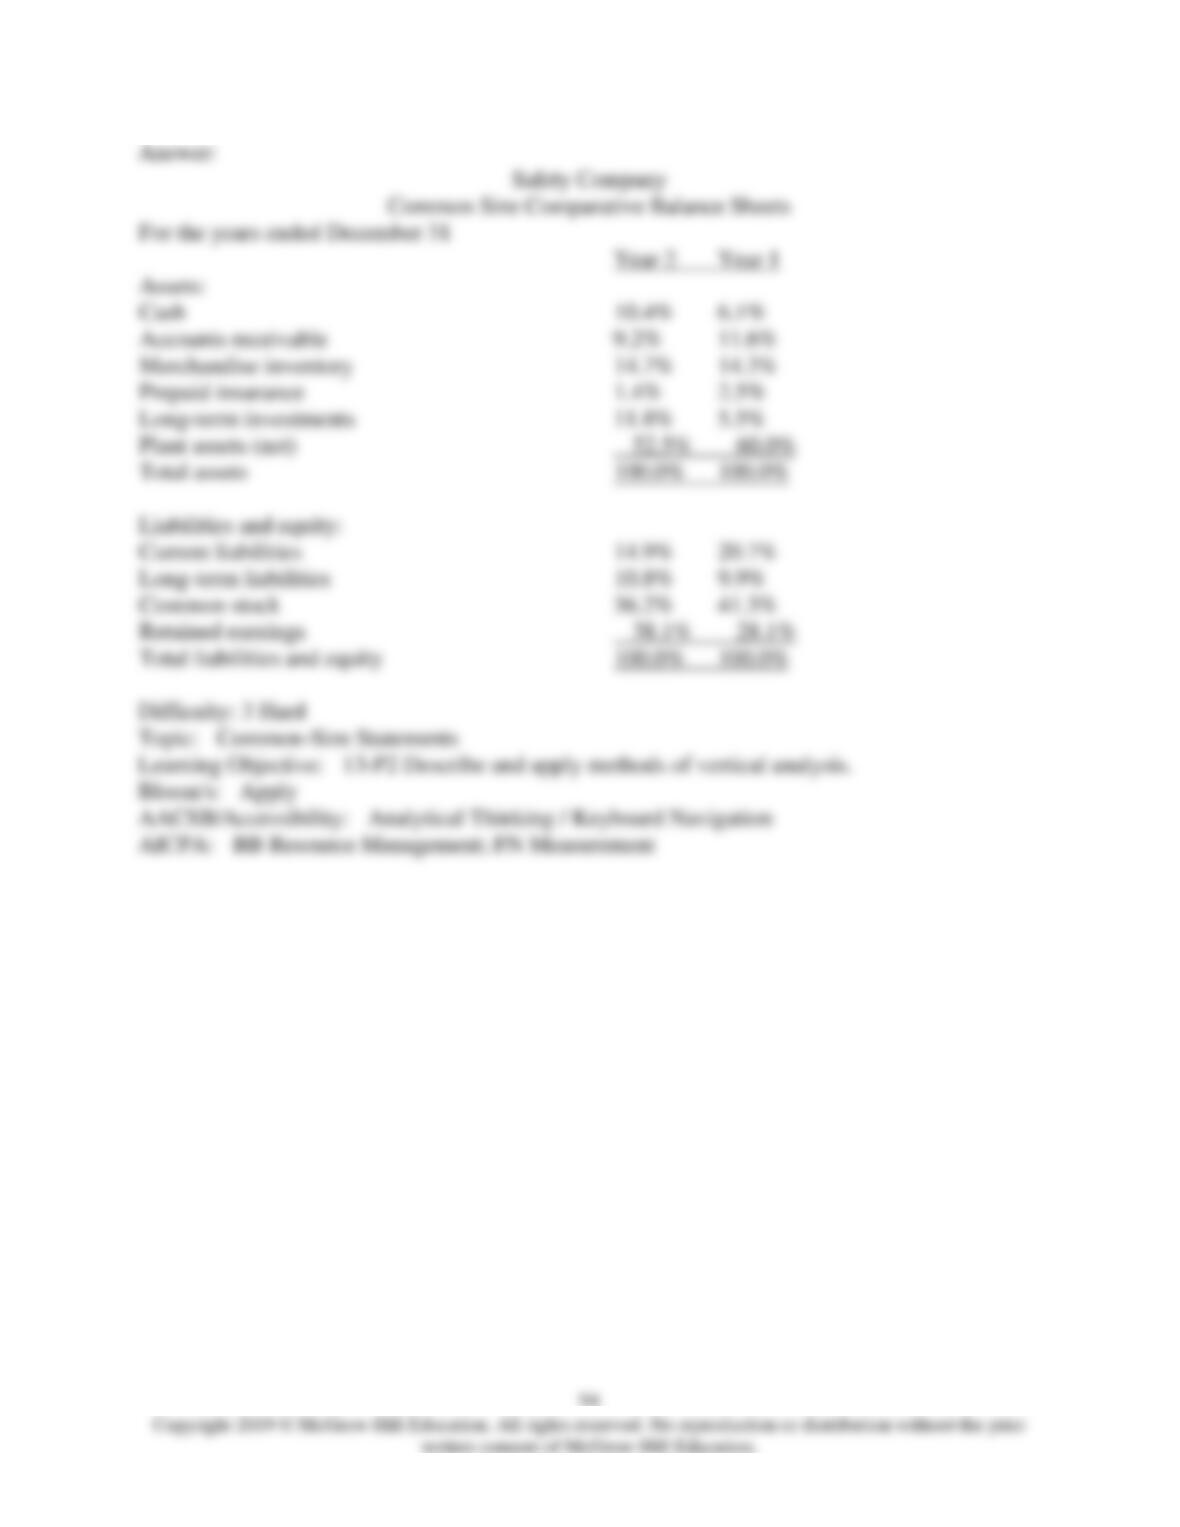
195) Express the following balance sheets for Safety Company in common-size percentages.

93
Safety Company
Balance Sheets
For the years ended December 31
Year 2 Year 1
Assets
Cash $ 43,000 $ 22,000
Accounts receivable 38,000 42,000
Merchandise inventory 61,000 52,000
Prepaid insurance 6,000 9,000
Long-term investments 49,000 20,000
Plant assets (net) 218,000 218,000
Total assets $415,000 $363,000
Liabilities and Equity
Current liabilities $ 62,000 $ 75,000
Long-term liabilities 45,000 36,000
Common stock 150,000 150,000
Retained earnings 158,000 102,000
Total liabilities and equity $415,000 $363,000
196) Express the following income statement information in common-size percentages (round to
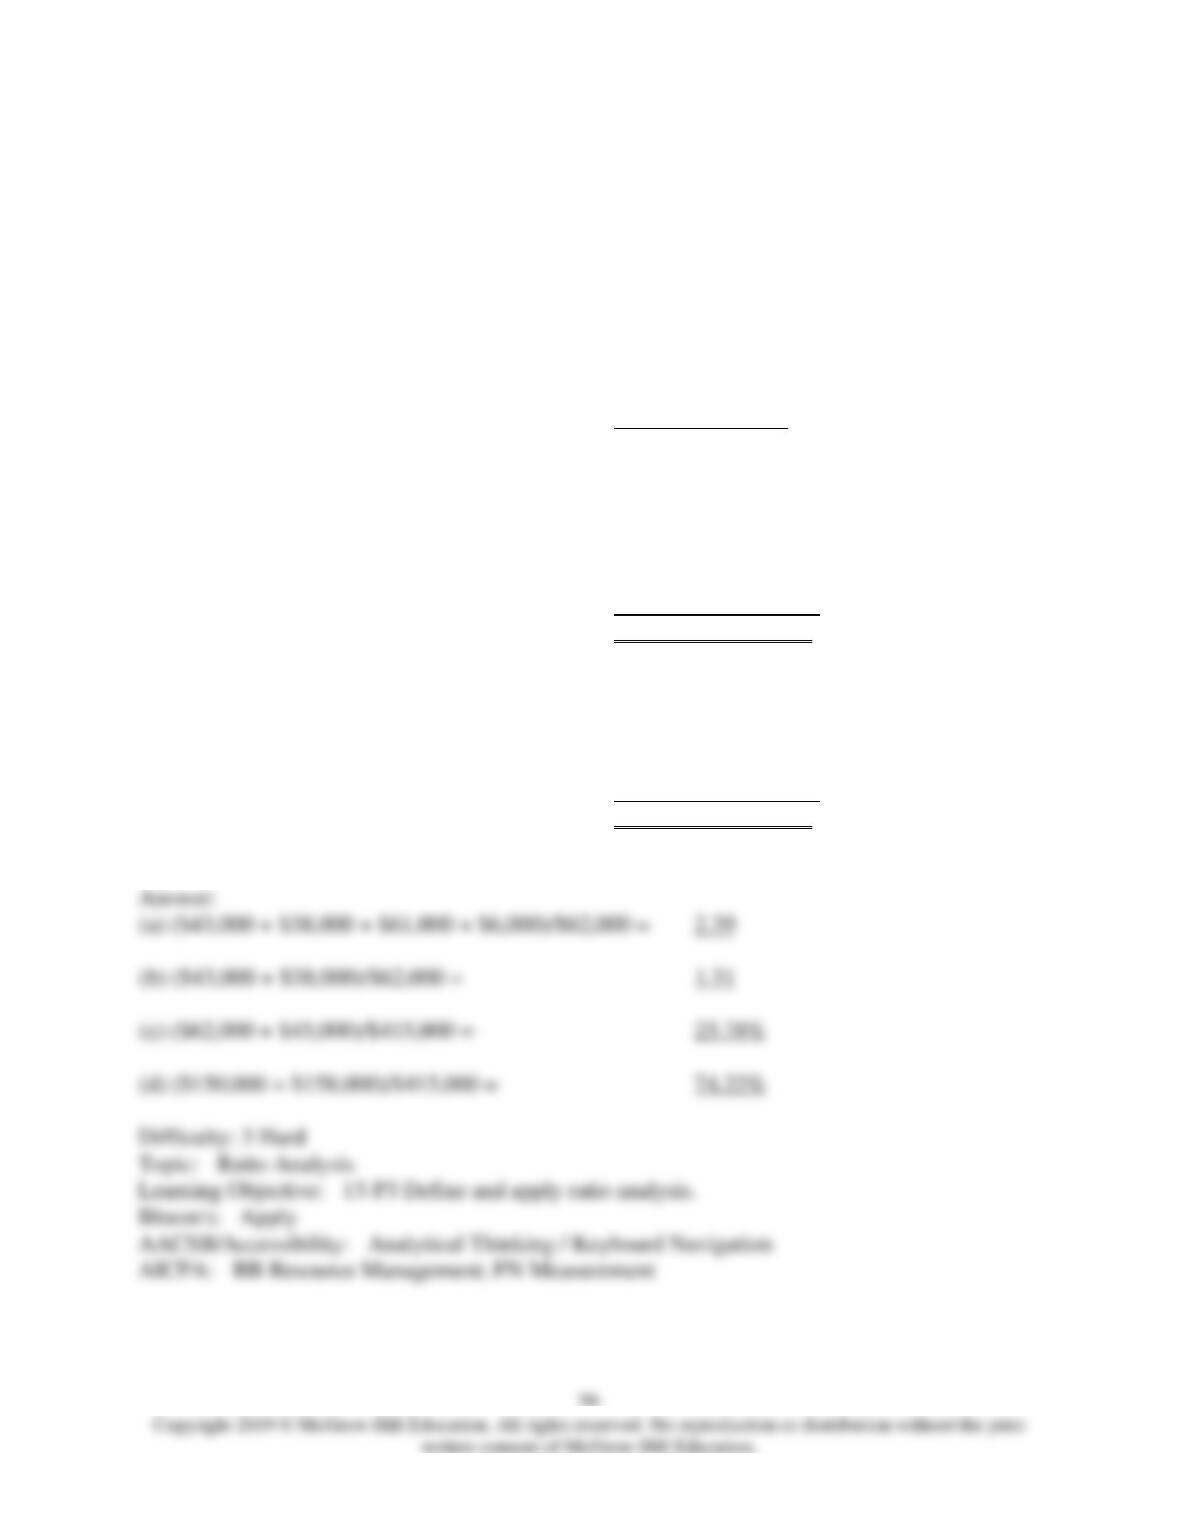
nearest whole percent). Comment on the results.
Haans Corp.
Comparative Income Statements
For the years ended December 31
Year 2 Year 1
Sales $1,200,000 $1,000,000
Cost of goods sold 804,000 650,000
Gross profit $ 396,000 $ 350,000
Selling expenses 132,000 120,000
Administrative expenses 180,000 150,000
Net income $ 4,000 $ 80,000
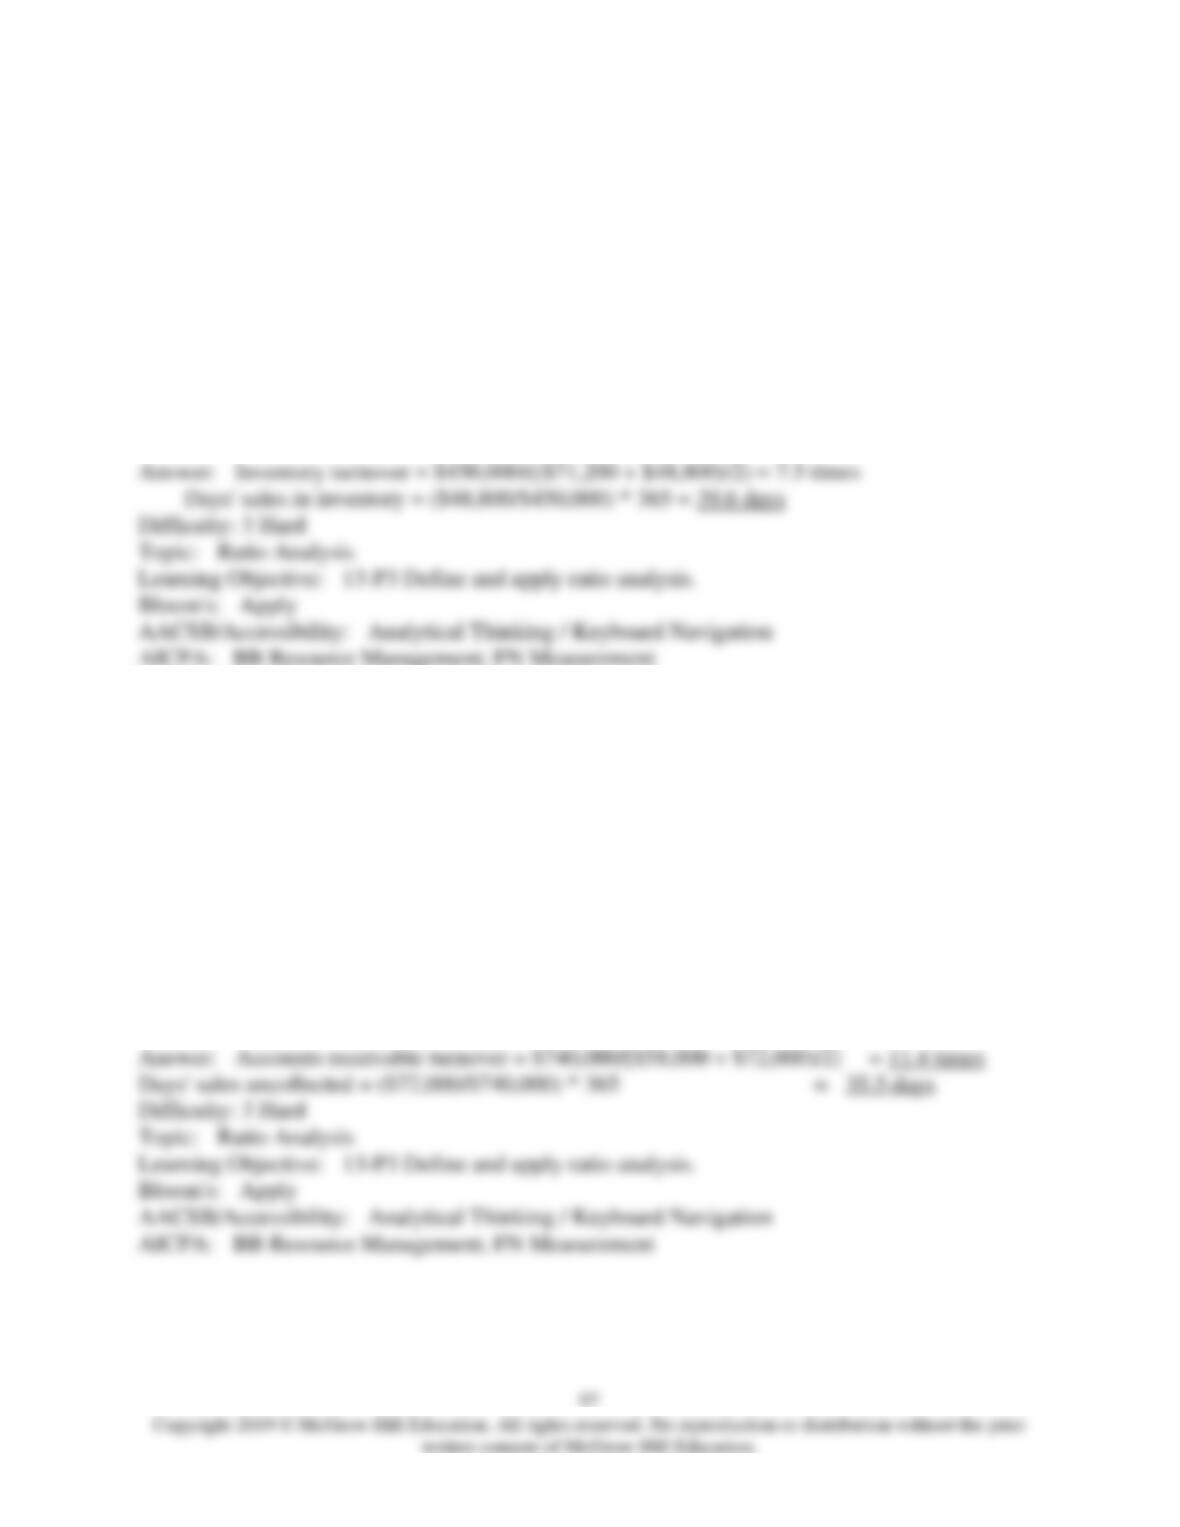
197) Use the balance sheets of Glover shown below to calculate the following ratios for Year 2
(round to the hundredths):
(a) Current ratio.
(b) Acid-test ratio.
(c) Debt ratio.
(d) Equity ratio.
Glover Company
Balance Sheets
For the years ended December 31
Year 2 Year 1
Assets:
Cash $ 43,000 $ 22,000
Accounts receivable 38,000 42,000
Merchandise inventory 61,000 52,000
Prepaid insurance 6,000 9,000
Long-term investments 49,000 20,000
Plant assets (net) 218,000 218,000
Total assets $415,000 $363,000
Liabilities and Equity:
Current liabilities $ 62,000 $ 75,000
Long-term liabilities 45,000 36,000
Common stock 150,000 150,000
Retained earnings 158,000 102,000
Total liabilities and equity $415,000 $363,000
198) The following information is available for the Starr Corporation:
Sales $750,000
Cost of goods sold 450,000
Gross profit 300,000
Operating income 85,000
Net income 42,000
Inventory, beginning-year 71,200
Inventory, end-of-year 48,800
Calculate the company’s inventory turnover and its days’ sales in inventory.
199) The following current year information is available from a manufacturing company:
Sales $740,000
Gross profit on sales 276,000
Operating income 64,000
Income before taxes 44,000
Net income 33,600
Accounts Receivable, beginning-year 58,000
Accounts Receivable, end-of-year 72,000
Calculate the company’s accounts receivable turnover and its days’ sales uncollected.
200) Information from a manufacturing company’s current year income statement follows.
Calculate the company’s (a) profit margin ratio, (b) gross margin ratio, and (c) times interest
earned.
Sales $850,000
Cost of goods sold 455,000
Gross profit $395,000
Operating expenses 260,000
Operating income $ 135,000
Interest expense 32,000
Income before taxes $103,000
Income taxes expense 12,400
Net income $ 90,600
201) A company reported net income of $78,000 and had 15,000 common shares outstanding
throughout the current year. At year-end, the price per share of the company’s stock was $49.40.
What is the company’s year-end price-earnings ratio?
202) A company paid cash dividends on its preferred stock of $40,000 in the current year when
its net income was $120,000 and its average common stockholders’ equity was $640,000. What
is the company’s return on common stockholders’ equity?

100
203) Use the financial data shown below to calculate the following ratios for the current year:
(a) Current ratio.
(b) Acid-test ratio.
(c) Accounts receivable turnover.
(d) Days’ sales uncollected.
(e) Inventory turnover.
(f) Days’ sales in inventory.
Income statement data
Sales (all on credit) $650,000
Cost of goods sold 425,000
Income before taxes 78,000
Net income 54,600
Ending Balance Beginning Balance
Cash $ 19,500 $ 15,000
Accounts receivable (net) 65,000 60,000
Inventory 71,500 64,500
Plant and equipment (net) 195,000 183,900
Total assets $351,000 $323,400
Current liabilities
$ 62,400
$ 52,700
Long-term notes payable 97,500 100,000