Financial Accounting, 11e (Harrison/Horngren/Thomas)
Chapter 13 Financial Statement Analysis
1 Learning Objective 13-1
1) Trend percentages are a form of horizontal analysis that are computed only for balance sheet items.
2) For investment analysis, it is generally considered more useful to calculate the percentage changes in
the dollar amounts of financial statement line items from year to year instead of using the absolute dollar
amounts.
3) Trend analysis using income statement data is widely used for predicting the future.
4) Horizontal analysis compares a financial statement line item in the current year with the same line item
in the prior year.
5) The percentage change in a financial statement line item over two years is computed by dividing the
dollar amount of the line item in the most recent year by the prior year dollar amount of the line item.
6) If a company has sales of $250 in 2017 and $225 in 2018, the percentage decrease from 2017 to 2018 is
10%.
7) If a company has sales of $150 in 2016 and $225 in 2017, the percentage change from 2016 to 2017 is
50%.
8) Horizontal analysis highlights changes in financial statement line items over time and provides a
complete picture of a business.
9) Year to year percentage changes in line items from comparative financial statements is called:
A) benchmarking.
B) horizontal analysis.
C) vertical analysis.
D) common-size financial statements.
10) The primary focus of horizontal analysis is:
A) percentage changes in line items from comparative financial statements.
B) the balance sheet only.
C) the amount of individual financial statement line items as a percentage of some related total, such as
total assets.
D) the income statement only.
11) The percentage change in any individual item shown on comparative financial statements is
calculated by dividing the dollar amount of the change from the base period to the current period by:
A) the amount shown for the current period.
B) the base-period amount.
C) the average of the amounts shown for the base and the current periods.
D) the amount estimated for the future period.
12) Horizontal analysis is most closely related to:
A) trend analysis.
B) economic value added analysis.
C) vertical analysis.
D) benchmarking.
13) A type of analysis that indicates the direction a business is taking is:
A) benchmarking.
B) economic value added analysis.
C) vertical analysis.
D) trend percentages.
14) The formula for the percentage change in a financial statement line item is the current year amount:
A) divided by the base year amount.
B) minus the base year amount divided by the base year amount.
C) minus the base year amount divided by current year amount.
D) added to the base year amount divided by the base year amount.
15) When computing trend percentages:
A) the current year is always equal to 100%.
B) the base year is always the latest year.
C) the base year is always equal to 100%.
D) the base year is equal to the current year plus the previous year divided by two.
16) Zebra Company reports the following figures for the years ending December 31, 2017 and 2016:
2017
2016
Net Sales
$62,000
$45,000
Cost of Goods Sold
41,000
37,000
Gross Profit
$21,000
$8000
What are the percentage changes from 2016 to 2017 for Net Sales, Cost of Goods Sold and Gross Profit,
respectively? (Round your final answers to one decimal place, X.X%)
A) 100%, 162.5%, 10.8%
B) 100%, 0.9%, 0.4%
C) 162.5%, 37.8%, 10.8%
D) 37.8%, 10.8%, 162.5%
17) For the period from 2017 to 2018, a company reports the following:
Percentage change in sales
40% increase
Percentage change in cost of goods sold
20% increase
Percentage change in gross profit
35% increase
If sales are $7,000,000 in 2017, what are sales in 2018?
A) $2,800,000
B) $7,000,000
C) $9,450,000
D) $9,800,000
18) Zemanowski Company reports the following sales figures(in millions):
Year
Net Sales
2013
$104
2014
$107
2015
$109
2016
$111
2017
$114
2018
$120
What is the trend percentage in 2015 if 2013 is the base year? (Round your final answer to the nearest
whole percentage, X%)
A) 110%
B) 103%
C) 105%
D) 107%
19) Nekich Company reports the following sales figures(in millions):
Year
Net Sales
2013
$103
2014
$106
2015
$109
2016
$111
2017
$115
2018
$98
What is the trend percentage in 2018 if 2013 is the base year? (Round your final answer to the nearest
whole percentage, X%)
A) 92%
B) 88%
C) 85%
D) 95%
20) How is the trend percentage for sales in 2017 computed? The base year is 2012.
A) Year 2017 sales ÷ Year 2012 sales
B) (Year 2017 sales – Year 2012 sales) ÷ Year 2012 sales
C) (Year 2017 sales – Year 2012 sales) ÷ Year 2017 sales
D) (Year 2017 sales ÷ Year 2012 sales) × 100
21) How is the percentage change (for horizontal analysis) for sales from 2016 to 2017 computed?
A) Year 2017 sales ÷ Year 2016 sales
B) (Year 2017 sales – Year 2016 sales) ÷ Year 2016 sales
C) (Year 2017 sales – Year 2016 sales) ÷ Year 2017 sales
D) (Year 2017 sales ÷ Year 2016 sales) × 100
22) Bryanwood Company reports the following data:
Percentage Change from 2016 to 2017
Sales
11%
Cost of Goods Sold
6%
Gross Profit
13%
Operating Expenses
–3%
Based on the above information, what can be said about the company’s business strategy?
A) The company has lost control of operating expenses.
B) The company has reduced cost of goods sold.
C) The company has successfully undertaken some cost-cutting measures for operating expenses.
D) The company has fewer sales in 2017 than 2016.
23) Goelzer Company reports the following trend percentages for net income:
Year
Trend Percentage
2013
100%
2014
135%
2015
167%
2016
102%
2017
79%
Given the above data, which statement is FALSE?
A) When compared to 2015, net income is falling in 2016.
B) Net income is increasing in 2014 and 2015.
C) Net income is lower in 2017 than in 2013.
D) Net income is higher in 2017 than in 2013.
2 Learning Objective 13-2
1) When comparing companies of different sizes, vertical analysis is a useful tool.
2) The ratio of the dollar amount of each individual asset to the dollar amount of total assets is an
example of vertical analysis.
3) Vertical analysis compares a line item on the balance sheet, in a current period, to the same line item on
the balance sheet in a prior period.
4) When performing a vertical analysis of the income statement, each line item is stated as a percentage of
net income.
5) A company’s net income as a percentage of sales is 15%. Using vertical analysis, the cost of goods sold
as a percentage of sales must be 85%.
6) Which of the following is typically used as the base in a vertical analysis of an income statement?
A) gross profit
B) operating income
C) net income
D) net sales
7) Which of the following is typically used as the base in a vertical analysis of a balance sheet?
A) total liabilities
B) total stockholders’ equity
C) total assets
D) net sales
8) Expressing cash and cash equivalents as a percentage of total assets is an example of:
A) horizontal analysis.
B) economic value added.
C) ratio analysis.
D) vertical analysis.
9) A vertical analysis is primarily concerned with:
A) the dollar amount of the change in various financial statement line items from year to year.
B) individual financial statement line items expressed as a percentage of a base (which represents 100%).
C) percentage changes in the balances of line items from comparative financial statements.
D) the change in key financial statement ratios over a specified period of time.
10) Mussa Corporation reports the following data:
Net sales
$270,000
Cost of goods sold
180,000
Gross profit
$90,000
In vertical analysis, the cost of goods sold percentage is closest to: (Round your final answer to the nearest
whole percentage, X%)
A) 33%.
B) 50%.
C) 67%.
D) 200%.
11) In vertical analysis:
A) a base amount is optional.
B) a base amount is required.
C) line items from balance sheets are examined only.
D) line items from income statements are examined only.
12) A financial statement line item expressed as a percentage of a base amount is a result of:
A) horizontal analysis.
B) economic value added.
C) vertical analysis.
D) comparative analysis.
13) In performing vertical analysis, the base for inventory is:
A) total liabilities and stockholders’ equity.
B) total assets.
C) total cash and cash equivalents.
D) total current assets.
14) In performing vertical analysis, the base for operating expenses is:
A) net sales.
B) gross profit.
C) net income.
D) operating income.
15) Given the following data:
Current liabilities
$800,000
Noncurrent liabilities
200,000
Stockholders’ equity
900,000
Net sales
1,000,000
Gross sales
2,050,000
In vertical analysis, current liabilities would be expressed as: (Round your final answer to the nearest
whole percent, X%.)
A) 80%.
B) 42%.
C) 39%.
D) 47%.
16) In performing vertical analysis, the base for income before taxes is:
A) net income.
B) gross sales.
C) gross profit.
D) net sales.
17) In performing vertical analysis, the base for income tax expense is:
A) net sales.
B) gross revenues.
C) net income.
D) gross profit.
18) Given the following data:
Accounts receivable, net
$200,000
Current assets
900,000
Total assets
3,000,000
Net sales
7,000,000
In vertical analysis, Accounts Receivable, net would be expressed as: (Round your final answer to the
nearest whole percent, X%.)
A) 3%.
B) 43%.
C) 7%.
D) 22%.
19) A vertical analysis of a balance sheet shows that current assets have increased from 42% to 56%. This
means that:
A) current assets have increased as a percentage of total assets.
B) the dollar amount of total assets has increased.
C) the dollar amount of total assets has decreased.
D) the dollar amount of long-term assets has increased.
20) Given the following data:
Net sales
$360,000
Cost of goods sold
$80,000
Gross profit
$$280,000
Operating expenses
$60,000
Net income
$220,000
In vertical analysis, net income would be expressed as: (Round your final answer to the nearest whole
percent, X%.)
A) 61%.
B) 78%.
C) 22%.
D) 17%.
21) Reimer Company reports the following data:
2017
2016
Sales
100%
100%
Cost of Goods Sold
26%
16%
Gross Profit
74%
84%
Operating Expenses
35%
30%
Net Income
39%
54%
When evaluating the results of operations, what can be said about Reimer Company?
A) Using vertical analysis, the company’s profitability declined in 2016.
B) Using horizontal analysis, the company’s profitability declined in 2016.
C) Using vertical analysis, the company’s profitability declined in 2017.
D) Using horizontal analysis, the company’s profitability declined in 2017.
22) Wilhelm Company’s gross profit percentages for the past 3 years are:
Year
Gross Profit Percentages
2018
25%
2017
22.4%
2016
21.3%
Based on the above data, what can be said about the Wilhelm Company?
A) The sales volume is decreasing.
B) The company is decreasing the income tax expense.
C) The company is controlling operating expenses.
D) The company is controlling cost of goods sold.
23) Hull Company reports the following data:
Year
Total Operating Expenses to Net Sales
2015
17%
2016
20%
2017
27%
2017 Industry Average
15%
Based on the above data, what can be said about the Hull Company?
A) The company is controlling operating expenses.
B) The company is doing better than the industry average.
C) The company is losing control of operating expenses.
D) The company is increasing sales over time.
24) In 2016, the Zenon Company reported that property, plant and equipment were equal to 13% of total
assets. In 2016, current assets were equal to 87% of total assets. In 2017 the company reported that
property, plant and equipment were equal to 28% of total assets. In 2017, current assets were equal to 72%
of total assets. What conclusion can be reached from this information?
A) In 2017, the company is downsizing.
B) In 2017, property, plant and equipment as a proportion of total assets increased.
C) In 2017, the company is investing in the future.
D) B and C.
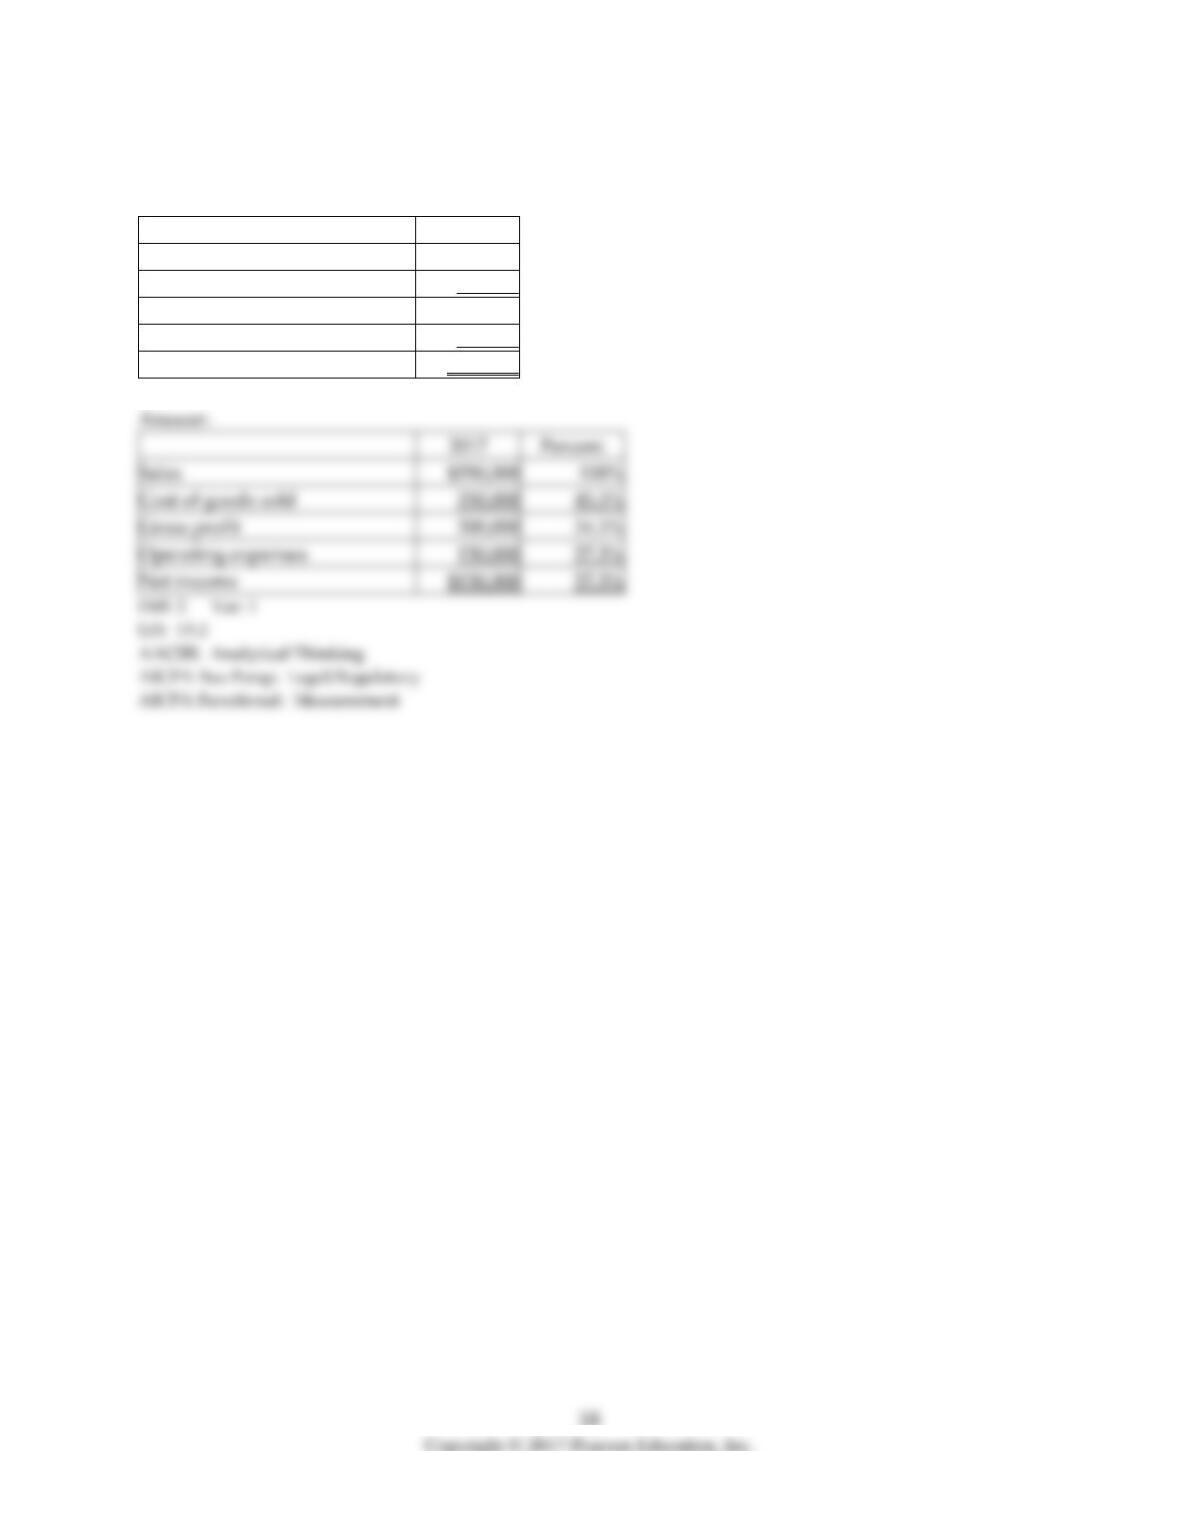
25) Prepare a vertical analysis for Katrina Corporation using the information shown below. Round
percentages to one decimal place.
2017
Sales
$550,000
Cost of goods sold
250,000
Gross profit
300,000
Operating expenses
150,000
Net income
$150,000
Cost of goods sold
250,000
Gross profit
300,000
Operating expenses
150,000
Net income
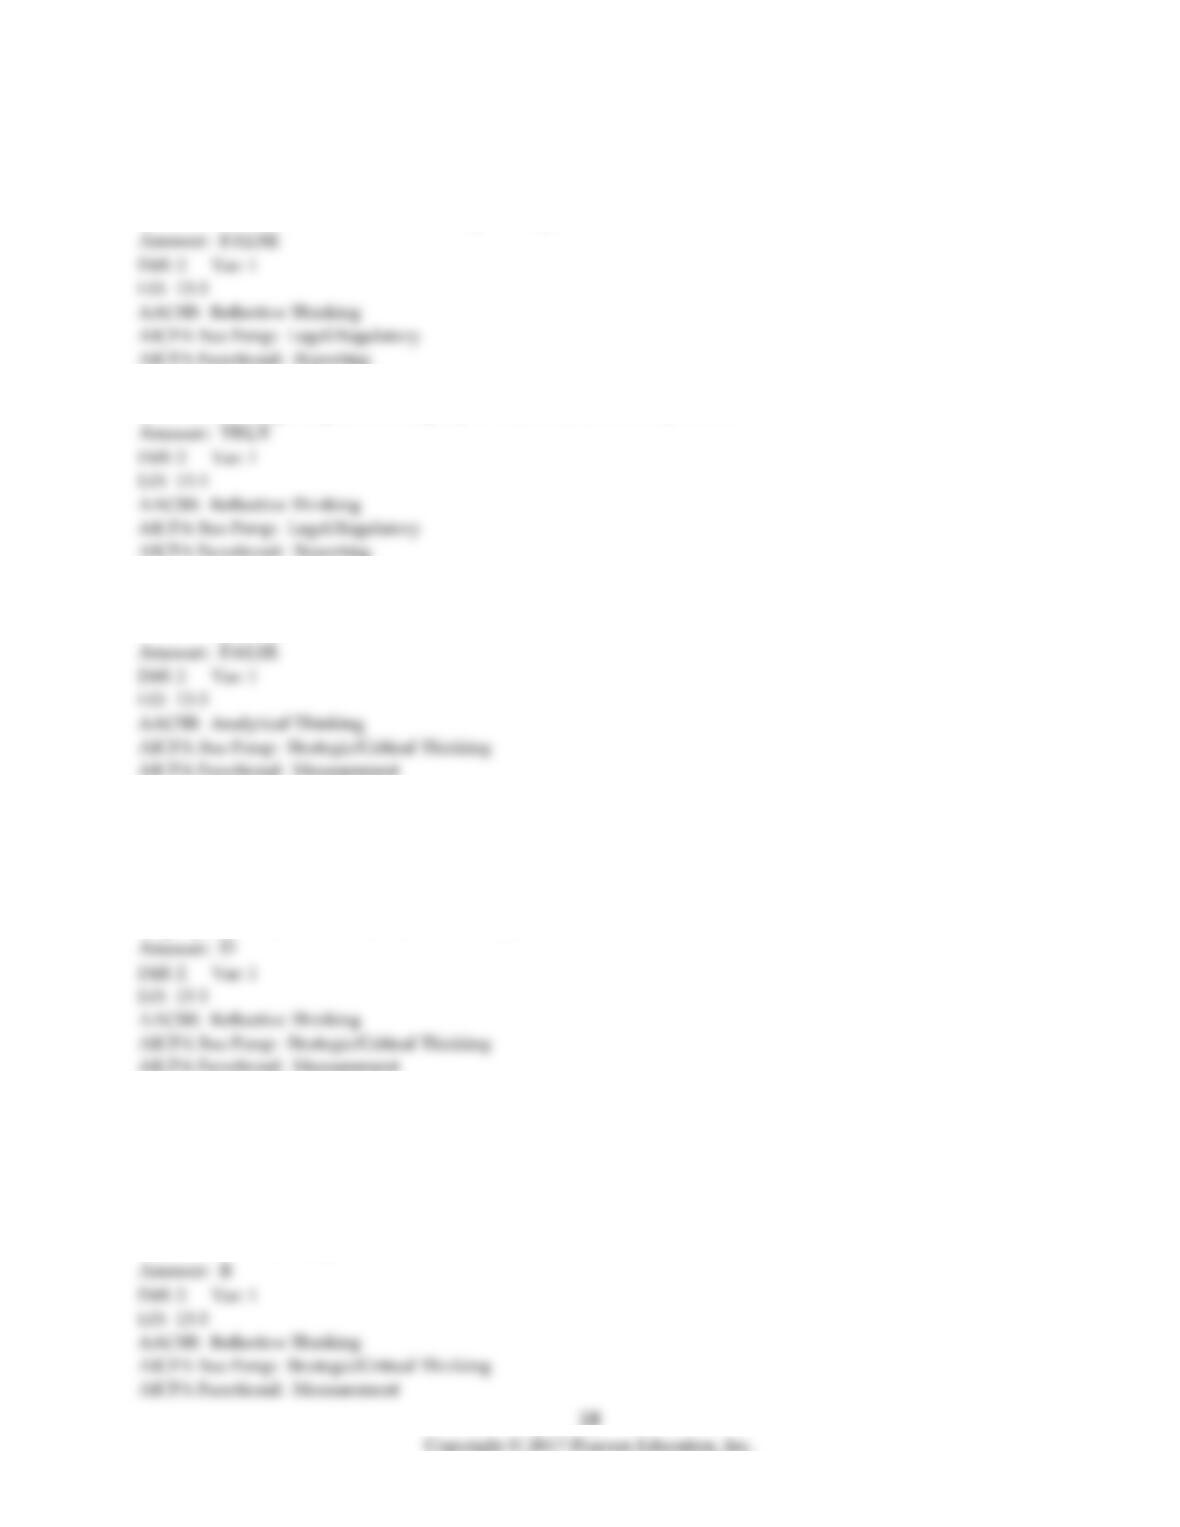
26) Dynasty Incorporated has the following data available at December 31, 2017:
Total current assets
$ 900
Property, plant and equipment, net
1,200
Intangible assets
300
Total current liabilities
600
Long-term debt
500
Common stock
400
Additional paid-in capital
800
Retained earnings
100
Prepare a vertical analysis of Dynasty’s balance sheet. Round percentages to one decimal point.
Total current assets
Property, plant and equipment, net
Intangible asset
Total current liabilities
Long-term debt
Stockholders’ equity
Common stock
Additional paid-in capital
Retained earnings
Total stockholders’ equity
Total liabilities and stockholders’ equity
3 Learning Objective 13-3
1) Common-size financial statements report only dollar amounts.
2) Benchmarking compares a company to some standard set by others.
3) Benchmarking common size variables against a key competitor provides meaningful information only
if the companies are similar in size.
4) Which of the following would be most helpful in the comparison of different size companies?
A) horizontal analysis
B) comparison of their net incomes
C) comparison of their working capital balances
D) preparation of common-size financial statements
5) A financial statement that shows each line item as a percentage of one key item on the statement is
referred to as a:
A) benchmarking.
B) common-size statement.
C) horizontal analysis.
D) financial ratio analysis.
6) On a common-size balance sheet, each line item is expressed as a percentage of:
A) current assets.
B) operating income.
C) total assets.
D) net income.
7) On a common-size income statement, income taxes expense is expressed as a percentage of:
A) net income.
B) total stockholders’ equity.
C) total assets.
D) net sales.
8) You are using a leading competitor, Company B, for benchmarking your company, Company A. When
benchmarking, the gross margin of Company A is expressed as a percentage of:
A) the net sales of Companies A and B.
B) Company B’s net sales.
C) Company A’s net income.
D) Company A’s net sales.
9) Walton Company’s return on sales for the most recent year was 5%. The industry leader reports a
return on sales of 7%. The comparison of Walton Company’s return on sales to the industry leader is an
example of:
A) benchmarking.
B) gross margin analysis.
C) detail analysis.
D) intercompany analysis.
10) You are the CEO of Company A and you are using an industry leader (Leader Company) for
benchmarking. Company A is much smaller than Company B in terms of total assets and total sales
revenue. You should compare the:
A) gross profit of Company A to the gross profit of Leader Company.
B) net income of Company A to the net income of Leader Company.
C) net sales of Company A to the net sales of Leader Company.
D) net income to net sales ratio of Company A to net income to net sales ratio of Leader Company.
11) Szidon Company reports the following data:
Szidon
Key Competitor
Net income
$1,000,000
$500,000
Net income divided by net sales
1.5%
5.5%
Using benchmarking, what can be said about Szidon Company?
A) Szidon is inferior to the key competitor because the key competitor’s net income percentage is higher.
B) Szidon is superior to the key competitor because net income is higher.
C) There is not enough information to make any conclusions.
D) There is conflicting information so no conclusions can be reached.