
Name:
Class:
Date:
chapter 12
Indicate whether the statement is true or false.
1. Methods that ignore present value in capital investment analysis include the average rate of return method.
a.
True
b.
False
2. A company is planning to purchase a machine that will cost $24,000, have a 6-year life, and have no salvage
value. The company expects to sell the machine’s output of 3,000 units evenly throughout each year. Total operating
income generated over the life of the machine is estimated to be $12,000. The machine will generate net cash inflows of
$6,000 per year. The payback period for the machine is 12 years.
a.
True
b.
False
3. A company is considering the purchase of a new machine for $48,000. Management expects that the machine can
produce sales of $16,000 each year for the next 10 years. Expenses are expected to include direct materials, direct labor,
and factory overhead totaling $8,000 per year plus depreciation of $4,000 per year. All revenues and expenses except
depreciation are on a cash basis. The payback period for the machine is 6 years.
a.
True
b.
False
4. The cash payback method of capital investment analysis is one of the methods referred to as a present value method.
a.
True
b.
False
5. The time expected to pass before the net cash inflows from an investment would return its initial cost is called the
amortization period.
a.
True
b.
False
6. Net present value and the payback period are examples of discounted cash flow methods used in capital investment
decisions.
a.
True
b.
False
7. The computations involved in the net present value method of analyzing capital investment proposals are more
involved than those for the average rate of return method.
a.
True
b.
False
8. The average rate of return method of capital investment analysis gives consideration to the present value of future cash
flows.
a.
True
b.
False
9. A company is considering purchasing a machine for $21,000. The machine will generate operating income of $2,000;
annual net cash inflows from the machine will be $3,500. The cash payback period for the new machine is 6 years.
a.
True

Name:
Class:
Date:
chapter 12
b.
False
10. A qualitative characteristic that may influence capital investment analysis is the investment proposal’s impact on
market opportunities.
a.
True
b.
False
11. If in evaluating a proposal by use of the net present value method there is an excess of the present value of future cash
inflows over the amount to be invested, the rate of return on the proposal exceeds the rate used in the analysis.
a.
True
b.
False
12. The cash payback method can be used only when net cash inflows are the same for each period.
a.
True
b.
False
13. If in evaluating a proposal by use of the net present value method there is an excess of the present value of future cash
inflows over the amount to be invested, the rate of return on the proposal is less than the rate used in the analysis.
a.
True
b.
False
14. A company is considering the purchase of a new piece of equipment for $90,000. Predicted annual net cash inflows
from the investment are $36,000 (Year 1), $30,000 (Year 2), $18,000 (Year 3), $12,000 (Year 4), and $6,000 (Year
5). The average operating income generated from the investment over its 5-year life is $20,400. The cash payback period
is 3.5 years.
a.
True
b.
False
15. The process by which management allocates available investment funds among competing capital investment
proposals is termed capital rationing.
a.
True
b.
False
16. A qualitative characteristic that may influence capital investment analysis is the investment proposal’s impact on
employee morale.
a.
True
b.
False
17. The computations involved in the net present value method of analyzing capital investment proposals are less involved
than those for the average rate of return method.
a.
True
b.
False
18. Methods that ignore present value in capital investment analysis include the cash payback method.
a.
True
b.
False

Name:
Class:
Date:
chapter 12
19. In computing the net present value of an investment in equipment, the required investment and its residual value
should be subtracted from the present value of all future cash inflows.
a.
True
b.
False
20. The internal rate of return method of analyzing capital investment proposals uses present value concepts to compute a
rate of return expected from the proposals.
a.
True
b.
False
21. The excess of the cash flowing in from revenues over the cash flowing out for expenses is termed net cash flow.
a.
True
b.
False
22. A qualitative characteristic that may influence capital investment analysis is the investment proposal’s impact on
manufacturing flexibility.
a.
True
b.
False
23. A company is planning to purchase a machine that will cost $24,000, have a 6-year life, and have no salvage
value. The company expects to sell the machine’s output of 3,000 units evenly throughout each year. Total operating
income generated over the life of the machine is estimated to be $12,000. The machine will generate net cash inflows of
$6,000 per year. The average rate of return for the machine is 16.7%.
a.
True
b.
False
24. The methods of evaluating capital investment proposals can be grouped into two general categories referred to as (1)
the average rate of return and (2) the cash payback methods.
a.
True
b.
False
25. A qualitative characteristic that may influence capital investment analysis is the investment proposal’s impact on
manufacturing productivity.
a.
True
b.
False
26. Care must be taken when making capital investment decisions, since a long-term commitment of funds is involved and
operations could be affected for many years.
a.
True
b.
False
27. Average rate of return equals average investment divided by estimated average annual income.
a.
True
b.
False
28. In computing the present value of an investment in equipment, the present value of the residual value should be added
to the cash inflows

Name:
Class:
Date:
chapter 12
38. A company is considering the purchase of a new machine for $48,000. Management expects that the machine can
a.
True
b.
False
29. With sensitivity analysis, at least one input must be a known (not estimated) value.
a.
True
b.
False
30. With expected value analysis, incorporating the probabilities of various outcomes allows uncertainty to be completely
eliminated.
a.
True
b.
False
31. The anticipated purchase of a fixed asset for $400,000, with a useful life of 5 years and no residual value, is expected
to yield total net income of $300,000 over the 5 years. The expected average rate of return is 30%.
a.
True
b.
False
32. In net present value analysis for a proposed capital investment, the expected future net cash flows are reduced to their
present values.
a.
True
b.
False
33. The average rate of return method of analyzing capital investment decisions measures the average rate of return from
using the asset over its entire life.
a.
True
b.
False
34. The methods of evaluating capital investment proposals can be grouped into two general categories referred to as (1)
methods that do not use present values and (2) methods that use present values.
a.
True
b.
False
35. If in evaluating a proposal by use of the net present value method there is a deficiency of the present value of future
cash inflows over the amount to be invested, the proposal should be accepted.
a.
True
b.
False
36. A series of equal cash flows at fixed intervals is termed an annuity.
a.
True
b.
False
37. If a proposed expenditure of $70,000 for a fixed asset with a 4-year life has an annual expected net cash inflow and net
income of $32,000 and $12,000, respectively, the cash payback period is 2.5 years.
a.
True
b.
False

Name:
Class:
Date:
chapter 12
produce sales of $16,000 each year for the next 10 years. Expenses are expected to include direct materials, direct labor,
and factory overhead totaling $8,000 per year plus depreciation of $4,000 per year. All revenues and expenses except
depreciation are on a cash basis. The payback period for the machine is 12 years.
a.
True
b.
False
39. A company is considering purchasing a machine for $21,000. The machine will generate operating income of $2,000;
annual net cash inflows from the machine will be $3,500. The cash payback period for the new machine is 10.5 years.
a.
True
b.
False
40. The anticipated purchase of a fixed asset for $400,000, with a useful life of 5 years and no residual value, is expected
to yield total net income of $200,000 over the 5 years. The expected average rate of return is 50%.
a.
True
b.
False
41. A company is planning to purchase a machine that will cost $24,000, have a 6-year life, and have no salvage
value. The company expects to sell the machine’s output of 3,000 units evenly throughout each year. Total operating
income generated over the life of the machine is estimated to be $12,000. The machine will generate net cash inflows of
$6,000 per year. The payback period for the machine is 4 years.
a.
True
b.
False
42. The method of analyzing capital investment proposals in which the estimated average annual income is divided by the
average investment is the average rate of return method.
a.
True
b.
False
43. The average rate of return is a measure of profitability computed by dividing the average annual cash inflows from an
asset by the average amount invested in the asset.
a.
True
b.
False
44. The expected period of time between the date of an investment and the recovery in cash of the amount invested is
called the discount period.
a.
True
b.
False
45. If in evaluating a proposal by use of the net present value method there is a deficiency of the present value of future
cash inflows over the amount to be invested, the proposal should be rejected.
a.
True
b.
False
46. A qualitative characteristic that may influence capital investment analysis is the investment proposal’s impact on
product quality.
a.
True
b.
False

Name:
Class:
Date:
chapter 12
47. Methods that ignore present value in capital investment analysis include the internal rate of return method.
a.
True
b.
False
48. The expected period of time between the date of an investment and the recovery in cash of the amount invested is
called the cash payback period.
a.
True
b.
False
49. The process by which management allocates available investment funds among competing capital investment
proposals is termed present value analysis.
a.
True
b.
False
50. If a proposed expenditure of $80,000 for a fixed asset with a 4-year life has an annual expected net cash inflow and net
income of $32,000 and $12,000, respectively, the cash payback period is 4 years.
a.
True
b.
False
51. A company is planning to purchase a machine that will cost $24,000, have a 6-year life, and have no salvage
value. The company expects to sell the machine’s output of 3,000 units evenly throughout each year. Total operating
income generated over the life of the machine is estimated to be $12,000. The machine will generate net cash inflows of
$6,000 per year. The average rate of return for the machine is 50%.
a.
True
b.
False
52. In net present value analysis for a proposed capital investment, the expected future net cash flows are averaged and
then reduced to their present values.
a.
True
b.
False
53. For Years 1–5, a proposed expenditure of $250,000 for a fixed asset with a 5-year life has expected net income of
$40,000, $35,000, $25,000, $25,000, and $25,000, respectively, and net cash inflows of $90,000, $85,000, $75,000,
$75,000, and $75,000, respectively. The cash payback period is 3 years.
a.
True
b.
False
54. A present value index can be used to rank competing capital investment proposals when the net present value method
is used.
a.
True
b.
False
55. For Years 1–5, a proposed expenditure of $500,000 for a fixed asset with a 5-year life is expected to generate
operating income of $40,000, $35,000, $25,000, $25,000, and $25,000, respectively, and net cash inflows of $90,000,
$85,000, $75,000, $75,000, and $75,000, respectively. The cash payback period is 5 years.
a.
True

Name:
Class:
Date:
chapter 12
b.
False
56. Sensitivity analysis assigns likelihoods (probabilities) to various inputs, thus incorporating uncertainty directly into the
output (answer).
a.
True
b.
False
57. The excess of the cash flowing in from revenues over the cash flowing out for expenses is termed net discounted cash
flow.
a.
True
b.
False
58. Average rate of return equals average annual income divided by average investment.
a.
True
b.
False
59. The anticipated purchase of a fixed asset for $400,000, with a useful life of 5 years and no residual value, is expected
to yield total net income of $200,000 over the 5 years. The expected average rate of return is 25%.
a.
True
b.
False
60. The process by which management plans, evaluates, and controls investments in fixed assets is called capital
investment analysis.
a.
True
b.
False
61. The anticipated purchase of a fixed asset for $400,000, with a useful life of 5 years and no residual value, is expected
to yield total net income of $300,000 over the 5 years. The expected average rate of return is 37.5%.
a.
True
b.
False
Indicate the answer choice that best completes the statement or answers the question.
62. Brunette Company is contemplating investing in a new piece of manufacturing machinery. The amount to be invested
is $180,000. The present value of the future cash flows generated by the project is $163,000. Should the company invest
in this project?
a.
yes, because the rate of return on the project exceeds the desired rate of return used to compute the present
value of the future cash flows
b.
no, because the rate of return on the project is less than the desired rate of return used to compute the present
value of the future cash flows
c.
no, because the net present value is $17,000
d.
yes, because the rate of return on the project is equal to the desired rate of return used to compute the present
value of the future cash flows
63. The formula for determining the present value factor for an annuity of $1 is
a.
Amount to Be Invested ÷ Annual Average Net Income
b.
Annual Net Cash Flow ÷ Amount to Be Invested

Name:
Class:
Date:
chapter 12
c.
Annual Average Net Income ÷ Amount to Be Invested
d.
Amount to Be Invested ÷ Equal Annual Net Cash Flows
64. The management of Dakota Corporation is considering the purchase of a new machine costing $420,000. The
company’s desired rate of return is 10%. The present value factors for $1 at compound interest of 10% for 1 through 5
years are 0.909, 0.826, 0.751, 0.683, and 0.621, respectively. In addition to the foregoing information, use the following
data in determining the acceptability of this investment:
Year
Operating
Income
Net Cash
Flow
1
$100,000
$180,000
2
40,000
120,000
3
20,000
100,000
4
10,000
90,000
5
10,000
90,000
The present value index for this investment is
a.
1.08
b.
1.45
c.
1.14
d.
0.70
The management of Wyoming Corporation is considering the purchase of a new machine costing $375,000. The
company’s desired rate of return is 6%. The present value factor for an annuity of $1 at interest of 6% for 5 years is 4.212.
In addition to the foregoing information, use the following data in determining the acceptability of this investment:
Year
Operating
Income
Net Cash
Flow
1
$18,750
$93,750
2
18,750
93,750
3
18,750
93,750
4
18,750
93,750
5
18,750
93,750
65. The cash payback period for this investment is
a.
4 years
b.
5 years
c.
20 years
d.
3 years
The management of River Corporation is considering the purchase of a new machine costing $380,000. The company’s
desired rate of return is 6%. The present value factor for an annuity of $1 at interest of 6% for 5 years is 4.212. In addition
to the foregoing information, use the following data in determining the acceptability of this investment:
Year
Operating
Income
Net Cash
Flow
1
$20,000
$95,000
2
20,000
95,000
3
20,000
95,000
4
20,000
95,000

Name:
Class:
Date:
chapter 12
5
20,000
95,000
66. The cash payback period for this investment is
a.
4 years
b.
5 years
c.
20 years
d.
3 years
67. A company is contemplating investing in a new piece of manufacturing machinery. The amount to be invested is
$210,000. The present value of the future cash flows is $225,000. The company’s desired rate of return used in the
present value computations was 12%. Which of the following statements is true?
a.
The project should not be accepted because the net present value is negative.
b.
The internal rate of return on the project is less than 12%.
c.
The internal rate of return on the project is more than 12%.
d.
The internal rate of return on the project is equal to 12%.
Following is a table for the present value of $1 at compound interest:
Year
6%
10%
12%
1
0.943
0.909
0.893
2
0.890
0.826
0.797
3
0.840
0.751
0.712
4
0.792
0.683
0.636
5
0.747
0.621
0.567
Following is a table for the present value of an annuity of $1 at compound interest:
Year
6%
10%
12%
1
0.943
0.909
0.893
2
1.833
1.736
1.690
3
2.673
2.487
2.402
4
3.465
3.170
3.037
5
4.212
3.791
3.605
68. Using the tables provided, the present value of $15,000 to be received at the end of each of the next 2 years, assuming
an earnings rate of 6%, is
a.
$27,495
b.
$26,040
c.
$30,000
d.
$25,350
69. The management of Zesty Corporation is considering the purchase of a new machine costing $400,000. The
company’s desired rate of return is 10%. The present value factors for $1 at compound interest of 10% for Years 1 through
5 are 0.909, 0.826, 0.751, 0.683, and 0.621, respectively. In addition to the foregoing information, use the following data
in determining the acceptability in this situation:
Year
Operating
Income
Net Cash
Flow
1
$100,000
$180,000

Name:
Class:
Date:
chapter 12
2
40,000
120,000
3
20,000
100,000
4
10,000
90,000
5
10,000
90,000
The cash payback period for this investment is
a.
5 years
b.
4 years
c.
2 years
d.
3 years
The management of River Corporation is considering the purchase of a new machine costing $380,000. The company’s
desired rate of return is 6%. The present value factor for an annuity of $1 at interest of 6% for 5 years is 4.212. In addition
to the foregoing information, use the following data in determining the acceptability of this investment:
Year
Operating
Income
Net Cash
Flow
1
$20,000
$95,000
2
20,000
95,000
3
20,000
95,000
4
20,000
95,000
5
20,000
95,000
70. The net present value for this investment is
a.
$20,140
b.
$(20,140)
c.
$19,875
d.
$(19,875)
71. Given the following sensitivity analysis, which of the following statements is true?
Estimated Annual Net Cash Flow
$ 500,000
$ 600,000
$ 700,000
Present value of annual net cash flows (× 4.487)
$ 2,243,500
$ 2,692,200
$ 3,140,900
Present value of residual value
50,000
50,000
50,000
Total present value
$ 2,293,500
$ 2,742,200
$ 3,190,900
Amount to be invested
(3,000,000)
(3,000,000)
(3,000,000)
Net present value
$ (706,500)
$ (257,800)
$ 190,900
a.
Only an annual net cash flow of $700,000 will allow for a positive residual value.
b.
The total amount to be invested is $3,050,000.
c.
The annual net cash flow necessary to generate a positive net present value is above $700,000.
d.
The investment is not justified if the annual net cash flow will be $500,000 or $600,000.
72. The _____ method of analyzing capital investment proposals divides the estimated average annual income by the
average investment.

Name:
Class:
Date:
chapter 12
a.
cash payback
b.
net present value
c.
internal rate of return
d.
average rate of return
73. The production department is proposing the purchase of an automatic insertion machine. It has identified three
machines and has asked the accountant to analyze them to determine which one has the best cash payback.
Machine A
Machine B
Machine C
Annual cash flow
$ 40,000
$ 50,000
$ 75,000
Average investment
300,000
250,000
500,000
a.
Machine A
b.
Machine C
c.
Machine B
d.
Machines B and C have the same preferred payback period.
74. Which of the following methods of evaluating capital investment proposals uses the concept of present value to
compute a rate of return?
a.
average rate of return
b.
accounting rate of return
c.
cash payback period
d.
internal rate of return
Following is a table for the present value of $1 at compound interest:
Year
6%
10%
12%
1
0.943
0.909
0.893
2
0.890
0.826
0.797
3
0.840
0.751
0.712
4
0.792
0.683
0.636
5
0.747
0.621
0.567
Following is a table for the present value of an annuity of $1 at compound interest:
Year
6%
10%
12%
1
0.943
0.909
0.893
2
1.833
1.736
1.690
3
2.673
2.487
2.402
4
3.465
3.170
3.037
5
4.212
3.791
3.605
75. Using the tables provided, the present value of $3,000 (rounded to the nearest dollar) to be received at the end of each
of the next 4 years, assuming an earnings rate of 12%, is
a.
$10,815
b.
$7,206
c.
$9,111
d.
$1,908

Name:
Class:
Date:
chapter 12
b.
5 years
76. Which of the following provisions of the Internal Revenue Code can be used to reduce the amount of the income tax
expense arising from capital investment projects?
a.
deductions for individuals
b.
depreciation deduction
c.
minimum tax provision
d.
charitable contributions
77. The management of Indiana Corporation is considering the purchase of a new machine costing $400,000. The
company’s desired rate of return is 10%. The present value factors for $1 at compound interest of 10% for 1 through 5
years are 0.909, 0.826, 0.751, 0.683, and 0.621, respectively. In addition to the foregoing information, use the following
data in determining the acceptability of this investment:
Year
Operating
Income
Net Cash
Flow
1
$100,000
$180,000
2
60,000
120,000
3
30,000
100,000
4
10,000
90,000
5
10,000
90,000
The average rate of return for this investment is
a.
18%
b.
21%
c.
53%
d.
10%
The management of Wyoming Corporation is considering the purchase of a new machine costing $375,000. The
company’s desired rate of return is 6%. The present value factor for an annuity of $1 at interest of 6% for 5 years is 4.212.
In addition to the foregoing information, use the following data in determining the acceptability of this investment:
Year
Operating
Income
Net Cash
Flow
1
$18,750
$93,750
2
18,750
93,750
3
18,750
93,750
4
18,750
93,750
5
18,750
93,750
78. The net present value for this investment is
a.
$(118,145)
b.
$118,145
c.
$19,875
d.
$(19,875)
79. Heidi Company is considering the acquisition of a machine that costs $420,000. The machine is expected to have a
useful life of 6 years, a negligible residual value, an annual net cash inflow of $120,000, and annual operating income of
$83,721. The estimated cash payback period for the machine is
a.
3.5 years

Name:
Class:
Date:
chapter 12
c.
5.1 years
d.
4 years
80. Using the following partial table of present value of $1 at compound interest, determine the present value of $50,000
to be received 3 years hence with earnings at the rate of 12% a year.
Year
6%
10%
12%
1
0.943
0.909
0.893
2
0.890
0.826
0.797
3
0.840
0.751
0.712
4
0.792
0.683
0.636
a.
$37,550
b.
$31,800
c.
$35,600
d.
$39,850
Following is a table for the present value of $1 at compound interest:
Year
6%
10%
12%
1
0.943
0.909
0.893
2
0.890
0.826
0.797
3
0.840
0.751
0.712
4
0.792
0.683
0.636
5
0.747
0.621
0.567
Following is a table for the present value of an annuity of $1 at compound interest:
Year
6%
10%
12%
1
0.943
0.909
0.893
2
1.833
1.736
1.690
3
2.673
2.487
2.402
4
3.465
3.170
3.037
5
4.212
3.791
3.605
81. Using the tables provided, if an investment is made now for $23,500 that will generate a cash inflow of $8,000 a year
for the next 4 years, the net present value of the investment, assuming an earnings rate of 10%, is
a.
$23,500
b.
$16,050
c.
$25,360
d.
$1,860
Following is a table for the present value of $1 at compound interest:
Year
6%
10%
12%
1
0.943
0.909
0.893
2
0.890
0.826
0.797
3
0.840
0.751
0.712
4
0.792
0.683
0.636
5
0.747
0.621
0.567

Name:
Class:
Date:
chapter 12
Following is a table for the present value of an annuity of $1 at compound interest:
Year
6%
10%
12%
1
0.943
0.909
0.893
2
1.833
1.736
1.690
3
2.673
2.487
2.402
4
3.465
3.170
3.037
5
4.212
3.791
3.605
82. Using the tables provided, the present value of $6,000 to be received at the end of each of the next 4 years, assuming
an earnings rate of 10%, is
a.
$20,790
b.
$19,020
c.
$14,412
d.
$25,272
Following is a table for the present value of $1 at compound interest:
Year
6%
10%
12%
1
0.943
0.909
0.893
2
0.890
0.826
0.797
3
0.840
0.751
0.712
4
0.792
0.683
0.636
5
0.747
0.621
0.567
Following is a table for the present value of an annuity of $1 at compound interest:
Year
6%
10%
12%
1
0.943
0.909
0.893
2
1.833
1.736
1.690
3
2.673
2.487
2.402
4
3.465
3.170
3.037
5
4.212
3.791
3.605
83. Using the tables provided, the internal rate of return of an investment of $210,600 that would generate an annual cash
inflow of $50,000 for the next 5 years is
a.
6%
b.
10%
c.
12%
d.
14%
84. The management of Idaho Corporation is considering the purchase of a new machine costing $430,000. The
company’s desired rate of return is 10%. The present value factors for $1 at compound interest of 10% for 1 through 5
years are 0.909, 0.826, 0.751, 0.683, and 0.621, respectively. In addition to the foregoing information, use the following
data in determining the acceptability of this investment:
Year
Operating
Income
Net Cash
Flow
1
$100,000
$180,000

Name:
Class:
Date:
chapter 12
2
40,000
120,000
3
20,000
100,000
4
10,000
90,000
5
10,000
90,000
The net present value for this investment is
a.
$16,400
b.
$25,200
c.
$(99,600)
d.
$(126,800)
85. The rate of earnings is 6% and the cash to be received in 4 years is $20,000. The present value amount, using the
following partial table of present value of $1 at compound interest is
Year
6%
10%
12%
1
0.943
0.909
0.893
2
0.890
0.826
0.797
3
0.840
0.751
0.712
4
0.792
0.683
0.636
a.
$13,660
b.
$12,720
c.
$15,840
d.
$16,800
86. Which of the following is not an advantage of the average rate of return method?
a.
easy to use
b.
takes into consideration the time value of money
c.
includes the amount of income earned over the entire life of the proposal
d.
emphasizes accounting income
87. Hayden Company is considering the acquisition of a machine that costs $675,000. The machine is expected to have a
useful life of 6 years, a negligible residual value, an annual net cash inflow of $150,000, and annual operating income of
$87,500. The estimated cash payback period for the machine is
a.
3.5 years
b.
4 years
c.
4.5 years
d.
5 years
Following is a table for the present value of $1 at compound interest:
Year
6%
10%
12%
1
0.943
0.909
0.893
2
0.890
0.826
0.797
3
0.840
0.751
0.712
4
0.792
0.683
0.636
5
0.747
0.621
0.567
Following is a table for the present value of an annuity of $1 at compound interest:

Name:
Class:
Date:
chapter 12
Year
6%
10%
12%
1
0.943
0.909
0.893
2
1.833
1.736
1.690
3
2.673
2.487
2.402
4
3.465
3.170
3.037
5
4.212
3.791
3.605
88. Using the tables provided, the present value of $8,000 to be received 1 year from today, assuming an earnings rate of
12%, is
a.
$7,544
b.
$7,120
c.
$7,272
d.
$7,144
89. Which of the following are present value methods of analyzing capital investment proposals?
a.
internal rate of return and average rate of return
b.
average rate of return and net present value
c.
net present value and internal rate of return
d.
net present value and cash payback
The management of Wyoming Corporation is considering the purchase of a new machine costing $375,000. The
company’s desired rate of return is 6%. The present value factor for an annuity of $1 at interest of 6% for 5 years is 4.212.
In addition to the foregoing information, use the following data in determining the acceptability of this investment:
Year
Operating
Income
Net Cash
Flow
1
$18,750
$93,750
2
18,750
93,750
3
18,750
93,750
4
18,750
93,750
5
18,750
93,750
90. The present value index for this investment is
a.
1.00
b.
0.95
c.
1.25
d.
1.05
91. Which of the following are two methods of analyzing capital investment proposals that both ignore present value?
a.
internal rate of return and average rate of return
b.
net present value and average rate of return
c.
internal rate of return and net present value
d.
average rate of return and cash payback
Following is a table for the present value of $1 at compound interest:
Year
6%
10%
12%

Name:
Class:
Date:
chapter 12
1
0.943
0.909
0.893
2
0.890
0.826
0.797
3
0.840
0.751
0.712
4
0.792
0.683
0.636
5
0.747
0.621
0.567
Following is a table for the present value of an annuity of $1 at compound interest:
Year
6%
10%
12%
1
0.943
0.909
0.893
2
1.833
1.736
1.690
3
2.673
2.487
2.402
4
3.465
3.170
3.037
5
4.212
3.791
3.605
92. Using the tables provided, the present value of $25,000 (rounded to the nearest dollar) to be received 4 years from
today, assuming an earnings rate of 10%, is
a.
$19,800
b.
$17,075
c.
$79,250
d.
$15,525
The management of Wyoming Corporation is considering the purchase of a new machine costing $375,000. The
company’s desired rate of return is 6%. The present value factor for an annuity of $1 at interest of 6% for 5 years is 4.212.
In addition to the foregoing information, use the following data in determining the acceptability of this investment:
Year
Operating
Income
Net Cash
Flow
1
$18,750
$93,750
2
18,750
93,750
3
18,750
93,750
4
18,750
93,750
5
18,750
93,750
93. The average rate of return for this investment is
a.
5%
b.
10%
c.
25%
d.
15%
94. The production department is proposing the purchase of an automatic insertion machine. It has identified three
machines and has asked the accountant to analyze them to determine which one has the best average rate of return.
Machine A
Machine B
Machine C
Estimated average income
$ 40,000
$ 50,000
$ 75,000
Average investment
300,000
250,000
500,000
a.
Machine B
b.
Machine C
c.
Machines B and C have the same preferred average rate of return.

Name:
Class:
Date:
chapter 12
d.
Machine A
95. The expected average rate of return for a proposed investment of $650,000 in a fixed asset, with a useful life of 4
years, straight-line depreciation, no residual value, and an expected total net income of $240,000 for the 4 years, is
a.
13.9%
b.
36.9%
c.
18.5%
d.
9.25%
96. The production department is proposing the purchase of an automatic insertion machine. It has identified 3 machines,
each with an estimated life of 10 years. Which machine offers the best internal rate of return?
Machine A
Machine B
Machine C
Annual net cash flows
$ 50,000
$ 40,000
$ 75,000
Average investment
250,000
300,000
500,000
a.
Machine B only
b.
Machine C only
c.
Machines A and B
d.
Machine A only
97. Which of the following statements regarding the cash payback period is true?
a.
The longer the payback, the longer the estimated life of the asset will be.
b.
The longer the payback, the sooner the cash spent on the investment will be recovered.
c.
The shorter the payback, the possibility of obsolescence will be less likely.
d.
all of these choices
98. Using the following partial table of present value of $1 at compound interest, the present value of $15,000 to be
received 3 years hence with earnings at the rate of 6% a year is
Year
6%
10%
12%
1
0.943
0.909
0.893
2
0.890
0.826
0.797
3
0.840
0.751
0.712
4
0.792
0.683
0.636
a.
$12,600
b.
$11,880
c.
$13,350
d.
$11,265
99. The management of Arkansas Corporation is considering the purchase of a new machine costing $490,000. The
company’s desired rate of return is 10%. The present value factors for $1 at compound interest of 10% for 1 through 5
years are 0.909, 0.826, 0.751, 0.683, and 0.621, respectively. In addition to the foregoing information, use the following
data in determining the acceptability of this investment:
Year
Operating
Income
Net Cash
Flow
1
$100,000
$180,000

Name:
Class:
Date:
chapter 12
2
40,000
120,000
3
40,000
100,000
4
10,000
90,000
5
10,000
120,000
The net present value for this investment is
a.
$36,400
b.
$55,200
c.
$(16,170)
d.
$(126,800)
100. The management of Charlton Corporation is considering the purchase of a new machine costing $380,000. The
company’s desired rate of return is 6%. The present value factor for an annuity of $1 at interest of 6% for 5 years is 4.212.
In addition to the foregoing information, use the following data in determining the acceptability of this investment:
Year
Operating
Income
Net Cash
Flow
1
$20,000
$95,000
2
20,000
95,000
3
20,000
95,000
4
20,000
95,000
5
20,000
95,000
The cash payback period for this investment is
a.
4 years
b.
5 years
c.
19 years
d.
3.3 years
101. All of the following qualitative considerations may influence capital investment analysis except the investment
proposal’s impact on
a.
the time value of money
b.
employee morale
c.
product quality
d.
manufacturing flexibility
102. Which of the following is not considered a complicating factor in capital investment decisions?
a.
income tax
b.
lease versus purchasing options
c.
equal proposal lives
d.
qualitative factors
103. Which of the following methods for evaluating capital investment proposals reduces the expected future net cash
flows originating from the proposals to their present values and computes a net present value?
a.
net present value
b.
average rate of return
c.
internal rate of return
d.
cash payback

Name:
Class:
Date:
chapter 12
104. Tennessee Corporation is analyzing a capital expenditure that will involve a cash outlay of $109,332. Estimated cash
flows are expected to be $36,000 annually for 4 years. The present value factors for an annuity of $1 for 4 years at interest
of 10%, 12%, 14%, and 15% are 3.170, 3.037, 2.914, and 2.855, respectively. The internal rate of return for this
investment is
a.
9%
b.
10%
c.
12%
d.
3%
105. When several alternative investment proposals of the same amount are being considered, the one with the largest net
present value is the most desirable. If the alternative proposals involve different amounts of investment, it is useful to
prepare a relative ranking of the proposals by using a(n) _____ index.
a.
average rate of return
b.
consumer price
c.
present value
d.
price-level
106. Motel Corporation is analyzing a capital expenditure that will involve a cash outlay of $208,240. Estimated cash
flows are expected to be $40,000 annually for 7 years. The present value factors for an annuity of $1 for 7 years at interest
of 6%, 8%, 10%, and 12% are 5.582, 5.206, 4.868, and 4.564, respectively. The internal rate of return for this investment
is
a.
10%
b.
6%
c.
12%
d.
8%
107. All of the following are factors that may complicate capital investment analysis except
a.
possible leasing alternatives
b.
changes in price levels
c.
sunk costs
d.
federal income tax ramifications
The management of Nebraska Corporation is considering the purchase of a new machine costing $490,000. The
company’s desired rate of return is 10%. The present value factors for $1 at compound interest of 10% for 1 through 5
years are 0.909, 0.826, 0.751, 0.683, and 0.621, respectively. In addition to the foregoing information, use the following
data in determining the acceptability:
Year
Operating
Income
Net Cash
Flow
1
$100,000
$180,000
2
40,000
120,000
3
40,000
100,000
4
10,000
90,000
5
10,000
120,000
108. The cash payback period for this investment is

Name:
Class:
Date:
chapter 12
a.
5 years
b.
4 years
c.
2 years
d.
3 years
109. The expected average rate of return for a proposed investment of $4,800,000 in a fixed asset, using straight-line
depreciation, with a useful life of 20 years, no residual value, and an expected total net income of $10,560,000 over the 20
years, is
a.
24%
b.
22%
c.
45%
d.
10%
110. In capital rationing, alternative proposals that survive initial and secondary screenings are normally evaluated in
terms of
a.
present value
b.
qualitative factors
c.
maximum cost
d.
net cash flow
111. The amount of the estimated average annual income for a proposed investment of $90,000 in a fixed asset, giving
effect to depreciation (straight-line method), with a useful life of 4 years, no residual value, and an expected total income
yield of $25,300, is
a.
$12,650
b.
$25,300
c.
$6,325
d.
$45,000
112. Which of the following can be used to place capital investment proposals involving different amounts of investment
on a comparable basis for purposes of net present value analysis?
a.
price-level index
b.
future value index
c.
rate of investment index
d.
present value index
Following is a table for the present value of $1 at compound interest:
Year
6%
10%
12%
1
0.943
0.909
0.893
2
0.890
0.826
0.797
3
0.840
0.751
0.712
4
0.792
0.683
0.636
5
0.747
0.621
0.567
Following is a table for the present value of an annuity of $1 at compound interest:
Year
6%
10%
12%

Name:
Class:
Date:
chapter 12
1
0.943
0.909
0.893
2
1.833
1.736
1.690
3
2.673
2.487
2.402
4
3.465
3.170
3.037
5
4.212
3.791
3.605
113. Using the tables provided, if an investment is made now for $20,000 that will generate a cash inflow of $7,000 a year
for the next 4 years, the present value of the investment cash inflows, assuming an earnings rate of 12%, is
a.
$20,352
b.
$3,969
c.
$22,190
d.
$21,259
114. Assume in analyzing alternative proposals that Proposal F has a useful life of 6 years and Proposal J has a useful life
of 9 years. What is one widely used method to make the net present values of the proposals comparable?
a.
Ignore the fact that Proposal F has a useful life of 6 years and treat it as if it has a useful life of 9 years.
b.
Adjust the life of Proposal J to a time period that is equal to that of Proposal F by estimating a residual value at
the end of year 6.
c.
Ignore the useful lives of 6 and 9 years and find an average (7 1/2 years).
d.
Ignore the useful lives of 6 and 9 years and compute the average rate of return.
115. The production department is proposing the purchase of an automatic insertion machine. It has identified 3 machines
and has asked the accountant to analyze them to determine which of the proposals (if any) meet or exceed the company’s
policy of a minimum desired rate of return of 10% using the net present value method. Each of the assets has an estimated
useful life of 10 years. The accountant has identified the following data:
Machine A
Machine B
Machine C
Present value of future cash flows
computed using 10% rate of return
$305,000
$295,000
$300,000
Amount of initial investment
300,000
300,000
300,000
Which of the investments are acceptable?
a.
Machines A and C
b.
Machines B and C
c.
Machine B only
d.
Machine A only
116. In capital rationing, alternative proposals are initially screened for minimum standards using which of the following
two evaluation methods?
a.
cash payback method and average rate of return method
b.
average rate of return method and net present value method
c.
net present value method and cash payback method
d.
internal rate of return method and net present value method
117. An analysis of a proposal by the net present value method indicated that the present value of future cash inflows
exceeded the amount to be invested. Which of the following statements best describes the results of this analysis?
a.
The proposal is desirable, and the rate of return expected from the proposal exceeds the minimum rate used for

Name:
Class:
Date:
chapter 12
the analysis.
b.
The proposal is desirable, and the rate of return expected from the proposal is less than the minimum rate used
for the analysis.
c.
The proposal is undesirable, and the rate of return expected from the proposal is less than the minimum rate
used for the analysis.
d.
The proposal is undesirable, and the rate of return expected from the proposal exceeds the minimum rate used
for the analysis.
118. By converting dollars to be received in the future into current dollars, the present value methods take into
consideration that money
a.
has an international rate of exchange
b.
is the language of business
c.
is the measure of assets, liabilities, and stockholders’ equity on financial statements
d.
has a time value
119. Which of the following is a method of analyzing capital investment proposals that ignores present value?
a.
internal rate of return
b.
net present value
c.
discounted cash flow
d.
average rate of return
120. The primary advantages of the average rate of return method are its ease of computation and the fact that
a.
it is especially useful to managers whose primary concern is liquidity
b.
there is less possibility of loss from changes in economic conditions and obsolescence when the commitment
is short term
c.
it emphasizes the amount of income earned over the life of the proposal
d.
rankings of proposals are necessary
121. The expected average rate of return for a proposed investment of $6,000,000 in a fixed asset, using straight-line
depreciation, a useful life of 20 years, no residual value, and an expected total income of $12,000,000 over the 20 years, is
a.
20%
b.
10%
c.
40%
d.
5%
122. A series of equal cash flows at fixed intervals is termed a(n)
a.
present value index
b.
price-level index
c.
net cash flow
d.
annuity
123. The management of California Corporation is considering the purchase of a new machine costing $400,000. The
company’s desired rate of return is 10%. The present value factors for $1 at compound interest of 10% for 1 through 5
years are 0.909, 0.826, 0.751, 0.683, and 0.621, respectively. In addition to the foregoing information, use the following
data in determining the acceptability of this investment:

Name:
Class:
Date:
chapter 12
Year
Operating
Income
Net Cash
Flow
1
$100,000
$180,000
2
40,000
120,000
3
20,000
100,000
4
10,000
90,000
5
10,000
90,000
The present value index for this investment is
a.
0.88
b.
1.45
c.
1.14
d.
0.70
124. The rate of earnings is 12% and the cash to be received in 2 years is $10,000. Determine the present value amount,
using the following partial table of present value of $1 at compound interest.
Year
6%
10%
12%
1
0.943
0.909
0.893
2
0.890
0.826
0.797
3
0.840
0.751
0.712
4
0.792
0.683
0.636
a.
$8,930
b.
$7,120
c.
$7,970
d.
$8,260
Following is a table for the present value of $1 at compound interest:
Year
6%
10%
12%
1
0.943
0.909
0.893
2
0.890
0.826
0.797
3
0.840
0.751
0.712
4
0.792
0.683
0.636
5
0.747
0.621
0.567
Following is a table for the present value of an annuity of $1 at compound interest:
Year
6%
10%
12%
1
0.943
0.909
0.893
2
1.833
1.736
1.690
3
2.673
2.487
2.402
4
3.465
3.170
3.037
5
4.212
3.791
3.605
125. Using the tables provided, the present value of $30,000 to be received 3 years from today, assuming an earnings rate
of 6%, is
a.
$25,200
b.
$26,700

Name:
Class:
Date:
chapter 12
b.
16%
c.
$23,760
d.
$80,190
126. The expected average rate of return for a proposed investment of $800,000 in a fixed asset with a useful life of 4
years, straight-line depreciation, no residual value, and an expected total income of $360,000 for the 4 years is
a.
45%
b.
22.5%
c.
11.3%
d.
5.5%
127. The present value index is computed using which of the following formulas?
a.
Amount to Be Invested ÷ Average Rate of Return
b.
Total Present Value of Net Cash Flow ÷ Amount to Be Invested
c.
Total Present Value of Net Cash Flow ÷ Average Rate of Return
d.
Amount to Be Invested ÷ Total Present Value of Net Cash Flow
128. A company is contemplating investing in a new piece of manufacturing machinery. The amount to be invested is
$100,000. The present value of the future cash flows at the company’s desired rate of return is $105,000. The IRR on the
project is 12%. Which of the following statements is true?
a.
The project should not be accepted because the net present value is negative.
b.
The desired rate of return used to compute the present value of the future cash flows is less than 12%.
c.
The desired rate of return used to compute the present value of the future cash flows is more than 12%.
d.
The desired rate of return used to compute the present value of the future cash flows is equal to 12%.
129. The process by which management allocates available investment funds among competing investment proposals is
called
a.
investment capital
b.
investment rationing
c.
cost-volume-profit analysis
d.
capital rationing
The management of Nebraska Corporation is considering the purchase of a new machine costing $490,000. The
company’s desired rate of return is 10%. The present value factors for $1 at compound interest of 10% for 1 through 5
years are 0.909, 0.826, 0.751, 0.683, and 0.621, respectively. In addition to the foregoing information, use the following
data in determining the acceptability:
Year
Operating
Income
Net Cash
Flow
1
$100,000
$180,000
2
40,000
120,000
3
40,000
100,000
4
10,000
90,000
5
10,000
120,000
130. The average rate of return for this investment is
a.
18%

Name:
Class:
Date:
chapter 12
c.
58%
d.
10%
131. A company is contemplating investing in a new piece of manufacturing machinery. The amount to be invested is
$100,000. The present value of the future cash flows at the company’s desired rate of return is $100,000. The IRR on the
project is 12%. Which of the following statements is true?
a.
The project should not be accepted because the net present value is negative.
b.
The desired rate of return used to compute the present value of the future cash flows is less than 12%.
c.
The desired rate of return used to compute the present value of the future cash flows is more than 12%.
d.
The desired rate of return used to compute the present value of the future cash flows is equal to 12%.
132. Two managerial accounting tools useful in considering the uncertainty of estimates are
a.
sensitivity analysis and expected value analysis
b.
sensitivity analysis and capital rationing
c.
net present value method and expected value analysis
d.
capital rationing and expected value analysis
133. Which of the following is a present value method of analyzing capital investment proposals?
a.
average rate of return
b.
cash payback method
c.
accounting rate of return
d.
net present value
Following is a table for the present value of $1 at compound interest:
Year
6%
10%
12%
1
0.943
0.909
0.893
2
0.890
0.826
0.797
3
0.840
0.751
0.712
4
0.792
0.683
0.636
5
0.747
0.621
0.567
Following is a table for the present value of an annuity of $1 at compound interest:
Year
6%
10%
12%
1
0.943
0.909
0.893
2
1.833
1.736
1.690
3
2.673
2.487
2.402
4
3.465
3.170
3.037
5
4.212
3.791
3.605
134. Using the tables provided, the internal rate of return of an investment of $227,460 that would generate an annual cash
inflow of $60,000 for the next 5 years is
a.
6%
b.
10%
c.
12%
d.
cannot be determined from the data given

Name:
Class:
Date:
chapter 12
135. All of the following qualitative considerations may influence capital investment analysis except the investment
proposal’s impact on
a.
manufacturing productivity
b.
manufacturing sunk cost
c.
manufacturing flexibility
d.
market opportunities
136. T-Bone Company is contemplating investing in a new piece of manufacturing machinery. The amount to be invested
is $150,000. The present value of the future cash flows is $141,000. Should the company invest in this project?
a.
yes, because net present value is $9,000
b.
yes, because net present value is $(9,000)
c.
no, because net present value is $9,000
d.
no, because net present value is $(9,000)
137. An anticipated purchase of equipment for $520,000, with a useful life of 8 years and no residual value, is expected to
yield the following annual incomes and net cash flows:
Year
Income
Net Cash Flow
1
$60,000
$120,000
2
50,000
110,000
3
50,000
110,000
4
40,000
100,000
5
40,000
80,000
6
40,000
80,000
7
40,000
60,000
8
40,000
60,000
The cash payback period for this equipment is
a.
5 years
b.
4 years
c.
6 years
d.
3 years
138. Xander Inc. has prepared the following sensitivity analysis:
Estimated Annual Net Cash Flow
$ 500,000
$ 600,000
$ 700,000
Present value of annual net cash flows (× 4.487)
$ 2,243,500
$ 2,692,200
$ 3,140,900
Present value of residual value
50,000
50,000
50,000
Total present value
$ 2,293,500
$ 2,742,200
$ 3,190,900
Amount to be invested
(3,000,000)
(3,000,000)
(3,000,000)
Net present value
$ (706,500)
$ (257,800)
$ 190,900
In addition, it has assigned the following likelihoods to the three possible annual net cash flows: $500,000, 70%;
$600,000, 20%; and $700,000, 10%. Based on an expected value analysis, which of the following statements is accurate?
a.
The expected value of the annual net cash flow is $540,000, and the project should be rejected.
b.
The expected value of the annual net cash flow is $540,000, and the project should be accepted.

Name:
Class:
Date:
chapter 12
c.
The expected value of the annual net cash flow is $660,000, and the project should be rejected.
d.
The expected value of the annual net cash flow is $660,000, and the project should be accepted.
139. An anticipated purchase of equipment for $490,000 with a useful life of 8 years and no residual value is expected to
yield the following annual incomes and net cash flows:
Year
Income
Net Cash Flow
1
$60,000
$110,000
2
50,000
100,000
3
50,000
100,000
4
40,000
90,000
5
40,000
90,000
6
40,000
90,000
7
40,000
90,000
8
40,000
90,000
The cash payback period for the equipment is
a.
5 years
b.
4 years
c.
6 years
d.
3 years
The management of River Corporation is considering the purchase of a new machine costing $380,000. The company’s
desired rate of return is 6%. The present value factor for an annuity of $1 at interest of 6% for 5 years is 4.212. In addition
to the foregoing information, use the following data in determining the acceptability of this investment:
Year
Operating
Income
Net Cash
Flow
1
$20,000
$95,000
2
20,000
95,000
3
20,000
95,000
4
20,000
95,000
5
20,000
95,000
140. The average rate of return for this investment is
a.
5%
b.
10.5%
c.
25%
d.
15%
141. The amount of the average investment for a proposed investment of $120,000 in a fixed asset with a useful life of 4
years, straight-line depreciation, no residual value, and an expected total income of $21,600 for the 4 years is
a.
$30,000
b.
$21,600
c.
$5,400
d.
$60,000
142. The process by which management plans, evaluates, and controls investments in fixed assets is called _____ analysis.

Name:
Class:
Date:
chapter 12
a.
absorption cost
b.
variable cost
c.
capital investment
d.
cost-volume-profit
143. Periods in time that experience increasing price levels are known as periods of
a.
inflation
b.
recession
c.
depression
d.
deflation
144. Which of the following methods of evaluating capital investment proposals uses present value concepts to compute
the rate of return from the net cash flows?
a.
internal rate of return method
b.
cash payback method
c.
net present value method
d.
average rate of return method
145. Which of the following is an advantage of the cash payback method?
a.
easy to use
b.
takes into consideration the time value of money
c.
includes the cash flow over the entire life of the proposal
d.
emphasizes accounting income
Match each of the methods that follow with the correct category (a–b).
a.
Methods that do not use present values
b.
Methods that use present values
146. Cash payback method
147. Internal rate of return method
148. Average rate of return method
149. Net present value method
Match each phrase that follows with the term (a–e) it describes.
a.
Capital investment analysis
b.
Time value of money concept
c.
Net present value method
d.
Average rate of return
e.
Cash payback period
150. Recognizes that a dollar today is worth more than a dollar tomorrow

Name:
Class:
Date:
chapter 12
151. Often referred to as the discounted cash flow method
152. Also referred to as capital budgeting
153. Average income as a percentage of average investment
154. Can be determined by initial cost divided by annual net cash inflow of an investment
Match each phrase that follows with the term (a–f) it describes.
a.
Capital rationing
b.
Annuity
c.
Capital investment analysis
d.
Internal rate of return method
e.
Payback period
f.
Accounting rate of return
155. A measure of the average annual income as a percent of the average investment
156. The process by which management allocates funds among various capital investment proposals
157. A stream of equal cash flow amounts
158. A formal means of analyzing long-range investment decisions
159. Uses present value concepts to compute the rate of return on an investment from a capital investment proposal based
on its expected net cash flows
160. The length of time it will take to recover through cash inflows the dollars of a capital outlay
161. A $400,000 capital investment proposal has an estimated life of 4 years and no residual value. The estimated net cash
flows are as follows:
Year
Net Cash Flow
1
$200,000
2
150,000
3
90,000
4
80,000
The minimum desired rate of return for net present value analysis is 12%. The factors for the present value of $1 at
compound interest of 12% for 1, 2, 3, and 4 years are 0.893, 0.797, 0.712, and 0.636, respectively.
Determine the net present value.
162. Determine the average rate of return for a project that is estimated to yield total income of $600,000 over 4 years,
costs $840,000, and has an $80,000 residual value. Round percentage answer to one decimal place.
163. Vanessa Company is evaluating a project requiring a capital expenditure of $480,000. The project has an estimated
life of 4 years and no salvage value. The estimated net income and net cash flow from the project are as follows:

Name:
Class:
Date:
chapter 12
Year
Net Income
Net Cash Flow
1
$ 90,000
$210,000
2
80,000
200,000
3
40,000
160,000
4
30,000
150,000
$240,000
$720,000
The company’s minimum desired rate of return for net present value analysis is 15%. The factors for the present value of
$1 at compound interest of 15% for 1, 2, 3, and 4 years are 0.870, 0.756, 0.658, and 0.572, respectively.
Determine (a) the average rate of return on investment and (b) the net present value for the project.
164. A project is estimated to cost $273,840 and provide annual net cash inflows of $60,000 for 7 years. Determine the
internal rate of return for this project, using the following present value of an annuity table.
Year
6%
10%
12%
1
0.943
0.909
0.893
2
1.833
1.736
1.690
3
2.673
2.487
2.402
4
3.465
3.170
3.037
5
4.212
3.791
3.605
6
4.917
4.355
4.111
7
5.582
4.868
4.564
8
6.210
5.335
4.968
9
6.802
5.759
5.328
10
7.360
6.145
5.650
165. Project A requires an original investment of $50,000. The project will yield cash flows of $15,000 per year for 7
years. Project B has a computed net present value of $13,500 over a 4-year life. Project A could be sold at the end of 4
years for $25,000. (a) Using the present value tables that follow, determine the net present value of Project A over a 4-
year life with salvage value assuming a minimum rate of return of 12%. (b) Which project provides the greatest net
present value?
Following is a table for the present value of $1 at compound interest:
Year
6%
10%
12%
1
0.943
0.909
0.893
2
0.890
0.826
0.797
3
0.840
0.751
0.712
4
0.792
0.683
0.636
5
0.747
0.621
0.567
Following is a table for the present value of an annuity of $1 at compound interest:
Year
6%
10%
12%
1
0.943
0.909
0.893
2
1.833
1.736
1.690
3
2.673
2.487
2.402
4
3.465
3.170
3.037
5
4.212
3.791
3.605
166. Proposals A and B each cost $600,000 and have 5-year lives. Proposal A is expected to provide equal annual net cash
flows of $159,000, while the net cash flows for Proposal B are as follows:

Name:
Class:
Date:
chapter 12
Year 1
$150,000
Year 2
140,000
Year 3
110,000
Year 4
150,000
Year 5
50,000
$600,000
Determine the cash payback period for each proposal. Round answers to two decimal places.
167. A 6-year project is estimated to cost $350,000 and have no residual value. If the straight-line depreciation method is
used and the average rate of return is 12%, determine the average annual income.
168. A project has estimated annual net cash flows of $80,000. It is estimated to cost $600,000. Determine the cash
payback period.
169. Identify four capital investment evaluation methods discussed in the chapter and discuss the strengths and
weaknesses of each method.
170. An investment of $185,575 is expected to generate returns of $65,000 per year for each of the next 4 years. What is
the investment’s internal rate of return?
Following is a table for the present value of $1 at compound interest:
Year
6%
10%
12%
15%
1
0.943
0.909
0.893
0.870
2
0.890
0.826
0.797
0.756
3
0.840
0.751
0.712
0.658
4
0.792
0.683
0.636
0.572
5
0.747
0.621
0.567
0.497
Following is a table for the present value of an annuity of $1 at compound interest:
Year
6%
10%
12%
15%
1
0.943
0.909
0.893
0.870
2
1.833
1.736
1.690
1.626
3
2.673
2.487
2.402
2.283
4
3.465
3.170
3.037
2.855
5
4.212
3.791
3.605
3.353
171. Proposals M and N each cost $550,000, have 6-year lives, and have expected total cash flows of $750,000. Proposal
M is expected to provide equal annual net cash flows of $125,000, while the net cash flows for Proposal N are as follows:
Year 1
$250,000
Year 2
200,000
Year 3
150,000
Year 4
75,000
Year 5
50,000
Year 6
25,000
$750,000
Determine the cash payback period for each proposal.

Name:
Class:
Date:
chapter 12
172. Jimmy Co. is considering a 12-year project that is estimated to cost $1,050,000 and has no residual value. Jimmy Co.
seeks to earn an average rate of return of 18% on all capital projects. Determine the necessary average annual income
(using straight-line depreciation) that must be achieved on this project for it to be acceptable to Jimmy Co.
173. Norton Company is considering a project that will require an initial investment of $750,000 and will return $200,000
each year for 5 years.
a. If taxes are ignored and the required rate of return is 9%, what is the project’s net present value?
b. Based on this analysis, should Norton Company proceed with the project?
Following is a table for the present value of $1 at compound interest:
Year
9%
Year
9%
1
0.917
6
0.596
2
0.842
7
0.547
3
0.772
8
0.502
4
0.708
9
0.460
5
0.650
10
0.422
Following is a table for the present value of an annuity of $1 at compound interest:
Year
9%
Year
9%
1
0.917
6
4.486
2
1.759
7
5.033
3
2.531
8
5.535
4
3.240
9
5.995
5
3.890
10
6.418
174. A project is estimated to cost $248,400 and provide annual net cash inflows of $50,000 for 8 years. Determine the
internal rate of return for this project, using the following present value of an annuity table.
Year
6%
10%
12%
1
0.943
0.909
0.893
2
1.833
1.736
1.690
3
2.673
2.487
2.402
4
3.465
3.170
3.037
5
4.212
3.791
3.605
6
4.917
4.355
4.111
7
5.582
4.868
4.564
8
6.210
5.335
4.968
9
6.802
5.759
5.328
10
7.360
6.145
5.650
175. A project has estimated annual cash flows of $90,000 for 3 years and is estimated to cost $250,000. Assume a
minimum acceptable rate of return of 10%. Using the following tables, determine (a) the net present value of the project
and (b) the present value index, rounded to two decimal places.
Following is a table for the present value of $1 at compound interest:
Year
6%
10%
12%
1
0.943
0.909
0.893
2
0.890
0.826
0.797
3
0.840
0.751
0.712

Name:
Class:
Date:
chapter 12
4
0.792
0.683
0.636
5
0.747
0.621
0.567
Following is a table for the present value of an annuity of $1 at compound interest:
Year
6%
10%
12%
1
0.943
0.909
0.893
2
1.833
1.736
1.690
3
2.673
2.487
2.402
4
3.465
3.170
3.037
5
4.212
3.791
3.605
176. The net present value has been computed for Proposals P and Q. Relevant data are as follows:
Proposal P
Proposal Q
Amount to be invested
$245,000
$460,000
Total present value of net cash flow
296,500
425,000
Determine the present value index for each proposal. Round your answers to two decimal places.
177. Tipper Co. is considering a 10-year project that is estimated to cost $700,000 and has no residual value. Tipper seeks
to earn an average rate of return of 15% on all capital projects. Determine the necessary average annual income (using
straight-line depreciation) that must be achieved on this project for it to be acceptable to Tipper Co.
178. An 8-year project is estimated to cost $400,000 and have no residual value. If the straight-line depreciation method is
used and the average rate of return is 5%, determine the average annual income.
179. BAM Co. is evaluating a project requiring a capital expenditure of $806,250. The project has an estimated life of 4
years and no salvage value. The estimated net income and net cash flow from the project are as follows:
Year
Net Income
Net Cash Flow
1
$ 75,000
$285,000
2
102,000
290,000
3
109,500
190,000
4
36,000
125,000
$322,500
$890,000
The company’s minimum desired rate of return is 12%. The factors for the present value of $1 at compound interest of
12% for 1, 2, 3, and 4 years are 0.893, 0.797, 0.712, and 0.636, respectively.
Determine (a) the average rate of return on investment and (b) the net present value.
180. Sunrise Inc. is considering a capital investment proposal that costs $227,500 and has an estimated life of 4 years and
no residual value. The estimated net cash flows are as follows:
Year
Net Cash Flow
1
$97,500
2
80,000
3
60,000
4
40,000
The minimum desired rate of return for net present value analysis is 10%. The factors for the present value of $1 at the
compound interest rate of 10% for 1, 2, 3, and 4 years are 0.909, 0.826, 0.751, and 0.683, respectively. Determine the net
present value. Round interim answers to the nearest dollar.

Name:
Class:
Date:
chapter 12
181. Dickerson Co. is evaluating a project requiring a capital expenditure of $810,000. The project has an estimated life of
4 years and no salvage value. The estimated net income and net cash flow from the project are as follows:
Year
Operating Income
Net Cash Flow
1
$ 75,000
$285,000
2
100,000
290,000
3
109,000
190,000
4
36,000
125,000
$320,000
$890,000
The company’s minimum desired rate of return is 12%. The present value of $1 at compound interest of 12% for 1, 2, 3,
and 4 years is 0.893, 0.797, 0.712, and 0.636, respectively.
Determine the average rate of return on investment.
182. A project has estimated annual net cash flows of $60,000. It is estimated to cost $240,000. Determine the cash
payback period.
183. What is the present value of $8,000 to be received at the end of 6 years if the required rate of return is 15%?
Following is a table for the present value of $1 at compound interest:
Year
15%
Year
15%
1
0.870
6
0.432
2
0.756
7
0.376
3
0.658
8
0.327
4
0.572
9
0.284
5
0.497
10
0.247
Following is a table for the present value of an annuity of $1 at compound interest:
Year
15%
Year
15%
1
0.870
6
3.785
2
1.626
7
4.160
3
2.283
8
4.487
4
2.855
9
4.772
5
3.353
10
5.019
184. Determine the average rate of return for a project that is estimated to yield total income of $250,000 over 4 years,
costs $480,000, and has a $20,000 residual value.
185. Proposals L and K each cost $600,000, have 6-year lives, and have expected total cash inflows of $720,000. Proposal
L is expected to provide equal annual net cash flows of $170,000, while the net cash flows for Proposal K are as follows:
Year 1
$250,000
Year 2
200,000
Year 3
100,000
Year 4
50,000
Year 5
100,000
Year 6
20,000
$720,000

Name:
Class:
Date:
chapter 12
Determine the cash payback period for each proposal. Round your answers to two decimal places.
186. A project has estimated annual cash flows of $95,000 for 4 years and is estimated to cost $260,000. Assume a
minimum acceptable rate of return of 10%. Using the following tables, determine (a) the net present value of the project
and (b) the present value index, rounded to two decimal places.
Following is a table for the present value of $1 at compound interest:
Year
6%
10%
12%
1
0.943
0.909
0.893
2
0.890
0.826
0.797
3
0.840
0.751
0.712
4
0.792
0.683
0.636
5
0.747
0.621
0.567
Following is a table for the present value of an annuity of $1 at compound interest:
Year
6%
10%
12%
1
0.943
0.909
0.893
2
1.833
1.736
1.690
3
2.673
2.487
2.402
4
3.465
3.170
3.037
5
4.212
3.791
3.605
187. Briefly describe the time value of money. Why is the time value of money important in capital investment analysis?
188. A $550,000 capital investment proposal has an estimated life of 4 years and no residual value. The estimated net cash
flows are as follows:
Year
Net Cash Flow
1
$300,000
2
280,000
3
208,000
4
180,000
The minimum desired rate of return for net present value analysis is 12%. The factors for the present value of $1 at
compound interest of 12% for 1, 2, 3, and 4 years are 0.893, 0.797, 0.712, and 0.636, respectively.
Determine the net present value.
189. What is capital investment analysis? Why are capital investment analysis decisions often difficult and risky?
190. Project A requires an original investment of $65,000. The project will yield cash flows of $15,000 per year for 7
years. Project B has a computed net present value of $5,500 over a 5-year life. Project A could be sold at the end of 5
years for a price of $30,000. (a) Using the present value tables that follow, determine the net present value of Project A
over a 5-year life with salvage value assuming a minimum rate of return of 12%. (b) Which project provides the greatest
net present value?
Following is a table for the present value of $1 at compound interest:
Year
6%
10%
12%
1
0.943
0.909
0.893
2
0.890
0.826
0.797

Name:
Class:
Date:
chapter 12
3
0.840
0.751
0.712
4
0.792
0.683
0.636
5
0.747
0.621
0.567
Following is a table for the present value of an annuity of $1 at compound interest:
Year
6%
10%
12%
1
0.943
0.909
0.893
2
1.833
1.736
1.690
3
2.673
2.487
2.402
4
3.465
3.170
3.037
5
4.212
3.791
3.605
191. Dickerson Co. is evaluating a project requiring a capital expenditure of $810,000. The project has an estimated life of
4 years and no salvage value. The estimated net income and net cash flow from the project are as follows:
Year
Net Income
Net Cash Flow
1
$ 75,000
$280,000
2
100,000
300,000
3
109,000
200,000
4
36,000
120,000
$320,000
$900,000
The company’s minimum desired rate of return is 12%. The factors for the present value of $1 at compound interest of
12% for 1, 2, 3, and 4 years are 0.893, 0.797, 0.712, and 0.636, respectively.
Determine the net present value.

Name:
Class:
Date:
chapter 12
Answer Key

Name:
Class:
Date:
chapter 12

Name:
Class:
Date:
chapter 12

Name:
Class:
Date:
chapter 12

Name:
Class:
Date:
chapter 12

Name:
Class:
Date:
chapter 12
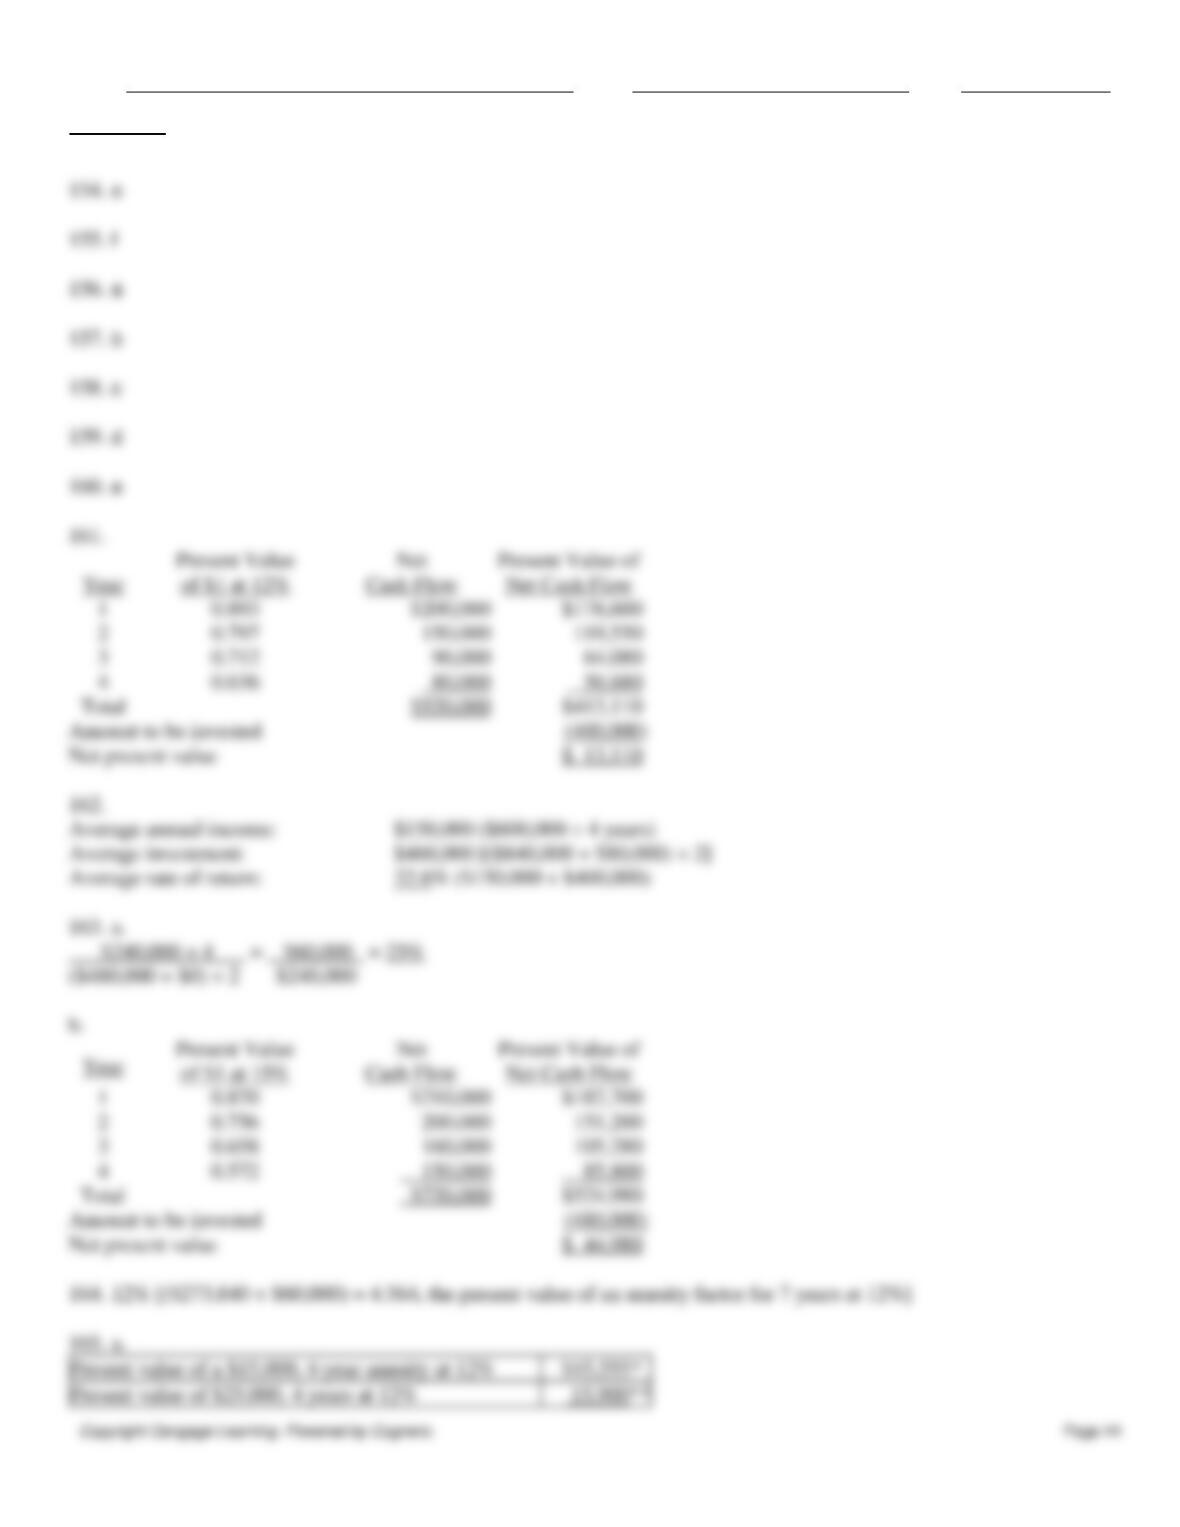
Name:
Class:
Date:
chapter 12
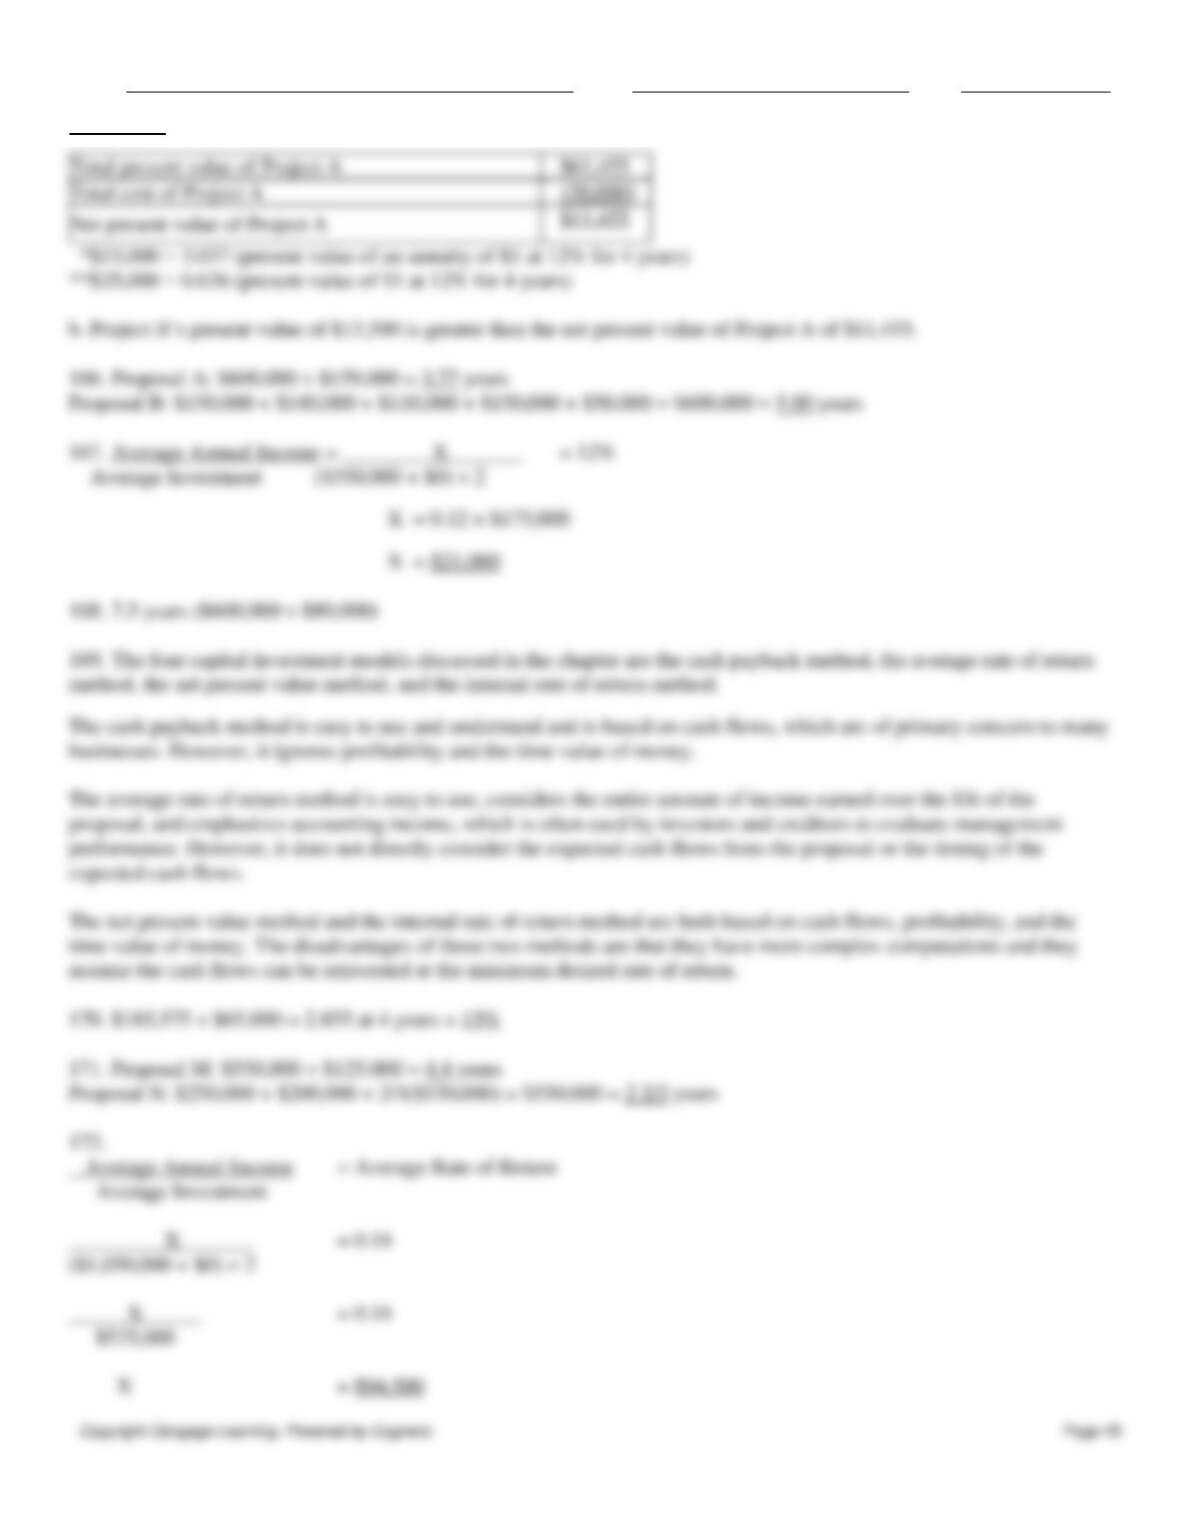
Name:
Class:
Date:
chapter 12
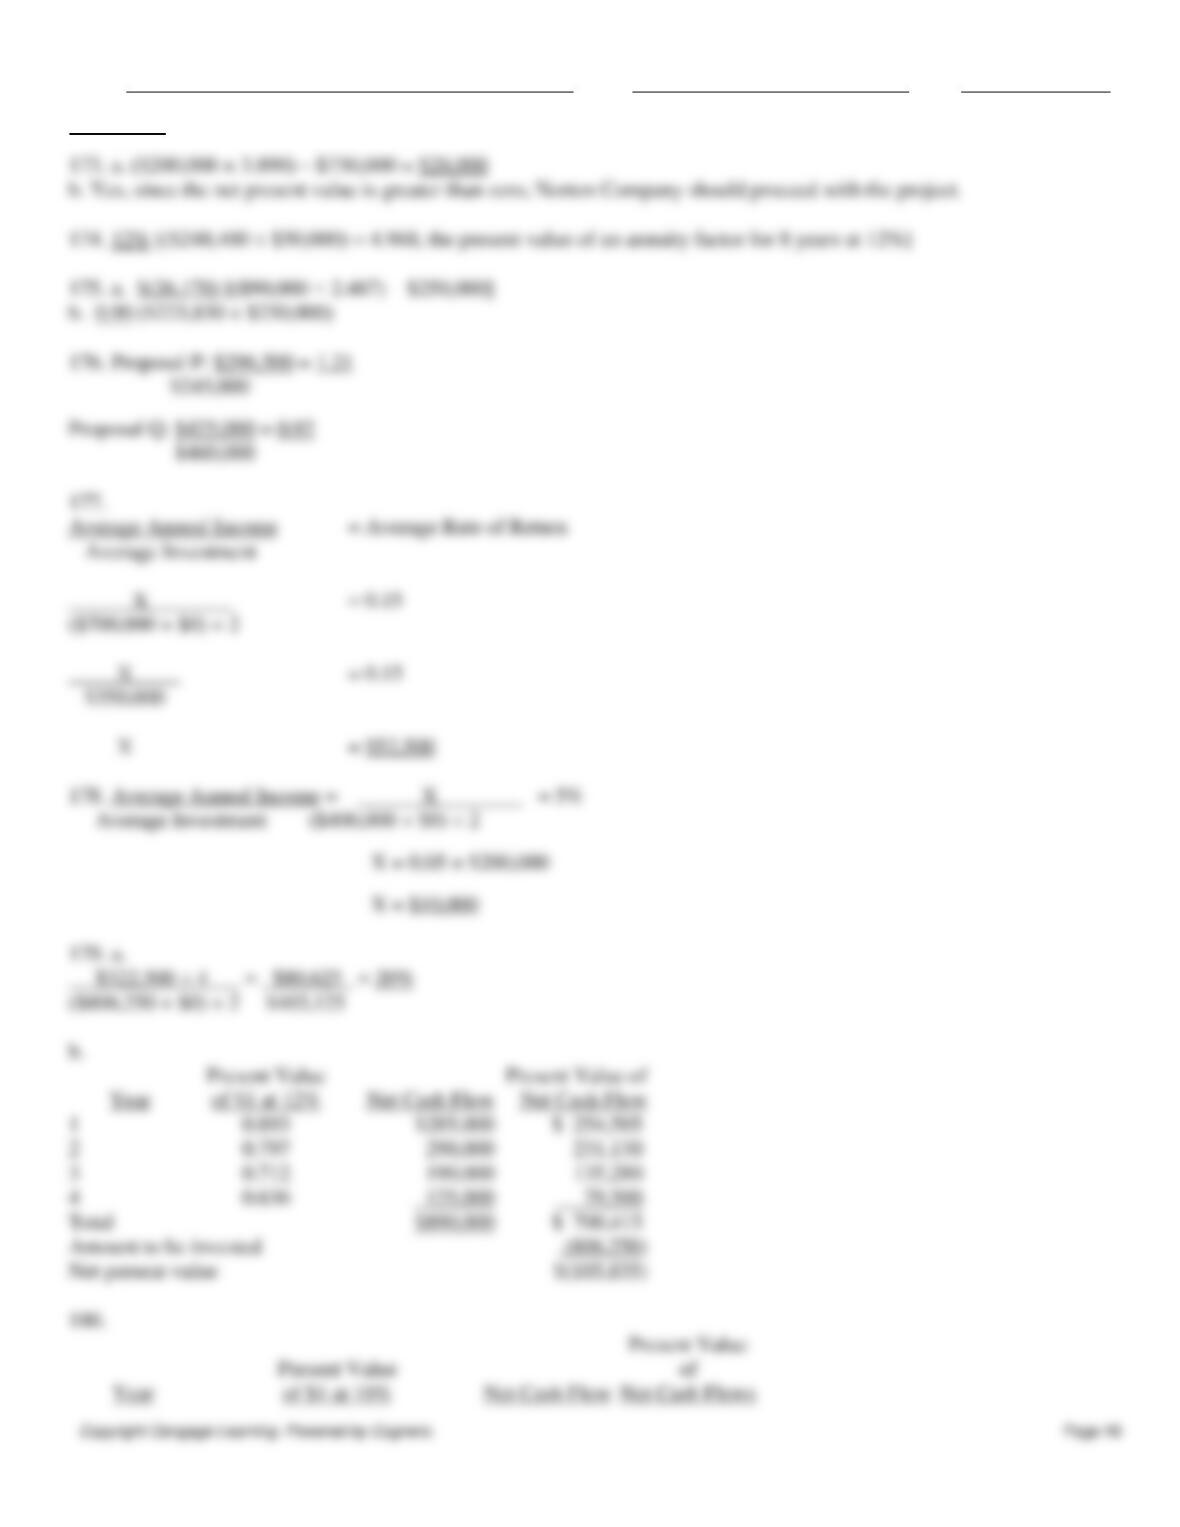
Name:
Class:
Date:
chapter 12
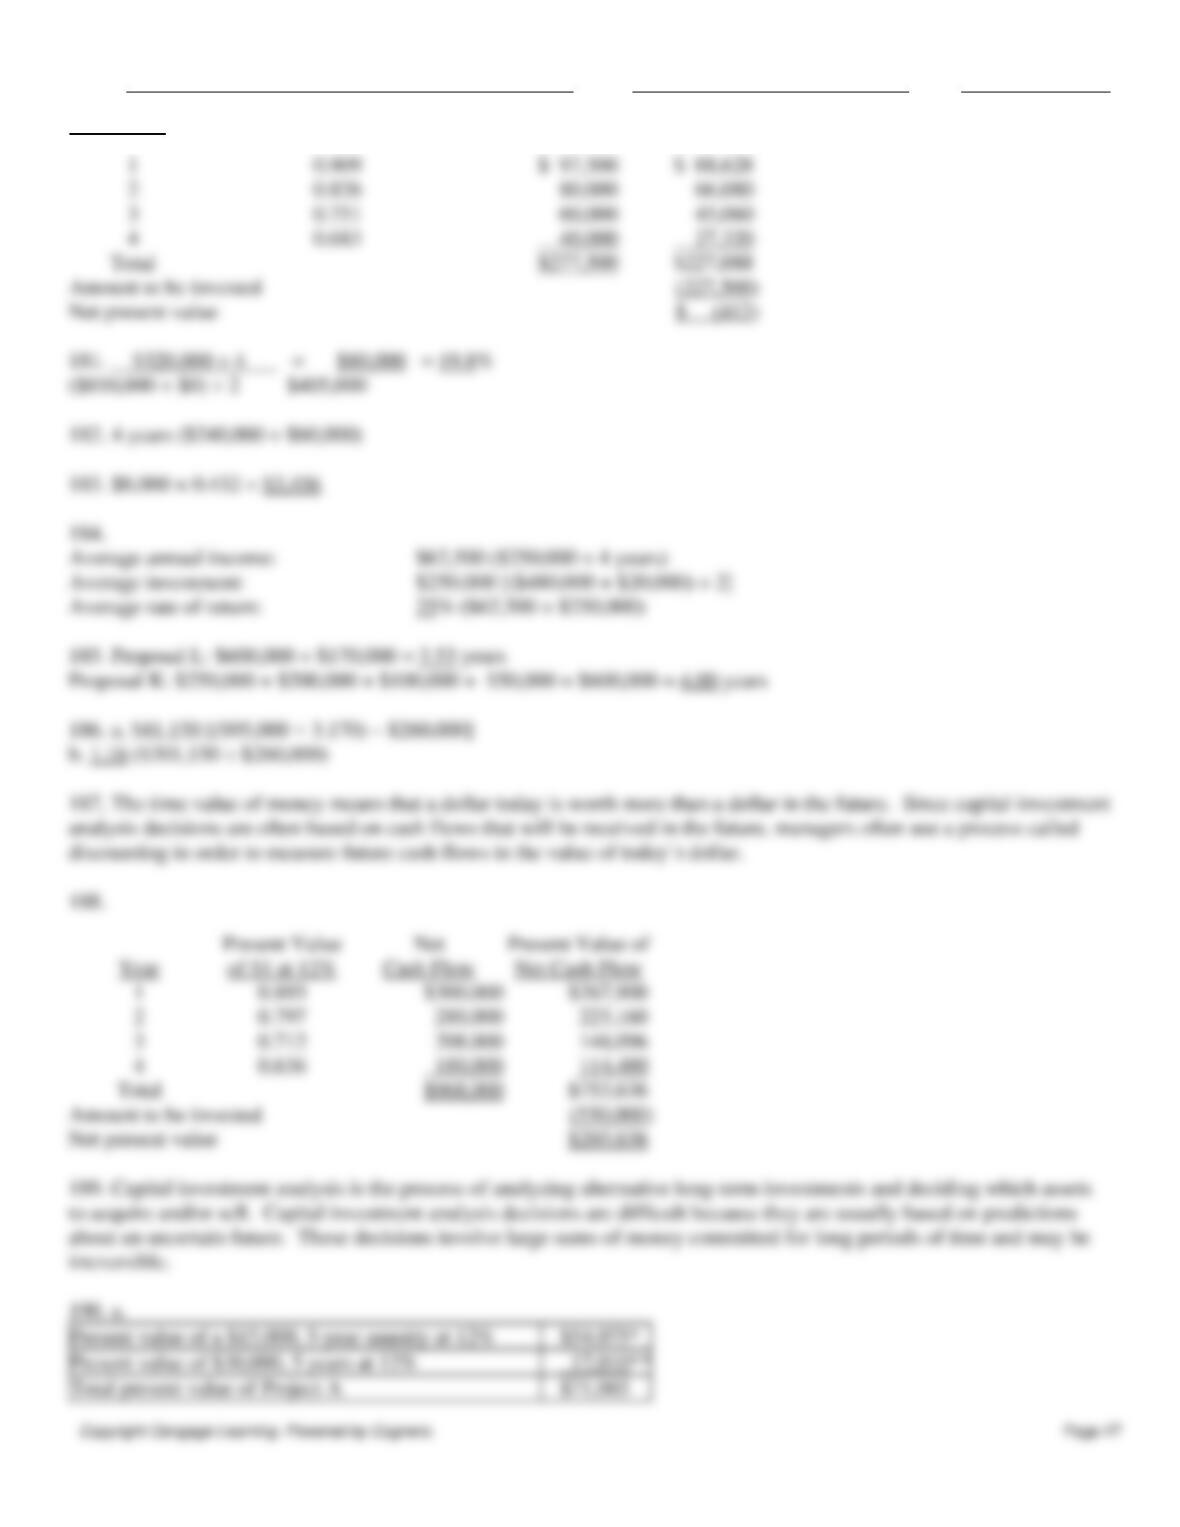
Name:
Class:
Date:
chapter 12
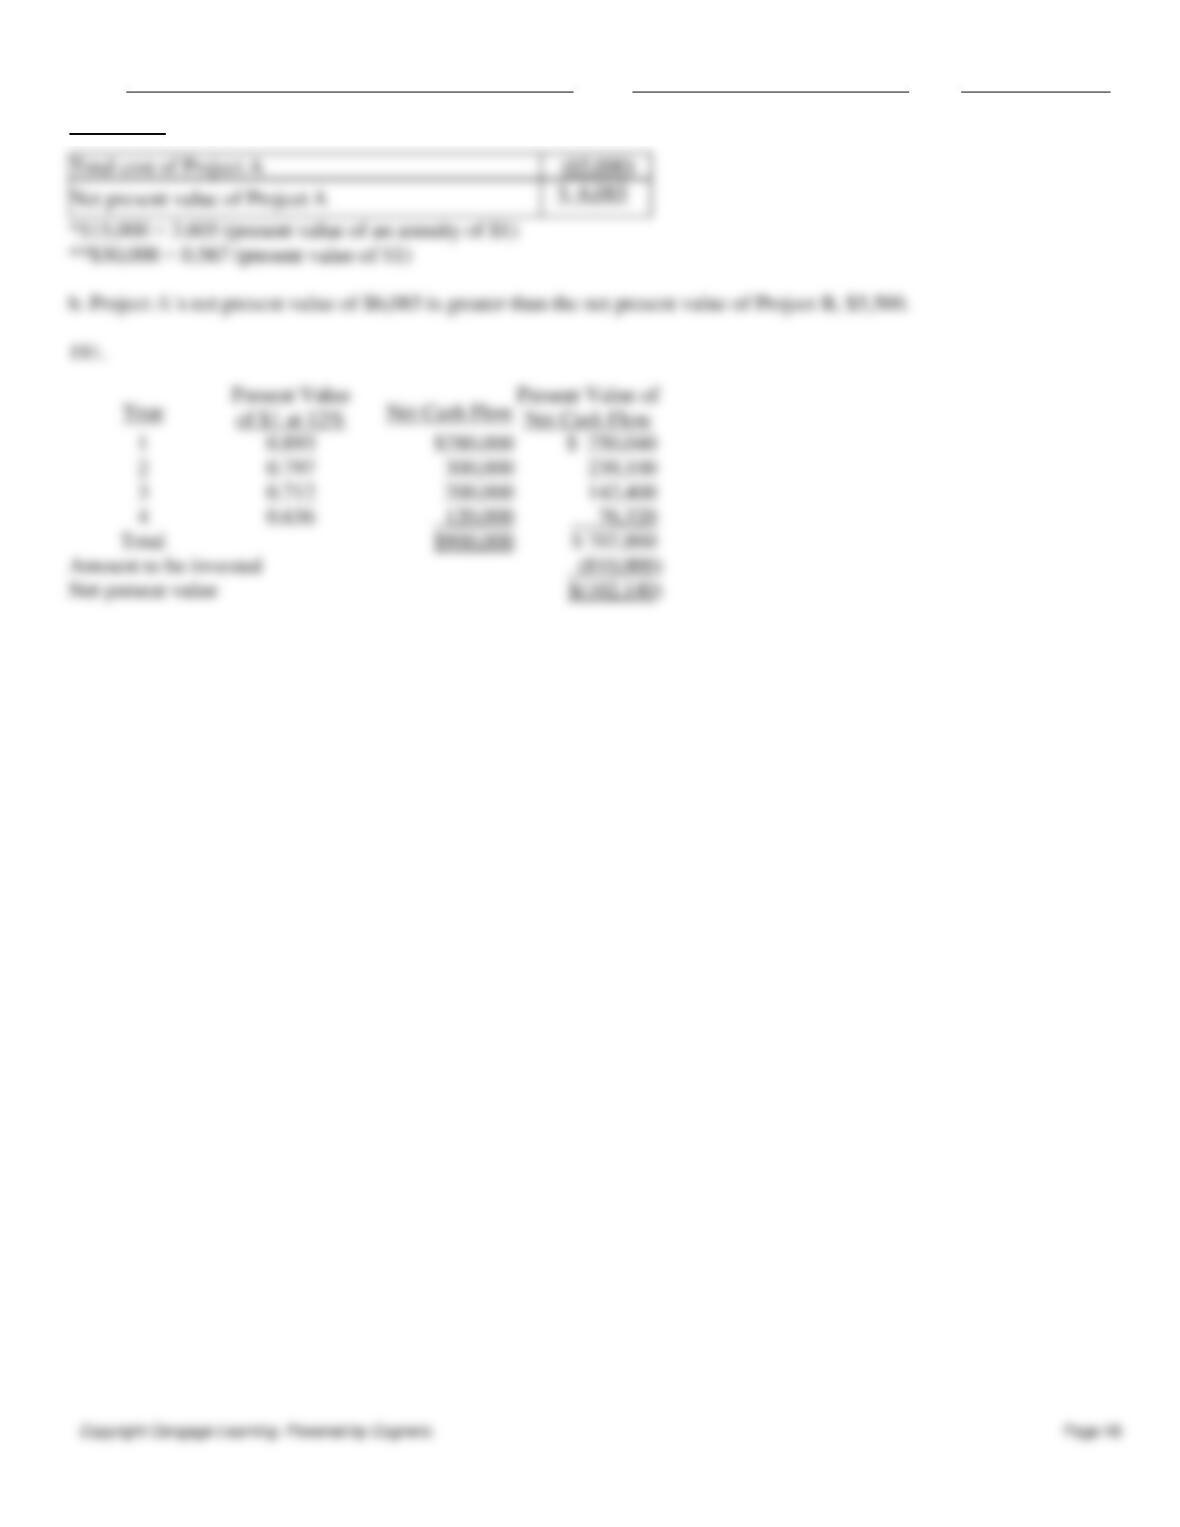
Name:
Class:
Date:
chapter 12