Version 1 1
Student name:__________
1) Galaviz Company’s quality cost report is to be based on the following data:
Net cost of spoilage $ 86,000
Test and inspection of in-process goods $ 32,000
Supplies used in testing and inspection $ 94,000
Quality engineering $ 100,000
Downtime caused by quality problems $ 58,000
Systems development $ 13,000
Supervision of testing and inspection activities $ 60,000
Cost of field servicing and handling complaints $ 49,000
Lost sales due to poor quality $ 25,000
Required:
Prepare a Quality Cost Report in good form with separate sections for prevention costs,
appraisal costs, internal failure costs, and external failure costs.
2) Gadsen Company’s quality cost report is to be based on the following data:
Maintenance of test equipment $ 41,000
Quality training $ 110,000
Product recalls $ 74,000
Quality circles $ 48,000
Rework labor and overhead $ 65,000
Liability arising from defective products $ 29,000
Supervision of testing and inspection activities $ 102,000
Re-entering data because of keying errors $ 76,000
Supplies used in testing and inspection $ 116,000
Required:
Prepare a Quality Cost Report in good form with separate sections for prevention costs,
appraisal costs, internal failure costs, and external failure costs.
Version 1 2
3) Schurz Corporation’s management reports that its average delivery cycle time is 28 days,
its average throughput time is 12.0 days, its manufacturing cycle efficiency (MCE) is 0.30, its
average move time is 0.2 day, and its average queue time is 3.0 days.
Required:
a. What is the wait time? (Round your answer to 1 decimal place.)
b. What is the process time? (Round your answer to 1 decimal place.)
c. What is the inspection time? (Round your intermediate calculations and final answer to 1
decimal place.)
4) Schlarbaum Corporation’s management keeps track of the time it takes to process orders.
During the most recent month, the following average times were recorded per order:
Days
Wait time 17.8
Inspection time 0.4
Process time 2.1
Move time 0.9
Queue time 3.9
Required:
a. Compute the throughput time. (Round your answer to 1 decimal places.)
b. Compute the manufacturing cycle efficiency (MCE). (Do not round intermediate
calculations. Round your answer to nearest whole percentage.)
c. What percentage of the production time is spent in non-value-added activities? (Round your
intermediate calculations and final answer to nearest whole percentage.)
d. Compute the delivery cycle time. (Round your answer to 1 decimal place.)
Version 1 3
5) Rigoletto Company’s quality cost report is to be based on the following data:
Lost sales due to poor quality $ 24,000
Test and inspection of incoming materials $ 94,000
Rework labor and overhead $ 55,000
Test and inspection of in-process goods $ 32,000
Product recalls $ 47,000
Quality data gathering, analysis, and reporting $ 15,000
Disposal of defective products $ 88,000
Maintenance of test equipment $ 58,000
Quality engineering $ 98,000
Required:
Prepare a Quality Cost Report in good form with separate sections for prevention costs,
appraisal costs, internal failure costs, and external failure costs.
6) Galaviz Company’s quality cost report is to be based on the following data:
Net cost of spoilage $ 32,000
Test and inspection of in-process goods $ 56,000
Supplies used in testing and inspection $ 88,000
Quality engineering $ 60,000
Downtime caused by quality problems $ 89,000
Systems development $ 63,000
Supervision of testing and inspection activities $ 31,000
Cost of field servicing and handling complaints $ 39,000
Lost sales due to poor quality $ 62,000
Version 1 4
Required:
Prepare a Quality Cost Report in good form with separate sections for prevention costs,
appraisal costs, internal failure costs, and external failure costs.
7) Gadsen Company’s quality cost report is to be based on the following data:
Maintenance of test equipment $ 38,000
Quality training $ 40,000
Product recalls $ 89,000
Quality circles $ 29,000
Rework labor and overhead $ 34,000
Liability arising from defective products $ 16,000
Supervision of testing and inspection activities $ 50,000
Re-entering data because of keying errors $ 50,000
Supplies used in testing and inspection $ 36,000
Required:
Prepare a Quality Cost Report in good form with separate sections for prevention costs,
appraisal costs, internal failure costs, and external failure costs.
8) Hartnett Company’s quality cost report is to be based on the following data:
Depreciation of test equipment $ 80,000
Quality data gathering, analysis, and reporting $ 15,000
Warranty repairs and replacements $ 68,000
Net cost of scrap $ 93,000
Disposal of defective products $ 81,000
Version 1 5
Debugging software errors $ 22,000
Statistical process control activities $ 21,000
Test and inspection of in-process goods $ 52,000
Product recalls $ 40,000
Required:
Prepare a Quality Cost Report in good form with separate sections for prevention costs,
appraisal costs, internal failure costs, and external failure costs.
Garrison 16e Rechecks 2018-06-07
9) Harwood Company’s quality cost report is to be based on the following data:
Depreciation of test equipment $ 94,000
Quality circles $ 54,000
Product recalls $ 20,000
Test and inspection of incoming materials $ 82,000
Debugging software errors $ 11,000
Rework labor and overhead $ 48,000
Technical support provided to suppliers $ 12,000
Net cost of scrap $ 29,000
Lost sales due to poor quality $ 74,000
Required:
Prepare a Quality Cost Report in good form with separate sections for prevention costs,
appraisal costs, internal failure costs, and external failure costs.
10) Galben Company’s quality cost report is to be based on the following data:
Version 1 6
Quality data gathering, analysis, and reporting $ 38,000
Supervision of testing and inspection activities $ 45,000
Liability arising from defective products $ 30,000
Technical support provided to suppliers $ 39,000
Disposal of defective products $ 72,000
Depreciation of test equipment $ 55,000
Downtime caused by quality problems $ 96,000
Test and inspection of in-process goods $ 69,000
Cost of field servicing and handling complaints $ 52,000
Required:
Prepare a Quality Cost Report in good form with separate sections for prevention costs,
appraisal costs, internal failure costs, and external failure costs.
11) Schurz Corporation’s management reports that its average delivery cycle time is 26.7
days, its average throughput time is 10.0 days, its manufacturing cycle efficiency (MCE) is 0.22,
its average move time is 0.6 day, and its average queue time is 6.7 days.
Required:
a. What is the wait time?
b. What is the process time?
c. What is the inspection time?
12) Schlarbaum Corporation’s management keeps track of the time it takes to process orders.
During the most recent month, the following average times were recorded per order:
Days
Wait time 3.7
Version 1 7
Inspection time 0.2
Process time 1.3
Move time 0.8
Queue time 6.9
Required:
a. Compute the throughput time.
b. Compute the manufacturing cycle efficiency (MCE).
c. What percentage of the production time is spent in non-value-added activities?
d. Compute the delivery cycle time.
13) During the most recent month at Schwab Corporation, queue time was 7.8 days,
inspection time was 0.3 day, process time was 1.3 days, wait time was 9.7 days, and move time
was 0.7 day.
Required:
a. Compute the throughput time.
b. Compute the manufacturing cycle efficiency (MCE).
c. What percentage of the production time is spent in non-value-added activities?
d. Compute the delivery cycle time.
14) Alghamdi Corporation keeps careful track of the time required to fill orders. The times
required for a particular order appear below:
Hours
Wait time 10.4
Process time 1.1
Inspection time 0.1
Move time 2.4
Queue time 9.3
Version 1 8
Required:
a. Determine the throughput time.
b. Determine the manufacturing cycle efficiency (MCE).
c. Determine the delivery cycle time.
15) Which of the following is not typically a performance measure category on a balanced
scorecard?
A) financial.
B) customer.
C) innovation.
D) learning and growth.
16) Customer value propositions typically fall into three broad categories, which include all
of the following except:
A) market share.
B) product leadership.
C) operational excellence.
D) customer intimacy.
17) The performance measure which answers the question “Are we maintaining our ability to
change and improve?” is:
Version 1 9
A) internal business processes.
B) customer.
C) financial.
D) learning and growth.
18) Net profit margin percentage is an example of which performance measure category?
A) internal business processes.
B) customer.
C) financial.
D) learning and growth.
19) Delivery cycle time is an example of which performance measure category?
A) internal business processes.
B) customer.
C) financial.
D) learning and growth.
20) Employee turnover percentage is an example of which performance measure category?
A) internal business processes.
B) customer.
C) financial.
D) learning and growth.
21) Market share percentage is an example of which performance measure category?
Version 1 10
A) internal business processes.
B) customer.
C) financial.
D) learning and growth.
22) An increase in appraisal costs in a quality improvement program would usually have the
following initial effects on internal and external failure costs:
Internal failure costs External failure costs
A) Increase Increase
B) Increase Decrease
C) Decrease Increase
D) Decrease Decrease
A) Choice A
B) Choice B
C) Choice C
D) Choice D
23) Inspection of products would be classified as a(n):
A) prevention cost.
B) appraisal cost.
C) internal failure cost.
D) external failure cost.
24) An increase in appraisal costs will usually result in an increase in:
A) prevention costs.
B) internal failure costs.
C) external failure costs.
D) opportunity costs.
Version 1 11
25) The cost of quality training would be classified as a(n):
A) prevention cost.
B) appraisal cost.
C) internal failure cost.
D) external failure cost.
26) The cost of testing incoming materials received from suppliers would be classified as
a(n):
A) prevention cost.
B) appraisal cost.
C) internal failure cost.
D) external failure cost.
27) The four categories of quality costs in a quality cost report are:
A) external failure, product liability, prevention, and carrying.
B) external failure, internal failure, prevention, and appraisal.
C) warranty, product liability, prevention, and appraisal.
D) warranty, product liability, training, and appraisal.
28) The cost of labor time required to rework defective units would be classified as a(n):
A) prevention cost.
B) appraisal cost.
C) internal failure cost.
D) external failure cost.
Version 1 12
29) In classifying the costs of quality at a company that manufactures sonar equipment,
which of the following is considered an external failure cost?
A) the net cost of scrap and spoilage incurred during production.
B) the cost of repairs and replacements made during the warranty period.
C) the cost of debugging software errors found in the sonar equipment during inspection
at the plant.
D) both the cost of repairs and replacements made during the warranty period and the
cost of debugging software errors found in the sonar equipment during inspection at the plant.
E) none of the above.
30) Which of the following would be classified as an appraisal cost on a quality cost report?
A) Final product testing and inspection.
B) Net cost of spoilage.
C) Repairs and replacements beyond the warranty period.
D) Rework labor and overhead.
31) Which of the following would be classified as a prevention cost on a quality cost report?
A) Technical support provided to suppliers.
B) Net cost of spoilage.
C) Disposal of defective products.
D) Debugging software errors.
32) Which of the following would be classified as an internal failure cost on a quality cost
report?
Version 1 13
A) Audits of the effectiveness of the quality system.
B) Systems development.
C) Quality improvement projects.
D) Debugging software errors.
33) Which of the following would be classified as an internal failure cost on a quality cost
report?
A) Quality improvement projects.
B) Supervision of testing and inspection activities.
C) Debugging software errors.
D) Warranty repairs and replacements.
34) Which of the following would be classified as an external failure cost on a quality cost
report?
A) Returns and allowances arising from quality problems.
B) Quality improvement projects.
C) Quality engineering.
D) Net cost of spoilage.
35) Which of the following would be classified as an appraisal cost on a quality cost report?
A) Returns and allowances arising from quality problems.
B) Downtime caused by quality problems.
C) Test and inspection of in-process goods.
D) Cost of field servicing and handling complaints.
Version 1 14
36) Which of the following would be classified as an external failure cost on a quality cost
report?
A) Repairs and replacements beyond the warranty period.
B) Technical support provided to suppliers.
C) Quality improvement projects.
D) Rework labor and overhead.
37) Which of the following would be classified as an external failure cost on a quality cost
report?
A) Reentering data because of keying errors.
B) Customer returns arising from quality problems.
C) Test and inspection of in-process goods.
D) Rework labor and overhead.
38) Which of the following would be classified as a prevention cost on a quality cost report?
A) Net cost of spoilage.
B) Supervision of testing and inspection activities.
C) Liability arising from defective products.
D) Technical support provided to suppliers.
39) Which of the following would be classified as a prevention cost on a quality cost report?
Version 1 15
A) Cost of field servicing and handling complaints.
B) Warranty repairs and replacements.
C) Systems development.
D) Rework labor and overhead.
40) Which of the following would be classified as an external failure cost on a quality cost
report?
A) Final product testing and inspection.
B) Disposal of defective products.
C) Supervision of testing and inspection activities.
D) Cost of field servicing and handling complaints.
41) In preparing a quality cost report, the cost of employee’s time spent in quality circles is
part of:
A) prevention costs.
B) appraisal costs.
C) internal failure costs.
D) external failure costs.
42) Which of the following would be classified as an appraisal cost on a quality cost report?
A) Test and inspection of in-process goods.
B) Technical support provided to suppliers.
C) Debugging software errors.
D) Audits of the effectiveness of the quality system.
Version 1 16
43) Which of the following would be classified as a prevention cost on a quality cost report?
A) Debugging software errors.
B) Quality training.
C) Test and inspection of incoming materials.
D) Cost of field servicing and handling complaints.
44) Which of the following would be classified as an appraisal cost on a quality cost report?
A) Quality improvement projects.
B) Supplies used in testing and inspection.
C) Audits of the effectiveness of the quality system.
D) Quality data gathering, analysis, and reporting.
45) Which of the following would be classified as an internal failure cost on a quality cost
report?
A) Final product testing and inspection.
B) Warranty repairs and replacements.
C) Depreciation of test equipment.
D) Debugging software errors.
46) Which of the following would be classified as a prevention cost on a quality cost report?
Version 1 17
A) Disposal of defective products.
B) Net cost of spoilage.
C) Depreciation of test equipment.
D) Technical support provided to suppliers.
47) Which of the following would be classified as an external failure cost on a quality cost
report?
A) Depreciation of test equipment.
B) Repairs and replacements beyond the warranty period.
C) Supplies used in testing and inspection.
D) Re-entering data because of keying errors.
48) Which of the following would be classified as an internal failure cost on a quality cost
report?
A) Rework labor and overhead.
B) Cost of field servicing and handling complaints.
C) Technical support provided to suppliers.
D) Lost sales arising from a reputation for poor quality.
49) Which of the following would be classified as an external failure cost on a quality cost
report?
A) Re-entering data because of keying errors.
B) Repairs and replacements beyond the warranty period.
C) Disposal of defective products.
D) Technical support provided to suppliers.
Version 1 18
50) Which of the following would be classified as an internal failure cost on a quality cost
report?
A) Rework labor and overhead.
B) Technical support provided to suppliers.
C) Quality improvement projects.
D) Systems development.
51) Which of the following would be classified as an external failure cost on a quality cost
report?
A) Depreciation of test equipment.
B) Test and inspection of in-process goods.
C) Test and inspection of incoming materials.
D) Warranty repairs and replacements.
52) Which of the following would be classified as an appraisal cost on a quality cost report?
A) Debugging software errors.
B) Supplies used in testing and inspection.
C) Re-entering data because of keying errors.
D) Warranty repairs and replacements.
53) Which of the following would be classified as a prevention cost on a quality cost report?
Version 1 19
A) Supplies used in testing and inspection.
B) Debugging software errors.
C) Quality improvement projects.
D) Lost sales arising from a reputation for poor quality.
54) Which of the following would be classified as an appraisal cost on a quality cost report?
A) Maintenance of test equipment.
B) Re-entering data because of keying errors.
C) Debugging software errors.
D) Warranty repairs and replacements.
55) Adolphson Corporation has provided the following summary of its quality cost report for
the last two years:
Summary of Quality Cost Report
(in thousands)
This Year Last Year % Change
Prevention costs $ 300 $ 200 +50
Appraisal costs 315 210 +50
Internal failure costs 114 190 −40
External failure costs 621 1,200 −48
Total quality costs $1,350 $1,800 −25
On the basis of this report, which one of the following statements is most likely correct?
A) An increase in prevention and appraisal costs resulted in fewer defects, and
therefore, resulted in a decrease in internal and external failure costs.
B) A decrease in internal and external failure costs resulted in less need for prevention
and appraisal costs.
C) Quality costs such as scrap and rework decreased by 48%.
D) Quality costs such as returns and repairs under warranty decreased by 40%.
56) Fackler Company’s quality cost report is to be based on the following data:
Version 1 20
Quality circles $ 12,000
Product recalls $ 24,000
Supplies used in testing and inspection $ 87,000
Net cost of scrap $ 59,000
Liability arising from defective products $ 38,000
Re-entering data because of keying errors $ 65,000
Debugging software errors $ 19,000
Test and inspection of incoming materials $ 65,000
Quality data gathering, analysis, and reporting $ 55,000
What would be the total prevention cost appearing on the quality cost report?
A) $99,000
B) $67,000
C) $120,000
D) $79,000
57) Fackler Company’s quality cost report is to be based on the following data:
Quality circles $ 12,000
Product recalls $ 24,000
Supplies used in testing and inspection $ 87,000
Net cost of scrap $ 59,000
Liability arising from defective products $ 38,000
Re-entering data because of keying errors $ 65,000
Debugging software errors $ 19,000
Test and inspection of incoming materials $ 65,000
Quality data gathering, analysis, and reporting $ 55,000
What would be the total appraisal cost appearing on the quality cost report?
A) $130,000
B) $152,000
C) $146,000
D) $219,000
58) Fackler Company’s quality cost report is to be based on the following data:
Quality circles $ 12,000
Product recalls $ 24,000
Supplies used in testing and inspection $ 87,000
Version 1 21
Net cost of scrap $ 59,000
Liability arising from defective products $ 38,000
Re-entering data because of keying errors $ 65,000
Debugging software errors $ 19,000
Test and inspection of incoming materials $ 65,000
Quality data gathering, analysis, and reporting $ 55,000
What would be the total internal failure cost appearing on the quality cost report?
A) $143,000
B) $146,000
C) $97,000
D) $43,000
59) Fackler Company’s quality cost report is to be based on the following data:
Quality circles $ 12,000
Product recalls $ 24,000
Supplies used in testing and inspection $ 87,000
Net cost of scrap $ 59,000
Liability arising from defective products $ 38,000
Re-entering data because of keying errors $ 65,000
Debugging software errors $ 19,000
Test and inspection of incoming materials $ 65,000
Quality data gathering, analysis, and reporting $ 55,000
What would be the total external failure cost appearing on the quality cost report?
A) $57,000
B) $62,000
C) $205,000
D) $424,000
60) Circle K Toys, Incorporated manufactures toys and children’s clothing and sells these
products to retail outlets. The following costs were incurred in performing quality activities at
Circle K during the year:
Product recall activities $ 370,000
Quality training activities $ 240,000
Quality improvement activities $ 154,000
Warranty claim activities $ 109,000
Version 1 22
Quality inspection and testing activities $ 61,000
Rework activities $ 38,000
Quality data collection and reporting activities $ 15,000
What is the total of the prevention costs for Circle K?
A) $394,000
B) $409,000
C) $455,000
D) $470,000
61) Circle K Toys, Incorporated manufactures toys and children’s clothing and sells these
products to retail outlets. The following costs were incurred in performing quality activities at
Circle K during the year:
Product recall activities $ 370,000
Quality training activities $ 240,000
Quality improvement activities $ 154,000
Warranty claim activities $ 109,000
Quality inspection and testing activities $ 61,000
Rework activities $ 38,000
Quality data collection and reporting activities $ 15,000
What is the total of the internal failure costs for Circle K?
A) $53,000
B) $99,000
C) $517,000
D) $38,000
62) Eaglin Company’s quality cost report is to be based on the following data:
Disposal of defective products $ 74,000
Liability arising from defective products $ 66,000
Test and inspection of in-process goods $ 82,000
Systems development $ 11,000
Net cost of spoilage $ 75,000
Supervision of testing and inspection activities $ 93,000
Lost sales due to poor quality $ 44,000
Maintenance of test equipment $ 19,000
Quality data gathering, analysis, and reporting $ 51,000
Version 1 23
What would be the total prevention cost appearing on the quality cost report?
A) $55,000
B) $30,000
C) $62,000
D) $133,000
63) Eaglin Company’s quality cost report is to be based on the following data:
Disposal of defective products $ 74,000
Liability arising from defective products $ 66,000
Test and inspection of in-process goods $ 82,000
Systems development $ 11,000
Net cost of spoilage $ 75,000
Supervision of testing and inspection activities $ 93,000
Lost sales due to poor quality $ 44,000
Maintenance of test equipment $ 19,000
Quality data gathering, analysis, and reporting $ 51,000
What would be the total appraisal cost appearing on the quality cost report?
A) $194,000
B) $175,000
C) $112,000
D) $167,000
64) Eaglin Company’s quality cost report is to be based on the following data:
Disposal of defective products $ 74,000
Liability arising from defective products $ 66,000
Test and inspection of in-process goods $ 82,000
Systems development $ 11,000
Net cost of spoilage $ 75,000
Supervision of testing and inspection activities $ 93,000
Lost sales due to poor quality $ 44,000
Maintenance of test equipment $ 19,000
Quality data gathering, analysis, and reporting $ 51,000
What would be the total internal failure cost appearing on the quality cost report?
Version 1 24
A) $119,000
B) $149,000
C) $156,000
D) $140,000
65) Eaglin Company’s quality cost report is to be based on the following data:
Disposal of defective products $ 74,000
Liability arising from defective products $ 66,000
Test and inspection of in-process goods $ 82,000
Systems development $ 11,000
Net cost of spoilage $ 75,000
Supervision of testing and inspection activities $ 93,000
Lost sales due to poor quality $ 44,000
Maintenance of test equipment $ 19,000
Quality data gathering, analysis, and reporting $ 51,000
What would be the total external failure cost appearing on the quality cost report?
A) $259,000
B) $110,000
C) $119,000
D) $515,000
66) Fabrick Company’s quality cost report is to be based on the following data:
Lost sales due to poor quality $ 22,000
Quality data gathering, analysis, and reporting $ 63,400
Net cost of spoilage $ 67,700
Re-entering data because of keying errors $ 20,300
Test and inspection of in-process goods $ 13,100
Final product testing and inspection $ 45,400
Statistical process control activities $ 40,900
Returns arising from quality problems $ 33,200
Downtime caused by quality problems $ 66,000
What would be the total prevention cost appearing on the quality cost report?
Version 1 25
A) $96,600
B) $104,300
C) $76,500
D) $86,300
67) Fabrick Company’s quality cost report is to be based on the following data:
Lost sales due to poor quality $ 78,000
Quality data gathering, analysis, and reporting $ 23,000
Net cost of spoilage $ 88,000
Re-entering data because of keying errors $ 98,000
Test and inspection of in-process goods $ 24,000
Final product testing and inspection $ 78,000
Statistical process control activities $ 49,000
Returns arising from quality problems $ 16,000
Downtime caused by quality problems $ 26,000
What would be the total prevention cost appearing on the quality cost report?
A) $101,000
B) $72,000
C) $73,000
D) $96,000
68) Fabrick Company’s quality cost report is to be based on the following data:
Lost sales due to poor quality $ 19,200
Quality data gathering, analysis, and reporting $ 66,000
Net cost of spoilage $ 66,100
Re-entering data because of keying errors $ 20,500
Test and inspection of in-process goods $ 17,500
Final product testing and inspection $ 42,000
Statistical process control activities $ 36,600
Returns arising from quality problems $ 41,600
Downtime caused by quality problems $ 61,000
What would be the total appraisal cost appearing on the quality cost report?
Version 1 26
A) $162,100
B) $97,700
C) $83,600
D) $59,500
69) Fabrick Company’s quality cost report is to be based on the following data:
Lost sales due to poor quality $ 78,000
Quality data gathering, analysis, and reporting $ 23,000
Net cost of spoilage $ 88,000
Re-entering data because of keying errors $ 98,000
Test and inspection of in-process goods $ 24,000
Final product testing and inspection $ 78,000
Statistical process control activities $ 49,000
Returns arising from quality problems $ 16,000
Downtime caused by quality problems $ 26,000
What would be the total appraisal cost appearing on the quality cost report?
A) $122,000
B) $174,000
C) $104,000
D) $102,000
70) Fabrick Company’s quality cost report is to be based on the following data:
Lost sales due to poor quality $ 13,900
Quality data gathering, analysis, and reporting $ 65,000
Net cost of spoilage $ 61,100
Re-entering data because of keying errors $ 18,500
Test and inspection of in-process goods $ 18,600
Final product testing and inspection $ 44,100
Statistical process control activities $ 45,200
Returns arising from quality problems $ 39,600
Downtime caused by quality problems $ 60,500
What would be the total internal failure cost appearing on the quality cost report?
Version 1 27
A) $140,100
B) $93,000
C) $100,100
D) $32,400
71) Fabrick Company’s quality cost report is to be based on the following data:
Lost sales due to poor quality $ 78,000
Quality data gathering, analysis, and reporting $ 23,000
Net cost of spoilage $ 88,000
Re-entering data because of keying errors $ 98,000
Test and inspection of in-process goods $ 24,000
Final product testing and inspection $ 78,000
Statistical process control activities $ 49,000
Returns arising from quality problems $ 16,000
Downtime caused by quality problems $ 26,000
What would be the total internal failure cost appearing on the quality cost report?
A) $212,000
B) $166,000
C) $122,000
D) $114,000
72) Fabrick Company’s quality cost report is to be based on the following data:
Lost sales due to poor quality $ 22,000
Quality data gathering, analysis, and reporting $ 63,400
Net cost of spoilage $ 67,700
Re-entering data because of keying errors $ 20,300
Test and inspection of in-process goods $ 13,100
Final product testing and inspection $ 45,400
Statistical process control activities $ 40,900
Returns arising from quality problems $ 33,200
Downtime caused by quality problems $ 66,000
What would be the total external failure cost appearing on the quality cost report?
Version 1 28
A) $55,200
B) $372,000
C) $88,000
D) $209,200
73) Fabrick Company’s quality cost report is to be based on the following data:
Lost sales due to poor quality $ 78,000
Quality data gathering, analysis, and reporting $ 23,000
Net cost of spoilage $ 88,000
Re-entering data because of keying errors $ 98,000
Test and inspection of in-process goods $ 24,000
Final product testing and inspection $ 78,000
Statistical process control activities $ 49,000
Returns arising from quality problems $ 16,000
Downtime caused by quality problems $ 26,000
What would be the total external failure cost appearing on the quality cost report?
A) $94,000
B) $480,000
C) $104,000
D) $306,000
74) Eagleson Company’s quality cost report is to be based on the following data:
Net cost of scrap $ 75,000
Liability arising from defective products $ 32,000
Warranty repairs and replacements $ 80,000
Re-entering data because of keying errors $ 75,000
Supplies used in testing and inspection $ 18,000
Quality data gathering, analysis, and reporting $ 62,000
Final product testing and inspection $ 21,000
Test and inspection of in-process goods $ 44,000
Systems development $ 45,000
What would be the total prevention cost appearing on the quality cost report?
Version 1 29
A) $107,000
B) $125,000
C) $84,000
D) $89,000
75) Eagleson Company’s quality cost report is to be based on the following data:
Net cost of scrap $ 75,000
Liability arising from defective products $ 32,000
Warranty repairs and replacements $ 80,000
Re-entering data because of keying errors $ 75,000
Supplies used in testing and inspection $ 18,000
Quality data gathering, analysis, and reporting $ 62,000
Final product testing and inspection $ 21,000
Test and inspection of in-process goods $ 44,000
Systems development $ 45,000
What would be the total appraisal cost appearing on the quality cost report?
A) $93,000
B) $62,000
C) $39,000
D) $83,000
76) Eagleson Company’s quality cost report is to be based on the following data:
Net cost of scrap $ 75,000
Liability arising from defective products $ 32,000
Warranty repairs and replacements $ 80,000
Re-entering data because of keying errors $ 75,000
Supplies used in testing and inspection $ 18,000
Quality data gathering, analysis, and reporting $ 62,000
Final product testing and inspection $ 21,000
Test and inspection of in-process goods $ 44,000
Systems development $ 45,000
What would be the total internal failure cost appearing on the quality cost report?
Version 1 30
A) $155,000
B) $150,000
C) $96,000
D) $107,000
77) Eagleson Company’s quality cost report is to be based on the following data:
Net cost of scrap $ 75,000
Liability arising from defective products $ 32,000
Warranty repairs and replacements $ 80,000
Re-entering data because of keying errors $ 75,000
Supplies used in testing and inspection $ 18,000
Quality data gathering, analysis, and reporting $ 62,000
Final product testing and inspection $ 21,000
Test and inspection of in-process goods $ 44,000
Systems development $ 45,000
What would be the total external failure cost appearing on the quality cost report?
A) $262,000
B) $155,000
C) $112,000
D) $451,000
78) Which of the following will increase a company’s manufacturing cycle efficiency
(MCE)?
Decrease in Inspection Time Decrease in Queue Time
A) Yes Yes
B) Yes No
C) No Yes
D) No No
A) Choice A
B) Choice B
C) Choice C
D) Choice D
Version 1 31
79) Santoyo Corporation keeps careful track of the time required to fill orders. Data
concerning a particular order appear below:
Hours
Wait time 12.9
Process time 2.0
Inspection time 0.4
Move time 4.6
Queue time 6.3
The delivery cycle time was:
A) 10.9 hours
B) 23.8 hours
C) 26.2 hours
D) 4.6 hours
80) Santoyo Corporation keeps careful track of the time required to fill orders. Data
concerning a particular order appear below:
Hours
Wait time 28.0
Process time 1.0
Inspection time 0.4
Move time 3.2
Queue time 5.1
The delivery cycle time was:
A) 8.3 hours
B) 3.2 hours
C) 37.7 hours
D) 36.3 hours
81) Schapp Corporation keeps careful track of the time required to fill orders. The times
recorded for a particular order appear below:
Hours
Move time 4.4
Wait time 12.2
Version 1 32
Queue time 8.6
Process time 3.3
Inspection time 2.2
The throughput time was:
A) 18.5 hours
B) 30.7 hours
C) 20.8 hours
D) 9.9 hours
82) Schapp Corporation keeps careful track of the time required to fill orders. The times
recorded for a particular order appear below:
Hours
Move time 2.6
Wait time 10.4
Queue time 6.8
Process time 1.5
Inspection time 0.4
The throughput time was:
A) 11.3 hours
B) 21.7 hours
C) 17.2 hours
D) 4.5 hours
83) Hunt Company has the following production data:
Throughput time 4 hours
Delivery cycle time 6 hours
Process time 1 hour
Wait time before production 2 hours
The manufacturing cycle efficiency (MCE) for Hunt Company is:
A) 50%
B) 25%
C) 20%
D) 75%
Version 1 33
84) Pinkton Corporation keeps careful track of the time required to fill orders. The times
recorded for a particular order appear below:
Hours
Move time 1.9
Wait time 27.7
Queue time 4.5
Process time 0.6
Inspection time 0.4
The delivery cycle time was:
A) 1.9 hours
B) 6.4 hours
C) 34.1 hours
D) 35.1 hours
85) Pinkton Corporation keeps careful track of the time required to fill orders. The times
recorded for a particular order appear below:
Hours
Move time 3.6
Wait time 13.3
Queue time 5.1
Process time 0.5
Inspection time 0.2
The delivery cycle time was:
A) 8.7 hours
B) 3.6 hours
C) 22.0 hours
D) 22.7 hours
86) Simkin Corporation keeps careful track of the time required to fill orders. Data
concerning a particular order appear below:
Hours
Wait time 20.7
Process time 2.2
Version 1 34
Inspection time 0.2
Move time 2.8
Queue time 4.9
The manufacturing cycle efficiency (MCE) was closest to:
A) 0.49
B) 0.14
C) 0.22
D) 0.07
87) Simkin Corporation keeps careful track of the time required to fill orders. Data
concerning a particular order appear below:
Hours
Wait time 20.6
Process time 1.9
Inspection time 0.1
Move time 2.7
Queue time 4.8
The manufacturing cycle efficiency (MCE) was closest to:
A) 0.46
B) 0.06
C) 0.20
D) 0.19
88) Navern Corporation manufactures and sells custom home elevators. From the time an
order is placed until the time the elevator is installed in the customer’s home averages 118 days.
This 118 days is spent as follows:
Wait time 24 days
Inspection time 19 days
Process time 29 days
Move time 27 days
Queue time 19 days
What is Navern’s manufacturing cycle efficiency (MCE) for its elevators?
Version 1 35
A) 40.7%
B) 30.9%
C) 59.3%
D) 56.8%
89) Navern Corporation manufactures and sells custom home elevators. From the time an
order is placed until the time the elevator is installed in the customer’s home averages 90 days.
This 90 days is spent as follows:
Wait time 40 days
Inspection time 2 days
Process time 18 days
Move time 20 days
Queue time 10 days
What is Navern’s manufacturing cycle efficiency (MCE) for its elevators?
A) 20.0%
B) 36.0%
C) 45.0%
D) 64.0%
90) Tanouye Corporation keeps careful track of the time required to fill orders. Data
concerning a particular order appear below:
Hours
Wait time 31.7
Process time 1.2
Inspection time 0.2
Move time 3.5
Queue time 9.4
The throughput time was:
A) 46.0 hours
B) 41.1 hours
C) 14.3 hours
D) 4.9 hours
Version 1 36
91) Tanouye Corporation keeps careful track of the time required to fill orders. Data
concerning a particular order appear below:
Hours
Wait time 12.7
Process time 1.6
Inspection time 0.4
Move time 2.1
Queue time 8.8
The throughput time was:
A) 4.1 hours
B) 12.9 hours
C) 25.6 hours
D) 21.5 hours
92) Vandenheuvel Corporation keeps careful track of the time required to fill orders. The
times recorded for a particular order appear below:
Hours
Move time 2.3
Wait time 19.2
Queue time 13.1
Process time 2.7
Inspection time 0.9
The manufacturing cycle efficiency (MCE) was closest to:
A) 0.22
B) 0.09
C) 0.14
D) 0.27
93) Vandenheuvel Corporation keeps careful track of the time required to fill orders. The
times recorded for a particular order appear below:
Hours
Move time 2.4
Wait time 18.2
Version 1 37
Queue time 6.8
Process time 1.8
Inspection time 0.3
The manufacturing cycle efficiency (MCE) was closest to:
A) 0.06
B) 0.18
C) 0.62
D) 0.16
94) Rotan Corporation keeps careful track of the time required to fill orders. The times
recorded for a particular order appear below:
Hours
Move time 3.2
Wait time 10.9
Queue time 5.1
Process time 1.2
Inspection time 0.2
The delivery cycle time was:
A) 19.2 hours
B) 20.6 hours
C) 8.3 hours
D) 3.2 hours
95) Rotan Corporation keeps careful track of the time required to fill orders. The times
recorded for a particular order appear below:
Hours
Move time 5.0
Wait time 12.7
Queue time 6.9
Process time 3.0
Inspection time 2.0
The throughput time was:
Version 1 38
A) 10.0 hours
B) 16.9 hours
C) 29.6 hours
D) 19.6 hours
96) Rotan Corporation keeps careful track of the time required to fill orders. The times
recorded for a particular order appear below:
Hours
Move time 3.2
Wait time 10.9
Queue time 5.1
Process time 1.2
Inspection time 0.2
The throughput time was:
A) 4.6 hours
B) 9.7 hours
C) 20.6 hours
D) 16 hours
97) Rotan Corporation keeps careful track of the time required to fill orders. The times
recorded for a particular order appear below:
Hours
Move time 3.2
Wait time 10.9
Queue time 5.1
Process time 1.2
Inspection time 0.2
The manufacturing cycle efficiency (MCE) was closest to:
A) 0.89
B) 0.06
C) 0.29
D) 0.12
Version 1 39
98) The management of International Cookwares believes that delivery performance
measures must be improved if the company is to maintain its competitive edge. The following
data are considered to be typical of the time to complete orders.
● Process time: 4 days
● Wait time to the start of production: 15 days
● Move time: 3 days
● Inspection time: 2 days
● Queue time during the production process: 8 days
What is the manufacturing cycle efficiency?
A) 12.5%
B) 23.5%
C) 76.4%
D) 87.5%
99) The management of International Cookwares believes that delivery performance
measures must be improved if the company is to maintain its competitive edge. The following
data are considered to be typical of the time to complete orders.
● Process time: 4 days
● Wait time to the start of production: 15 days
● Move time: 3 days
● Inspection time: 2 days
● Queue time during the production process: 8 days
What is the delivery cycle time?
A) 4 days
B) 15 days
C) 17 days
D) 32 days
100) Kingcade Corporation keeps careful track of the time required to fill orders. Data
concerning a particular order appear below:
Hours
Version 1 40
Wait time 20.2
Process time 3.0
Inspection time 2.0
Move time 3.9
Queue time 11.0
The throughput time was:
A) 40.1 hours
B) 8.9 hours
C) 31.2 hours
D) 19.9 hours
101) Kingcade Corporation keeps careful track of the time required to fill orders. Data
concerning a particular order appear below:
Hours
Wait time 18.3
Process time 1.1
Inspection time 0.1
Move time 2.0
Queue time 9.1
The throughput time was:
A) 30.6 hours
B) 3.2 hours
C) 27.4 hours
D) 12.3 hours
102) Kingcade Corporation keeps careful track of the time required to fill orders. Data
concerning a particular order appear below:
Hours
Wait time 18.3
Process time 1.1
Inspection time 0.1
Move time 2.0
Queue time 9.1
The manufacturing cycle efficiency (MCE) was closest to:
Version 1 41
A) 0.09
B) 0.12
C) 0.67
D) 0.04
103) Kingcade Corporation keeps careful track of the time required to fill orders. Data
concerning a particular order appear below:
Hours
Wait time 19.6
Process time 2.4
Inspection time 1.4
Move time 3.3
Queue time 10.4
The delivery cycle time was:
A) 37.1 hours
B) 3.3 hours
C) 33.3 hours
D) 13.7 hours
104) Kingcade Corporation keeps careful track of the time required to fill orders. Data
concerning a particular order appear below:
Hours
Wait time 18.3
Process time 1.1
Inspection time 0.1
Move time 2.0
Queue time 9.1
The delivery cycle time was:
A) 30.6 hours
B) 2 hours
C) 29.4 hours
D) 11.1 hours
Version 1 42
105) Which of the following will increase a company’s overall equipment effectiveness
(OEE)?
Decrease in Machine Time Available Decrease in Ideal Run Rate
A) Yes Yes
B) Yes No
C) No Yes
D) No No
A) Choice A
B) Choice B
C) Choice C
D) Choice D
106) Beamer Corporation produces one product and it seems that the demand for that product
is exceeding their manufacturing capacity. Below is the information concerning the machine that
produces their product:
Actual run time this week 3,000 Minutes
Machine time available per week 5,000 Minutes
Actual run rate this week 3.2 Units per minute
Ideal run rate 4 Units per minute
Defect-free output this week 7,200 Units
Total output this week (including defects) 9,600 Units
Beamer’s utilization rate for the week was:
A) 0.31
B) 0.42
C) 0.60
D) 0.80
Version 1 43
107) Beamer Corporation produces one product and it seems that the demand for that product
is exceeding their manufacturing capacity. Below is the information concerning the machine that
produces their product:
Actual run time this week 3,000 Minutes
Machine time available per week 5,000 Minutes
Actual run rate this week 3.2 Units per minute
Ideal run rate 4 Units per minute
Defect-free output this week 7,200 Units
Total output this week (including defects) 9,600 Units
Beamer’s efficiency rate was:
A) 0.31
B) 0.42
C) 0.60
D) 0.80
108) Beamer Corporation produces one product and it seems that the demand for that product
is exceeding their manufacturing capacity. Below is the information concerning the machine that
produces their product:
Actual run time this week 3,000 Minutes
Machine time available per week 5,000 Minutes
Actual run rate this week 3.2 Units per minute
Ideal run rate 4 Units per minute
Defect-free output this week 7,200 Units
Total output this week (including defects) 9,600 Units
Beamer’s quality rate was:
A) 0.31
B) 0.42
C) 0.80
D) 0.75
Version 1 44
109) Beamer Corporation produces one product and it seems that the demand for that product
is exceeding their manufacturing capacity. Below is the information concerning the machine that
produces their product
Actual run time this week 3,000 Minutes
Machine time available per week 5,000 Minutes
Actual run rate this week 3.2 Units per minute
Ideal run rate 4 Units per minute
Defect-free output this week 7,200 Units
Total output this week (including defects) 9,600 Units
Beamer’s overall equipment effectiveness (OEE) was approximately:
A) 0.10
B) 0.20
C) 0.25
D) 0.36
110) Halpert Corporation has been in operation for one year. The only product they produce is
a specific bicycle chain. They want to make sure they are effectively utilizing the machinery they
use to create this product. Below is the information concerning the machine that produces the
bicycle chain:
Actual run time this week 2,500 Minutes
Machine time available per week 3,125 Minutes
Actual run rate this week 2.4 Units per minute
Ideal run rate 3.2 Units per minute
Defect-free output this week 5,100 Units
Total output this week (including defects) 6,000 Units
Halpert’s utilization rate for the week was:
A) 0.42
B) 0.75
C) 0.80
D) 0.85
Version 1 45
111) Halpert Corporation has been in operation for one year. The only product they produce is
a specific bicycle chain. They want to make sure they are effectively utilizing the machinery they
use to create this product. Below is the information concerning the machine that produces the
bicycle chain:
Actual run time this week 2,500 Minutes
Machine time available per week 3,125 Minutes
Actual run rate this week 2.4 Units per minute
Ideal run rate 3.2 Units per minute
Defect-free output this week 5,100 Units
Total output this week (including defects) 6,000 Units
Halpert’s efficiency rate was:
A) 0.42
B) 0.75
C) 0.80
D) 0.85
112) Halpert Corporation has been in operation for one year. The only product they produce is
a specific bicycle chain. They want to make sure they are effectively utilizing the machinery they
use to create this product. Below is the information concerning the machine that produces the
bicycle chain:
Actual run time this week 2,500 Minutes
Machine time available per week 3,125 Minutes
Actual run rate this week 2.4 Units per minute
Ideal run rate 3.2 Units per minute
Defect-free output this week 5,100 Units
Total output this week (including defects) 6,000 Units
Halpert’s quality rate was:
Version 1 46
A) 0.42
B) 0.75
C) 0.80
D) 0.85
113) Halpert Corporation has been in operation for one year. The only product they produce is
a specific bicycle chain. They want to make sure they are effectively utilizing the machinery they
use to create this product. Below is the information concerning the machine that produces the
bicycle chain:
Actual run time this week 2,500 Minutes
Machine time available per week 3,125 Minutes
Actual run rate this week 2.4 Units per minute
Ideal run rate 3.2 Units per minute
Defect-free output this week 5,100 Units
Total output this week (including defects) 6,000 Units
Halpert’s overall equipment effectiveness (OEE) was approximately:
A) 0.25
B) 0.29
C) 0.51
D) 0.54
114) When tying compensation to the balanced scorecard, management must ensure that the
performance measures have all the following characteristics except:
A) Reliable.
B) Sensible.
C) Understood by those who are being evaluated.
D) Easily manipulated.
Version 1 47
115) A concept whereby organizations consider the needs of all stakeholders (not just
stockholders) when making decisions is referred to as:
A) Human rights advocacy.
B) Corporate social responsibility.
C) Environmental rights responsibility.
D) Social rights responsibility.
116) Corporate social responsibility performance reports are also referred to as:
A) Sustainability reports.
B) Social advocacy reports.
C) Human rights reports.
D) Environmental study reports.
117) The Global Reporting Initiative (GRI) is a leading organization in the field of social and
environmental performance measurement. Their widely adopted sustainability reporting
framework includes three universal standards and three sets of topic-specific standards. These
universal standards include all the following except:
A) Performance incentive structure.
B) Stakeholder engagement.
C) Governance.
D) Strategy and analysis disclosure.
118) The Global Reporting Initiative (GRI) is a leading organization in the field of social and
environmental performance measurement. Their widely adopted sustainability reporting
framework includes three universal standards and three sets of topic-specific standards. These
topic-specific standards include all of the following except:
Version 1 48
A) Environmental standards.
B) Customer standards.
C) Economic standards.
D) Social performance standards.
119) The Global Reporting Initiative’s (GRI’s) economic standards pertain to the following
topics:
A) A) Analyzing entry-level wages by gender.
B) B) Executive bonus structures.
C) C) funding employee retirement benefits.
D) D) A and B only.
E) E) A and C only.
120) The Global Reporting Initiative’s (GRI’s) environmental standards pertain to the
following topics:
A) A) Water usage.
B) B) Biodiversity preservation.
C) C) Emissions control.
D) D) A and C only.
E) E) All of the answer options are correct.
121) The Global Reporting Initiative’s (GRI’s) social standards pertain to the following topics:
Version 1 49
A) A) Diversity.
B) B) Labeling.
C) C) Profit sharing.
D) D) A and B only.
E) E) A and C only.
122) The corporate social responsibility measure of “Total workers’ compensation costs” is an
example of which performance measure category?
A) internal business processes.
B) customer.
C) financial.
D) learning and growth.
123) The corporate social responsibility measure of “Percent of raw material inputs that have
been recycled” is an example of which performance measure category?
A) internal business processes.
B) customer.
C) financial.
D) learning and growth.
124) The corporate social responsibility measure of “Pounds of waste produced” is an example
of which performance measure category?
A) internal business processes.
B) customer.
C) financial.
D) learning and growth.
Version 1 50
125) The corporate social responsibility measure of “Number of occupational
injuries/accidents” is an example of which performance measure category?
A) internal business processes.
B) customer.
C) financial.
D) learning and growth.
126) The corporate social responsibility measure of “Percent of customers that strongly agree
with the statement “Your company is committed to environmental stewardship”” is an example
of which performance measure category?
A) internal business processes.
B) customer.
C) financial.
D) learning and growth.
127) The corporate social responsibility measure of “Average compensation for female
employees ÷ average compensation for male employees” is an example of which performance
measure category?
A) internal business processes.
B) customer.
C) financial.
D) learning and growth.
128) A company’s balanced scorecard must emanate from its Performance measures.
Version 1 51
⊚ true
⊚ false
129) For management to be effective, it should focus on business processes, rather than
functional departments, to serve the needs of its customers.
⊚ true
⊚ false
130) The balanced scorecard framework rejects the notion that improving process-oriented
measures automatically leads to financial success.
⊚ true
⊚ false
131) ISO 9000 standards were established to make sure that all consumer products incorporate
specific safety features.
⊚ true
⊚ false
132) External failure costs are limited to the costs of repairing defective products that are
under warranty.
⊚ true
⊚ false
133) To minimize its total quality costs, a company should usually try to redistribute its quality
costs more toward prevention and appraisal.
⊚ true
⊚ false
Version 1 52
134) The most effective way to minimize quality costs while maintaining high quality is to
avoid having quality problems in the first place. This is the reason for incurring appraisal costs.
⊚ true
⊚ false
135) Quality of conformance refers to the extent to which a product offered by one company is
similar to products offered by other companies.
⊚ true
⊚ false
136) The costs of lost sales arising from poor quality are always included in quality cost
reports.
⊚ true
⊚ false
137) A quality cost report is usually compiled by the purchasing department to show the added
costs of purchasing higher quality components.
⊚ true
⊚ false
138) Quality is achieved when a product or service contains all of the features that a customer
would expect, and when that product or service performs in such a way that the customer is
satisfied.
⊚ true
⊚ false
Version 1 53
139) Move time is considered non-value-added time.
⊚ true
⊚ false
140) If the MCE is equal to 0.6, then 60% of the time a unit is in process is spent on activities
that add value to the product.
⊚ true
⊚ false
141) A manager would generally like to see a trend indicating a decrease in setup time.
⊚ true
⊚ false
142) Throughput time is the amount of time required to move a completed unit from the
factory floor to the warehouse.
⊚ true
⊚ false
143) A manufacturing cycle efficiency (MCE) ratio of less than 1.00 is desirable because this
is the ratio of non-value-added time to throughput time.
⊚ true
⊚ false
144) A manufacturing cycle efficiency (MCE) of less than one is impossible.
⊚ true
⊚ false
Version 1 54
145) Queue time is considered non-value-added time.
⊚ true
⊚ false
146) Inspection Time is generally considered to be value-added time.
⊚ true
⊚ false
147) A balanced scorecard consists of a report showing a performance measure such as ROI or
residual income for all of the divisions in a company that generate profits.
⊚ true
⊚ false
148) If a strategy is not working, it should become evident on the balanced scorecard when
some of the predicted effects don’t occur.
⊚ true
⊚ false
149) Financial measures such as ROI are generally better than nonfinancial measures of key
success drivers such as customer satisfaction as leading indicators of future financial
performance.
⊚ true
⊚ false
Version 1 55
150) In essence, a balanced scorecard lays out a theory of how the company can take concrete
actions to attain its desired outcomes. The strategy should seem plausible, but it should be
regarded as only a theory.
⊚ true
⊚ false
151) The performance measures on a balanced scorecard tend to fall into four groups: financial
measures, customer measures, internal business process measures, and learning and growth
measures.
⊚ true
⊚ false
152) Financial measures such as ROI and residual income as well as operating measures may
be included in a balanced scorecard.
⊚ true
⊚ false
153) A balanced scorecard contains both customer and internal business process performance
measures because improvements in internal business process should result in improvements in
customer satisfaction.
⊚ true
⊚ false
154) Incentive compensation for employees, such as bonuses, should be tied to balanced
scorecard performance measures only if managers are confident that the performance measures
are easily manipulated by those being evaluated.
⊚ true
⊚ false
Version 1 56
155) If the balanced scorecard is correctly constructed, the performance measures should be
independent of each other so that bad performance on one measure will not result in bad
performance on another performance measure.
⊚ true
⊚ false
156) Financial measures tend to be lag indicators that report on the results of past actions.
⊚ true
⊚ false
157) If improvement in a performance measure on a balanced scorecard should lead to
improvement in another performance measure, but does not, then employees must work harder.
⊚ true
⊚ false
158) Incentive compensation for employees, such as bonuses, should be tied to balanced
scorecard performance measures regardless of how long the scorecard has been in place.
⊚ true
⊚ false
159) The balanced scorecard can only have four categories of performance measures.
⊚ true
⊚ false
Version 1 57
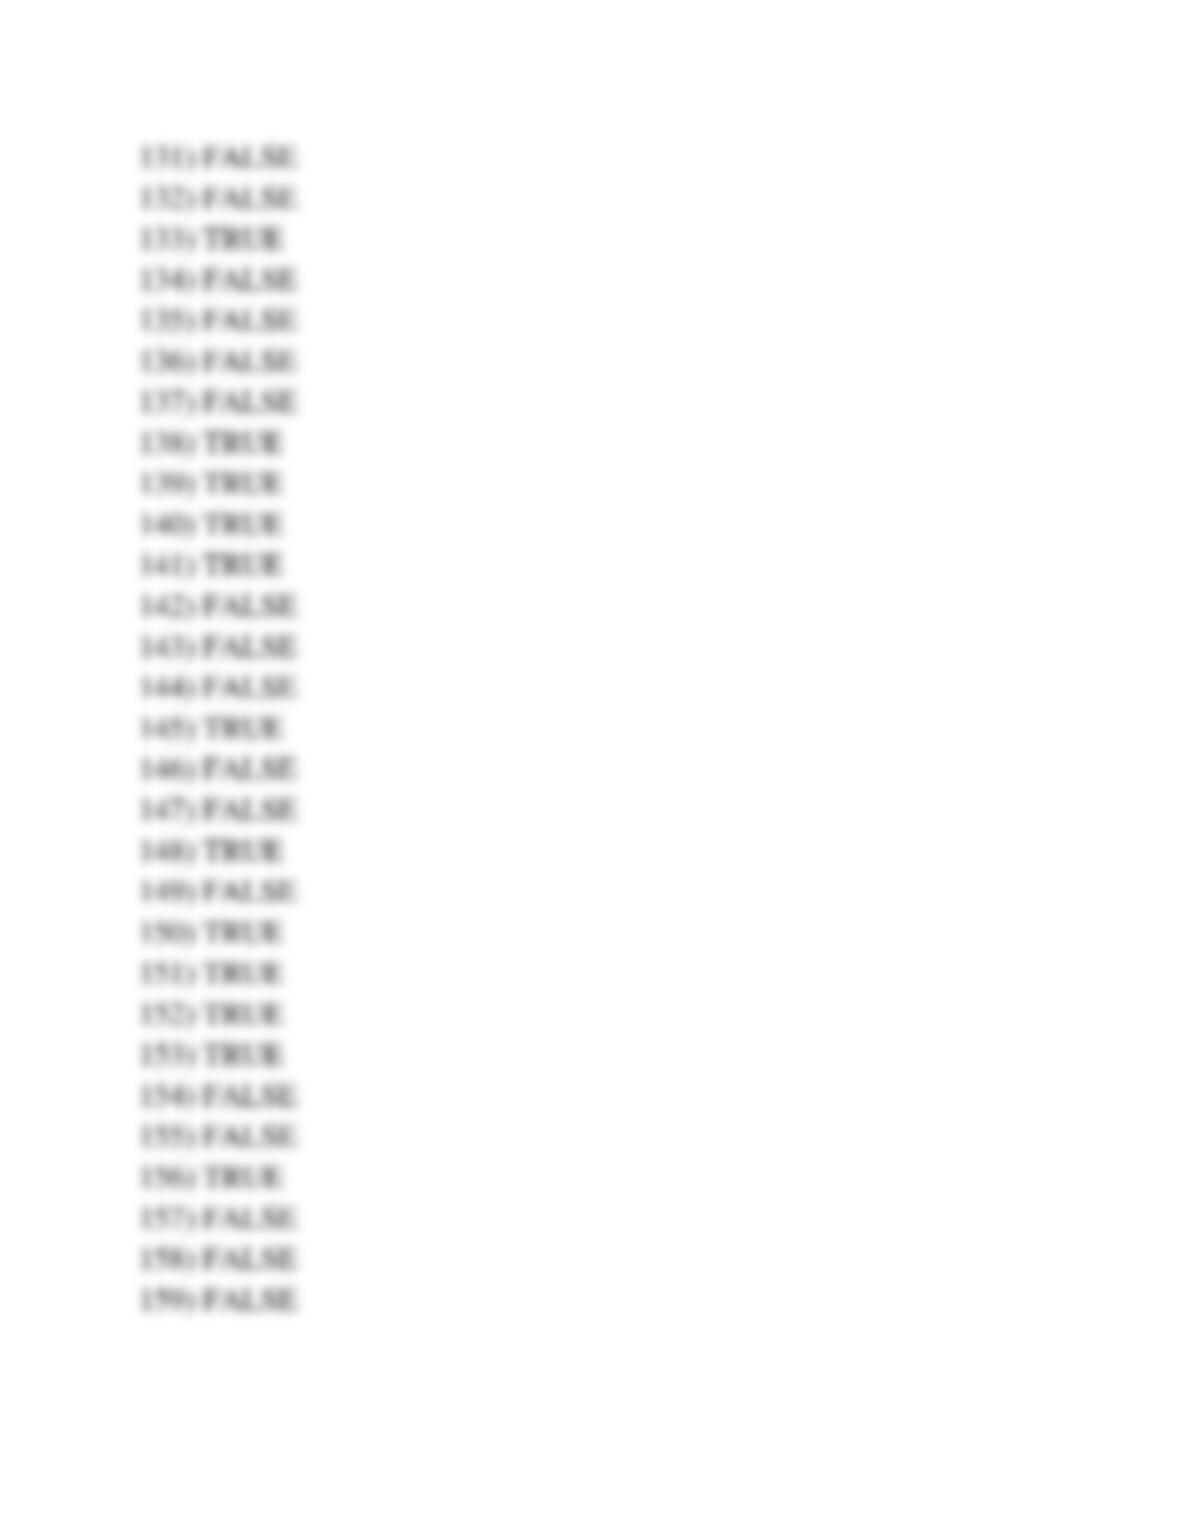
Answer Key
Test name: chapter 12
Version 1 58
Version 1 59
Version 1 60
Version 1 61