Chapter 11
42. Only a single line, which represents the difference between total sales revenues and total costs, is plotted on the profit-
volume graph.
a.
True
b.
False
True
Easy
False
JFND-GO3A-EW4D-NQBT
43. Only a single line, which represents the difference between total sales revenues and total costs, is plotted on the cost-
volume-profit graph.
a.
True
b.
False
False
Easy
False
JFND-GO3A-EW4D-NQBO
CW5N-4P5G-CF1D-CCBW-8FDI-GWN8-EPRW-EMJO-GE4U-OQDD-CW5U-RCJU-
Chapter 11
44. Cost-volume-profit analysis can be presented in both graphically and equation form.
a.
True
b.
False
True
Easy
False
JFND-GO3A-EW4D-NQBZ
GO4W-NQNBEE
45. If a business sells two products, it is not possible to estimate the break-even point.
a.
True
b.
False
False
Easy
False
JFND-GO3A-EW4D-NQBS
GO4W-NQNBEE
Chapter 11
46. If a business sells four products, it is not possible to estimate the break-even point.
a.
True
b.
False
False
Easy
False
JFND-GO3A-EW4D-NQBI
GO4W-NQNBEE
47. Even if a business sells six products, it is possible to estimate the break-even point.
a.
True
b.
False
True
Easy
False
JFND-GO3A-EW4D-NQBW
48. A low operating leverage is normal for highly automated industries.
Chapter 11
a.
True
b.
False
False
Moderate
True / False
False
SACC.WARR.18.11-5 – LO: 11.05
United States – BUSPROG: Analytic
Bloom’s: Understanding
7/19/2016 10:17 AM
7/19/2016 10:17 AM
JFND-GO3A-EW4D-NQKN
49. DeGiaimo Co. has an operating leverage of 5. If next year’s sales are expected to increase by 10%, then the company’s
operating income will increase by 50%.
a.
True
b.
False
True
Moderate
True / False
False
SACC.WARR.18.11-5 – LO: 11.05
United States – BUSPROG: Analytic
United States – AK – DISC: IMA: Cost Management
Bloom’s: Applying
7/19/2016 10:17 AM
7/19/2016 10:17 AM
JFND-GO3A-EW4D-NQKB
50. If the unit selling price is $40, the volume of sales is $3,000,000, sales at the break-even point amount to $2,500,000,
and the maximum possible sales are $3,300,000, the margin of safety will be 12,500 units.
Chapter 11
a.
True
b.
False
True
Moderate
False
JFND-GO3A-EW4D-NQJ3
51. If the unit selling price is $50, the volume of sales is $450,000, sales at the break-even point amount to $375,000, and
the maximum possible sales are $550,000, the margin of safety will be 2,000 units.
a.
True
b.
False
False
Moderate
False
JFND-GO3A-EW4D-NQJA
52. If the volume of sales is $4,000,000 and sales at the break-even point amount to $3,200,000, the margin of safety will
be 20%.
Chapter 11
a.
True
b.
False
True
Moderate
False
JFND-GO3A-EW4D-NQKG
53. If the volume of sales is $6,000,000 and sales at the break-even point amount to $4,800,000, the margin of safety will
be 25%.
a.
True
b.
False
False
Moderate
False
JFND-GO3A-EW4D-NQKF
54. If the volume of sales is $6,000,000 and sales at the break-even point amount to $5,000,000, the margin of safety will
be 20%.
Chapter 11
a.
True
b.
False
False
Moderate
True / False
False
SACC.WARR.18.11-7 – LO: 11.07
United States – BUSPROG: Analytic
Bloom’s: Applying
7/19/2016 10:17 AM
7/19/2016 10:17 AM
JFND-GO3A-EW4D-NQKR
55. Cost behavior refers to the manner in which:
a.
a cost changes as the related activity changes.
b.
a cost is allocated to products.
c.
a cost is used in setting selling prices.
d.
a cost is estimated.
a
Easy
Multiple Choice
False
SACC.WARR.18.11-1 – LO: 11.01
United States – BUSPROG: Analytic
Bloom’s: Remembering
7/19/2016 10:17 AM
7/19/2016 10:17 AM
JFND-GO3A-EW4D-NQKD
Chapter 11
56. Costs that remain constant on a per-unit level as the level of activity changes are called:
a.
fixed costs.
b.
mixed costs.
c.
opportunity costs.
d.
variable costs.
Multiple Choice
SACC.WARR.18.11-1 – LO: 11.01
United States – BUSPROG: Analytic
United States – AK – DISC: IMA: Cost Management
Bloom’s: Remembering
7/19/2016 10:17 AM
7/19/2016 10:17 AM
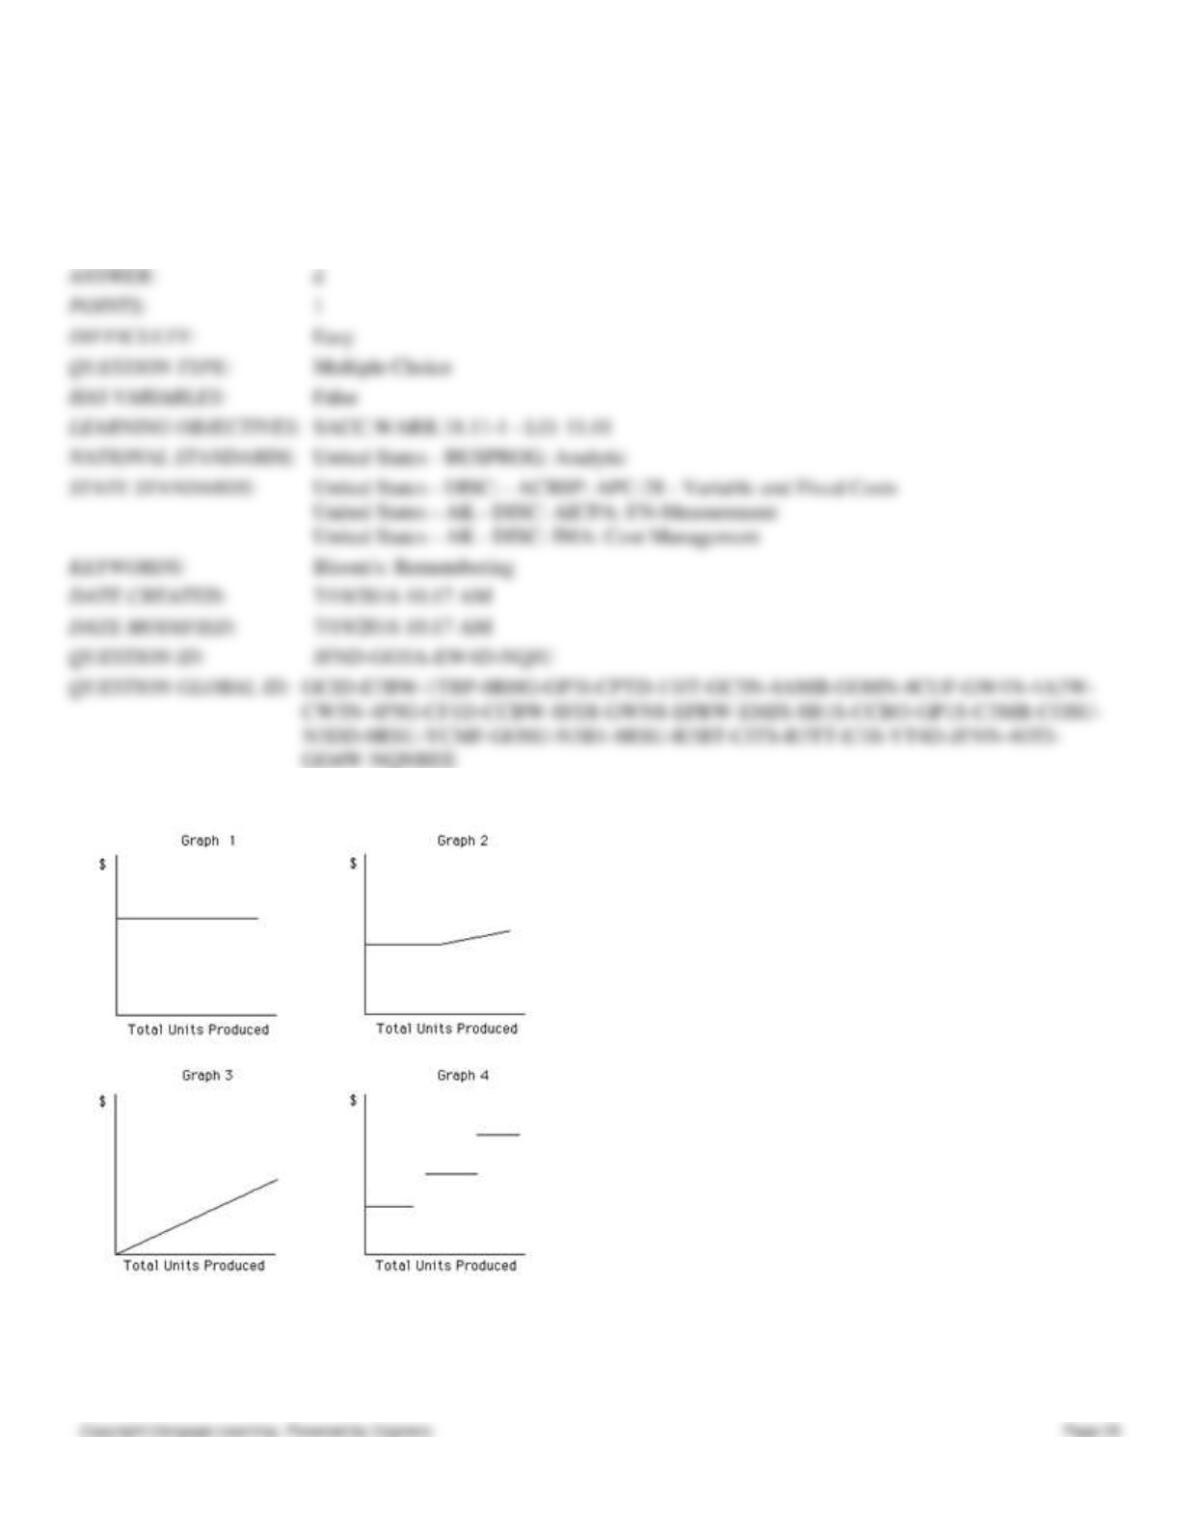
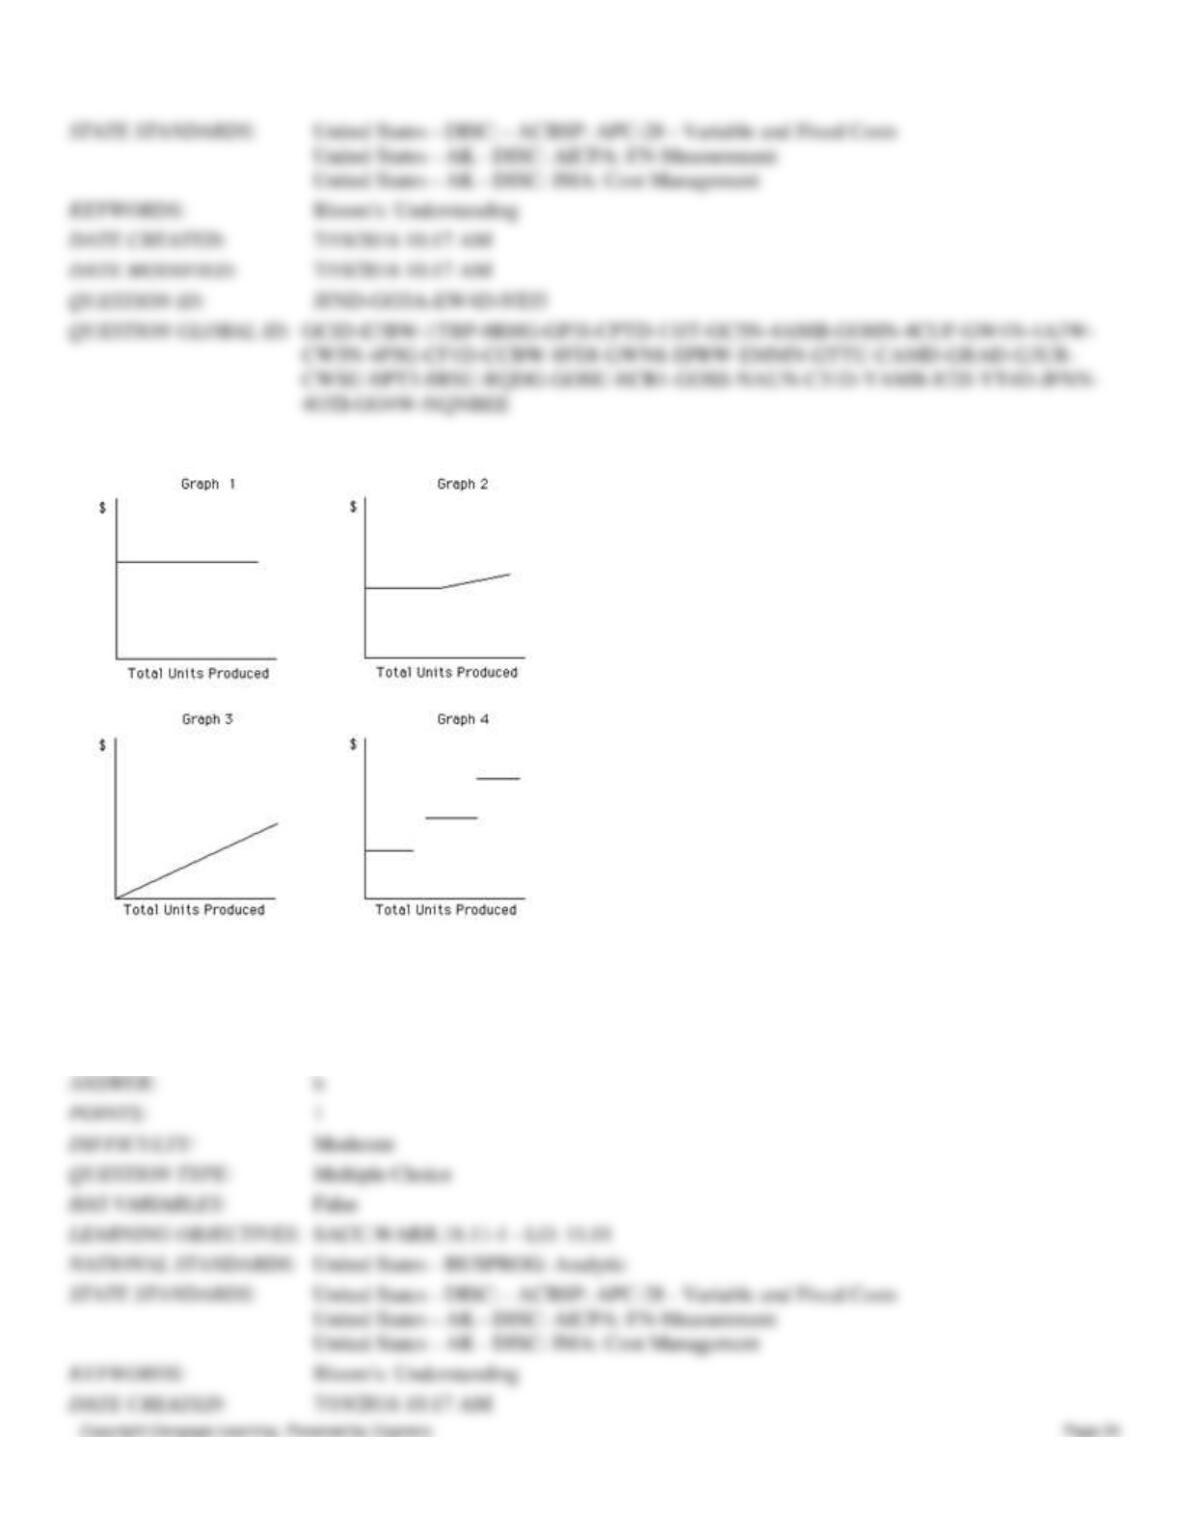
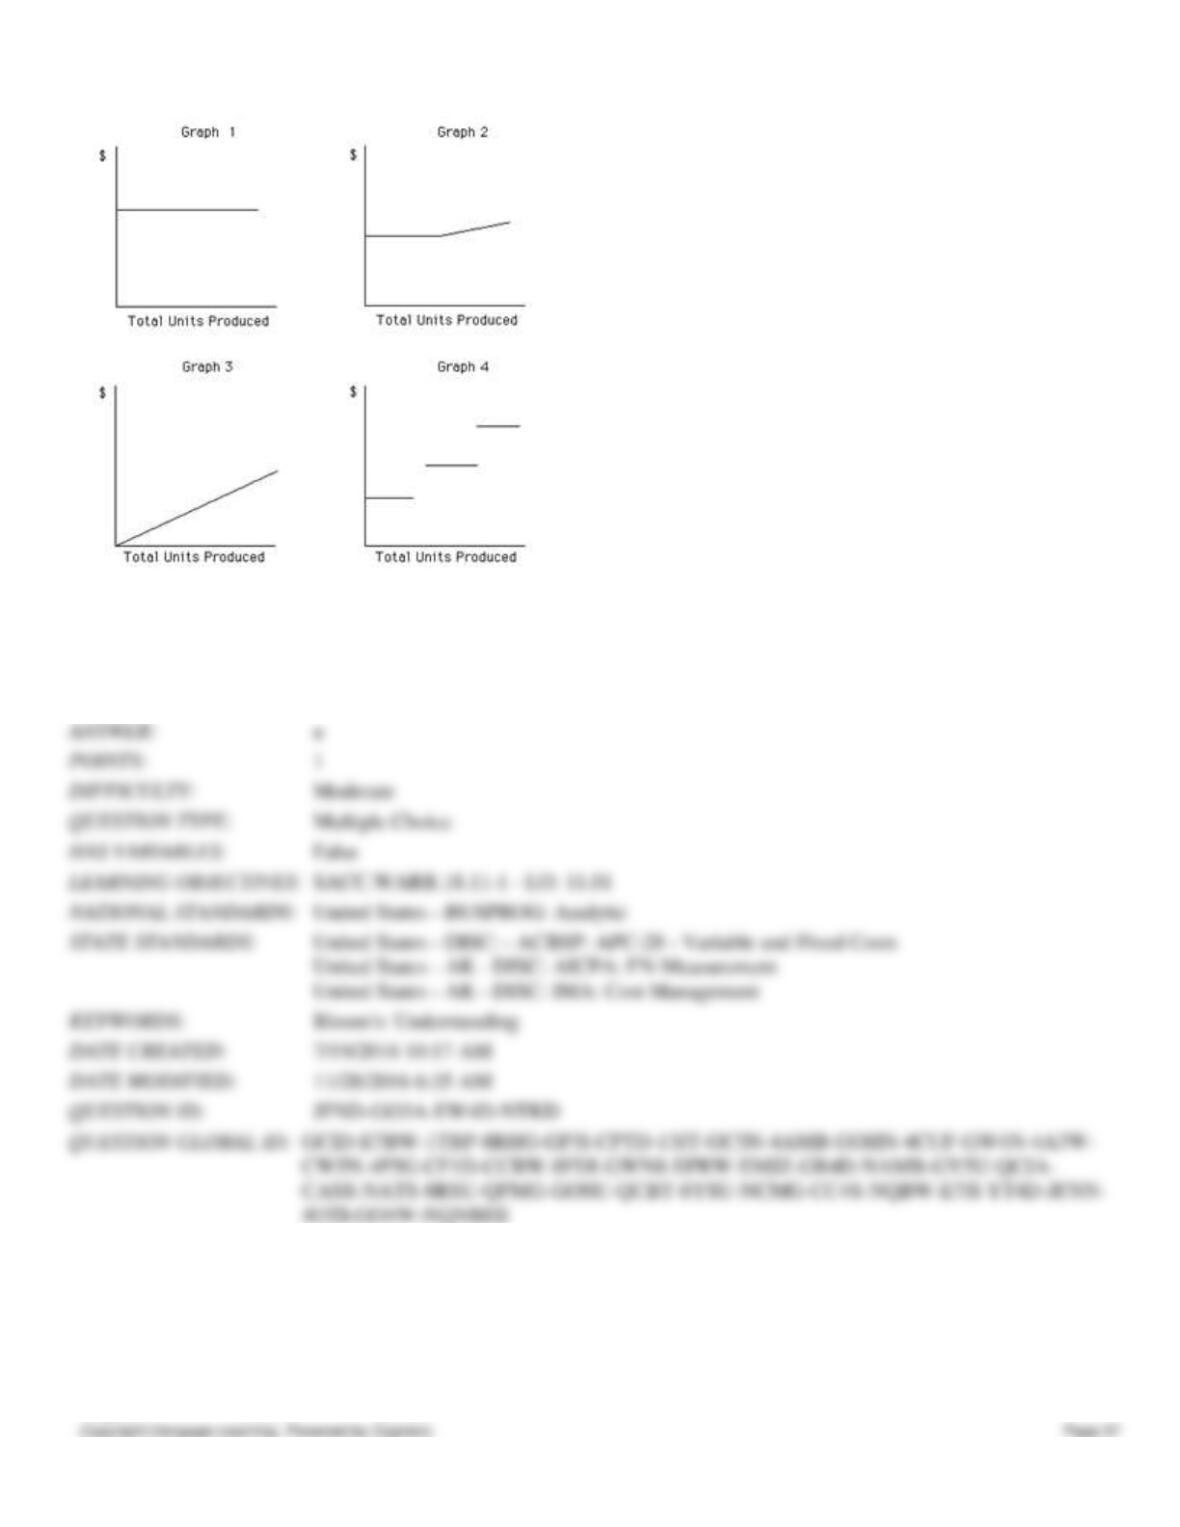
57. Which of the following graphs illustrates the behavior of a total fixed cost within the specified relevant range?
a.
Graph 2
b.
Graph 3
c.
Graph 4
Chapter 11
d.
Graph 1
Multiple Choice
SACC.WARR.18.11-1 – LO: 11.01
United States – BUSPROG: Analytic
Bloom’s: Understanding
7/19/2016 10:17 AM
11/28/2016 6:39 AM
58. Which of the following costs is an example of a fixed cost?
a.
Direct labor cost
b.
Insurance cost
c.
Commission paid
d.
Capital stock
Multiple Choice
SACC.WARR.18.11-1 – LO: 11.01
United States – BUSPROG: Analytic
United States – AK – DISC: IMA: Cost Management
Bloom’s: Understanding
7/19/2016 10:17 AM
11/25/2016 6:43 AM
59. Which of the following is true of a variable cost?
Chapter 11
a.
Total variable cost remains constant with changes in the number of goods sold.
b.
Unit variable cost decreases with an increase in production.
c.
Unit variable cost remains constant with changes in production.
d.
Total variable cost decreases with an increase in the number of goods sold.
Multiple Choice
SACC.WARR.18.11-1 – LO: 11.01
United States – BUSPROG: Analytic
United States – AK – DISC: IMA: Cost Management
Bloom’s: Understanding
7/19/2016 10:17 AM
11/27/2016 4:34 AM
60. Which of the following activity bases would be the most appropriate for food costs of a hospital?
a.
Number of cooks scheduled to work
b.
Number of x-rays taken
c.
Number of patients who are admitted in the hospital
d.
Number of scheduled surgeries
Multiple Choice
SACC.WARR.18.11-1 – LO: 11.01
United States – BUSPROG: Analytic
Bloom’s: Applying
7/19/2016 10:17 AM
7/19/2016 10:17 AM
Chapter 11
61. Which of the following activity bases would be the most appropriate for gasoline costs of a delivery service such as
UPS?
a.
Number of trucks employed
b.
Number of miles driven
c.
Number of trucks in service
d.
Number of packages delivered
Multiple Choice
SACC.WARR.18.11-1 – LO: 11.01
United States – BUSPROG: Analytic
Bloom’s: Applying
7/19/2016 10:17 AM
7/19/2016 10:17 AM
62. The electricity expense in a production plant is an example of a:
a.
variable cost.
b.
margin cost.
c.
fixed cost.
d.
distribution cost.
Multiple Choice
SACC.WARR.18.11-1 – LO: 11.01
United States – BUSPROG: Analytic
Bloom’s: Understanding
7/19/2016 10:17 AM
11/25/2016 6:44 AM
Chapter 11
63. Which of the following is an example of a cost that varies in proportion to changes in the activity base?
a.
Depreciation on machinery
b.
Packaging cost
c.
Factory rent
d.
Insurance cost
Moderate
Multiple Choice
False
SACC.WARR.18.11-1 – LO: 11.01
United States – BUSPROG: Analytic
United States – AK – DISC: IMA: Cost Management
Bloom’s: Understanding
7/19/2016 10:17 AM
11/25/2016 6:45 AM
JFND-GO3A-EW4D-NQJW
GO4W-NQNBEE
64. Under direct costing, only _____ manufacturing costs are included in the product cost.
a.
variable
b.
fixed
c.
capitalized
d.
notional
a
Easy
Multiple Choice
False
SACC.WARR.18.11-1 – LO: 11.01
United States – BUSPROG: Analytic
United States – AK – DISC: IMA: Cost Management
JFND-GO3A-EW4D-NQJI
Chapter 11
65. Which of the following is true about the changes in fixed cost?
a.
An increase in production will result in an increase in per unit fixed cost.
b.
A decrease in fixed cost will result in an increase in variable cost.
c.
An increase in production will result in a decrease in per unit fixed cost.
d.
A decrease in production will result in an increase in total fixed cost.
Multiple Choice
SACC.WARR.18.11-1 – LO: 11.01
United States – BUSPROG: Analytic
United States – AK – DISC: IMA: Cost Management
Bloom’s: Understanding
7/19/2016 10:17 AM
7/19/2016 10:17 AM
66. Which of the following statements is true regarding fixed and variable costs?
a.
Both costs are constant when considered on a per-unit basis.
b.
Both costs are constant when considered on a total basis.
c.
Fixed costs are fixed in total, and variable costs are fixed per unit.
d.
Variable costs are fixed in total, and fixed costs vary in total.
Multiple Choice
SACC.WARR.18.11-1 – LO: 11.01
United States – BUSPROG: Analytic
Bloom’s: Remembering
7/19/2016 10:17 AM
11/25/2016 6:45 AM
Chapter 11
67. Which of the following graphs illustrates the behavior of a total variable cost?
a.
Graph 2
b.
Graph 3
c.
Graph 4
d.
Graph 1
Multiple Choice
SACC.WARR.18.11-1 – LO: 11.01
United States – BUSPROG: Analytic
Bloom’s: Understanding
7/19/2016 10:17 AM
United States – AK – DISC: IMA: Cost Management
Bloom’s: Understanding
7/19/2016 10:17 AM
7/19/2016 10:17 AM
Chapter 11
68. The graph of a variable cost per unit when plotted against its related activity base appears as a:
a.
circle.
b.
rectangle.
c.
straight line.
d.
curved line.
c
Moderate
Multiple Choice
False
SACC.WARR.18.11-1 – LO: 11.01
United States – BUSPROG: Analytic
Bloom’s: Understanding
7/19/2016 10:17 AM
7/19/2016 10:17 AM
JFND-GO3A-EW4D-NTKG
69. _____ per unit increases or decreases in inverse proportion to its activity level.
a.
Variable cost
b.
Opportunity cost
c.
Contribution cost
d.
Fixed cost
Easy
Multiple Choice
False
SACC.WARR.18.11-1 – LO: 11.01
United States – BUSPROG: Analytic
United States – AK – DISC: AICPA: FN-Measurement
11/28/2016 6:37 AM
JFND-GO3A-EW4D-NTJA
Chapter 11
70. Knowing how costs behave to change in the level of activity is useful to management for all the following reasons
except for:
a.
predicting customer demand.
b.
predicting profits as sales and production volumes change.
c.
estimating costs.
d.
changing an existing product production.
Multiple Choice
SACC.WARR.18.11-1 – LO: 11.01
United States – BUSPROG: Analytic
Bloom’s: Understanding
7/19/2016 10:17 AM
7/19/2016 10:17 AM
71. Which of the following graphs illustrates the nature of a mixed cost?
United States – AK – DISC: IMA: Cost Management
Bloom’s: Understanding
7/19/2016 10:17 AM
11/25/2016 6:47 AM
Chapter 11
a.
Graph 2
b.
Graph 3
c.
Graph 4
d.
Graph 1
Multiple Choice
SACC.WARR.18.11-1 – LO: 11.01
United States – BUSPROG: Analytic
United States – AK – DISC: IMA: Cost Management
Bloom’s: Understanding
7/19/2016 10:17 AM
11/28/2016 6:35 AM
72. Based on the following information, calculate fixed costs per month using the high-low method.
Cost
Machine Hours
May
$56,000
22,000
June
76,000
32,000
July
58,000
26,000
August
66,000
24,000
Chapter 11
a.
$12,000
b.
$11,000
c.
$10,000
d.
$9,000
a
Moderate
Multiple Choice
False
SACC.WARR.18.11-1 – LO: 11.01
United States – BUSPROG: Analytic
Bloom’s: Applying
7/19/2016 10:17 AM
11/27/2016 4:11 AM
JFND-GO3A-EW4D-NTJU
73. Which of the following is an example of a mixed cost?
a.
Depreciation on factory machinery
b.
Direct material cost
c.
Maintenance expense
d.
Property tax
c
Moderate
Multiple Choice
False
SACC.WARR.18.11-1 – LO: 11.01
United States – BUSPROG: Analytic
Bloom’s: Understanding
7/19/2016 10:17 AM
11/25/2016 6:48 AM
CW5N-4P5G-CF1D-CCBW-8FDI-GWN8-EPRW-EMMG-COAS-NPTT-8R5U-O3UD–
Chapter 11
74. Using the high-low method, calculate variable utilities costs per machine hour.
Cost
Machine Hours
January
$ 8,200
14,900
February
13,600
21,200
March
5,600
5,200
April
9,400
17,900
a.
$0.33
b.
$0.64
c.
$0.50
d.
$0.25
c
Moderate
Multiple Choice
False
SACC.WARR.18.11-1 – LO: 11.01
United States – BUSPROG: Analytic
United States – AK – DISC: IMA: Cost Management
Bloom’s: Applying
7/19/2016 10:17 AM
11/28/2016 3:10 AM
JFND-GO3A-EW4D-NTJT
GO4W-NQNBEE
75. Which of the following statements is true if the number of units produced decreases?
a.
The total variable cost remains constant.
b.
The total variable cost decreases.
c.
The variable cost per unit decreases.
d.
The variable cost per unit increases.
Easy
Multiple Choice
False
SACC.WARR.18.11-1 – LO: 11.01
United States – BUSPROG: Analytic
Chapter 11
76. ABC Co. manufactures pens. During the most productive month of the year, 3,650 pens were manufactured at a total
cost of $84,550. During its slowest month, the company made 1,250 pens at a cost of $46,150. Calculate the total fixed
cost using the high-low method of cost estimation.
a.
$25,650
b.
$28,300
c.
$26,150
d.
$27,800
c
Moderate
Multiple Choice
False
SACC.WARR.18.11-1 – LO: 11.01
United States – BUSPROG: Analytic
United States – AK – DISC: IMA: Cost Management
Bloom’s: Applying
7/19/2016 10:17 AM
11/25/2016 6:49 AM
JFND-GO3A-EW4D-NTJZ
77. For the purpose of analysis, mixed costs are generally:
a.
classified as fixed costs.
b.
classified as variable costs.
c.
classified as period costs.
d.
separated into their variable and fixed cost components.
Easy
United States – AK – DISC: IMA: Cost Management
Bloom’s: Understanding
7/19/2016 10:17 AM
11/25/2016 6:49 AM
JFND-GO3A-EW4D-NTJO
4OTI-GO4W-NQNBEE