51.
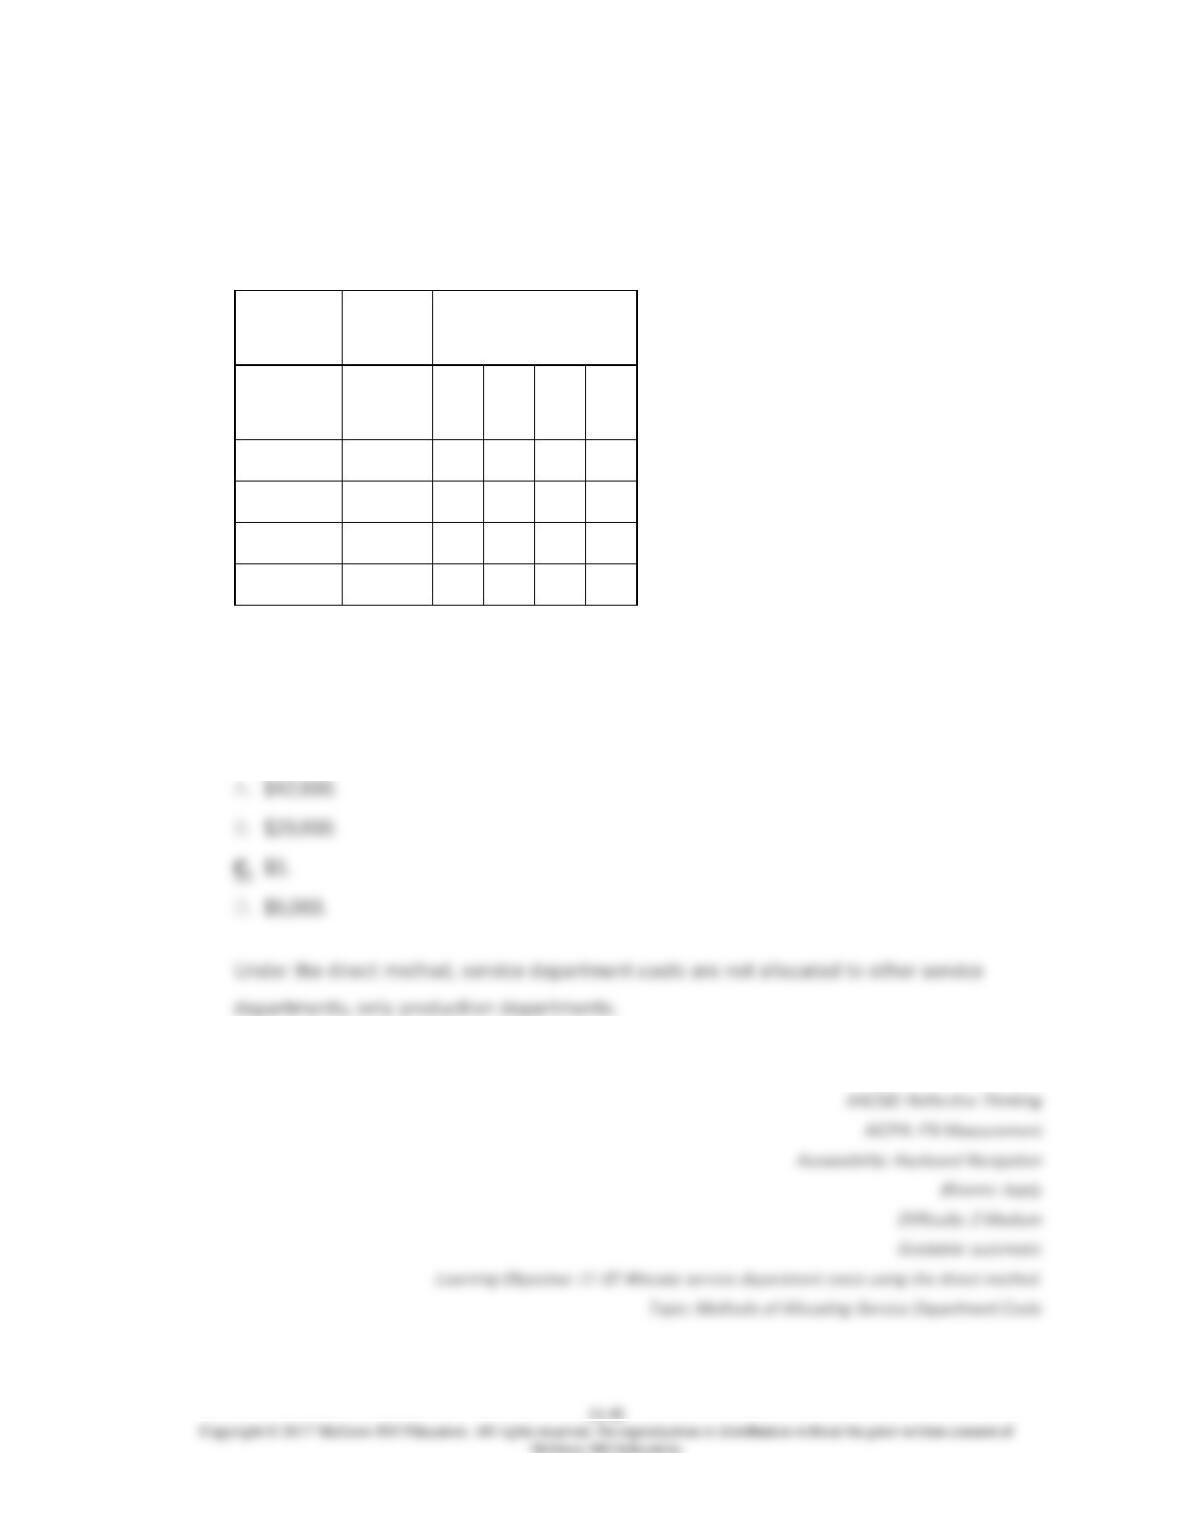
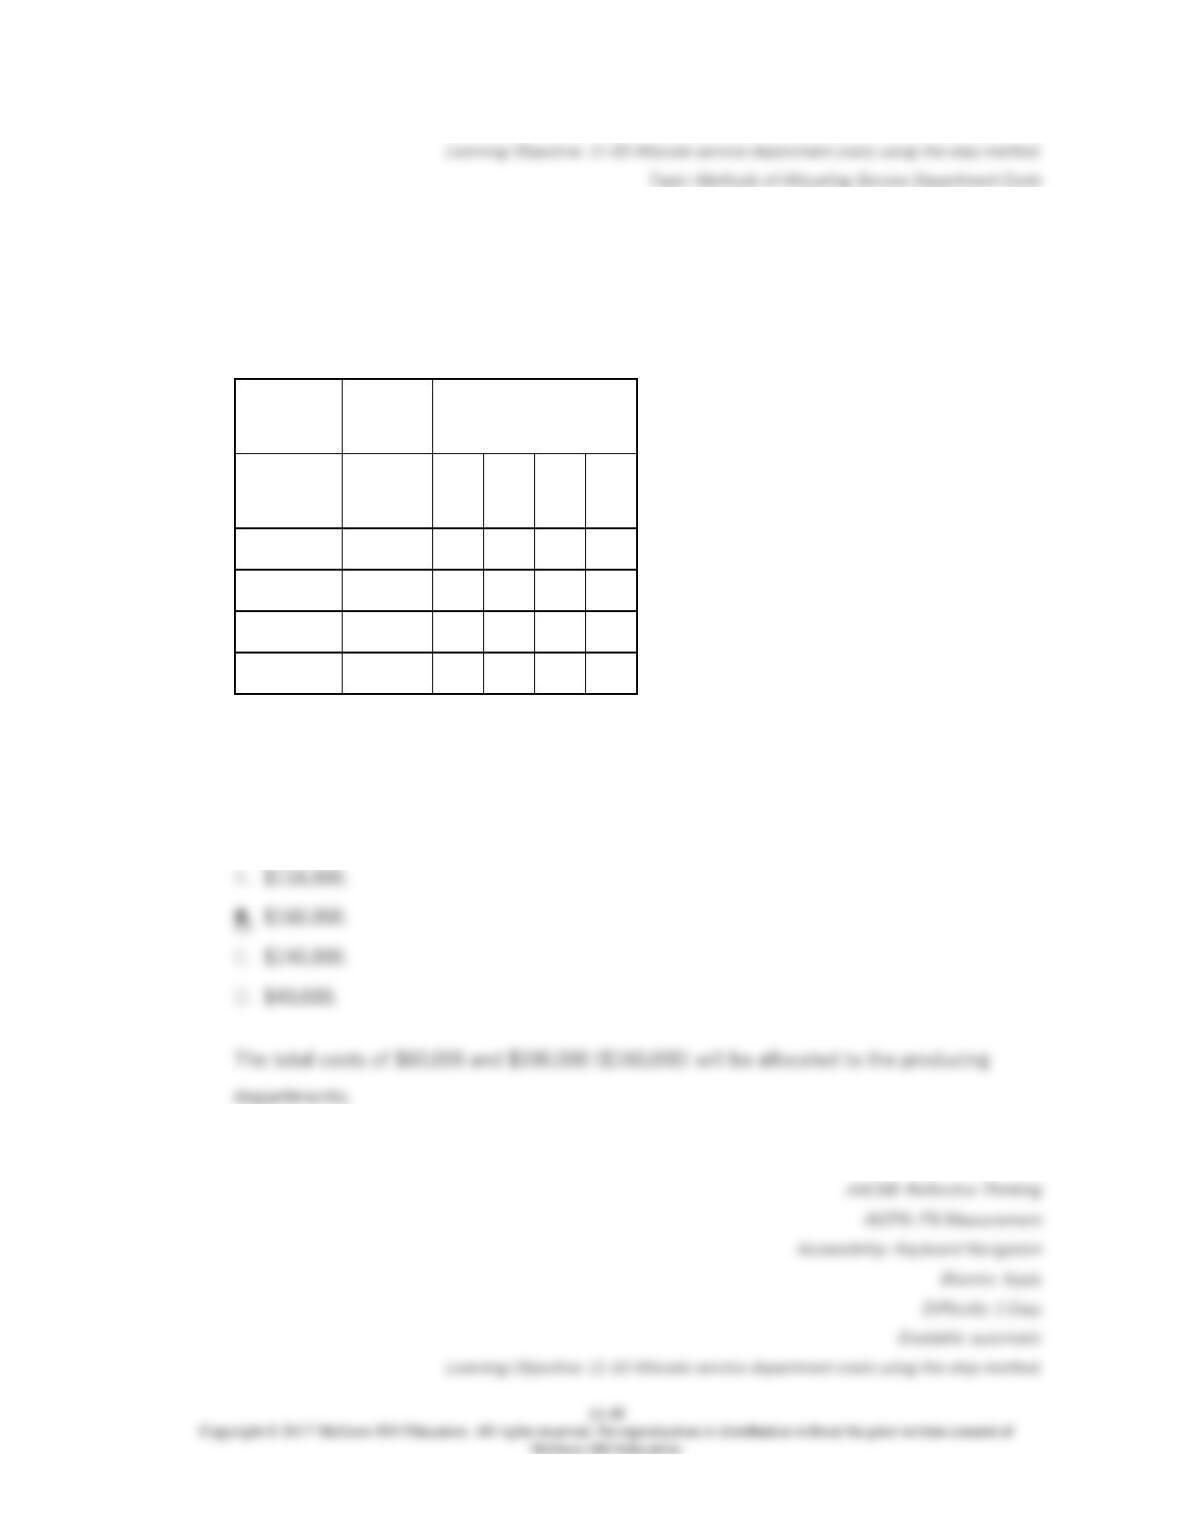
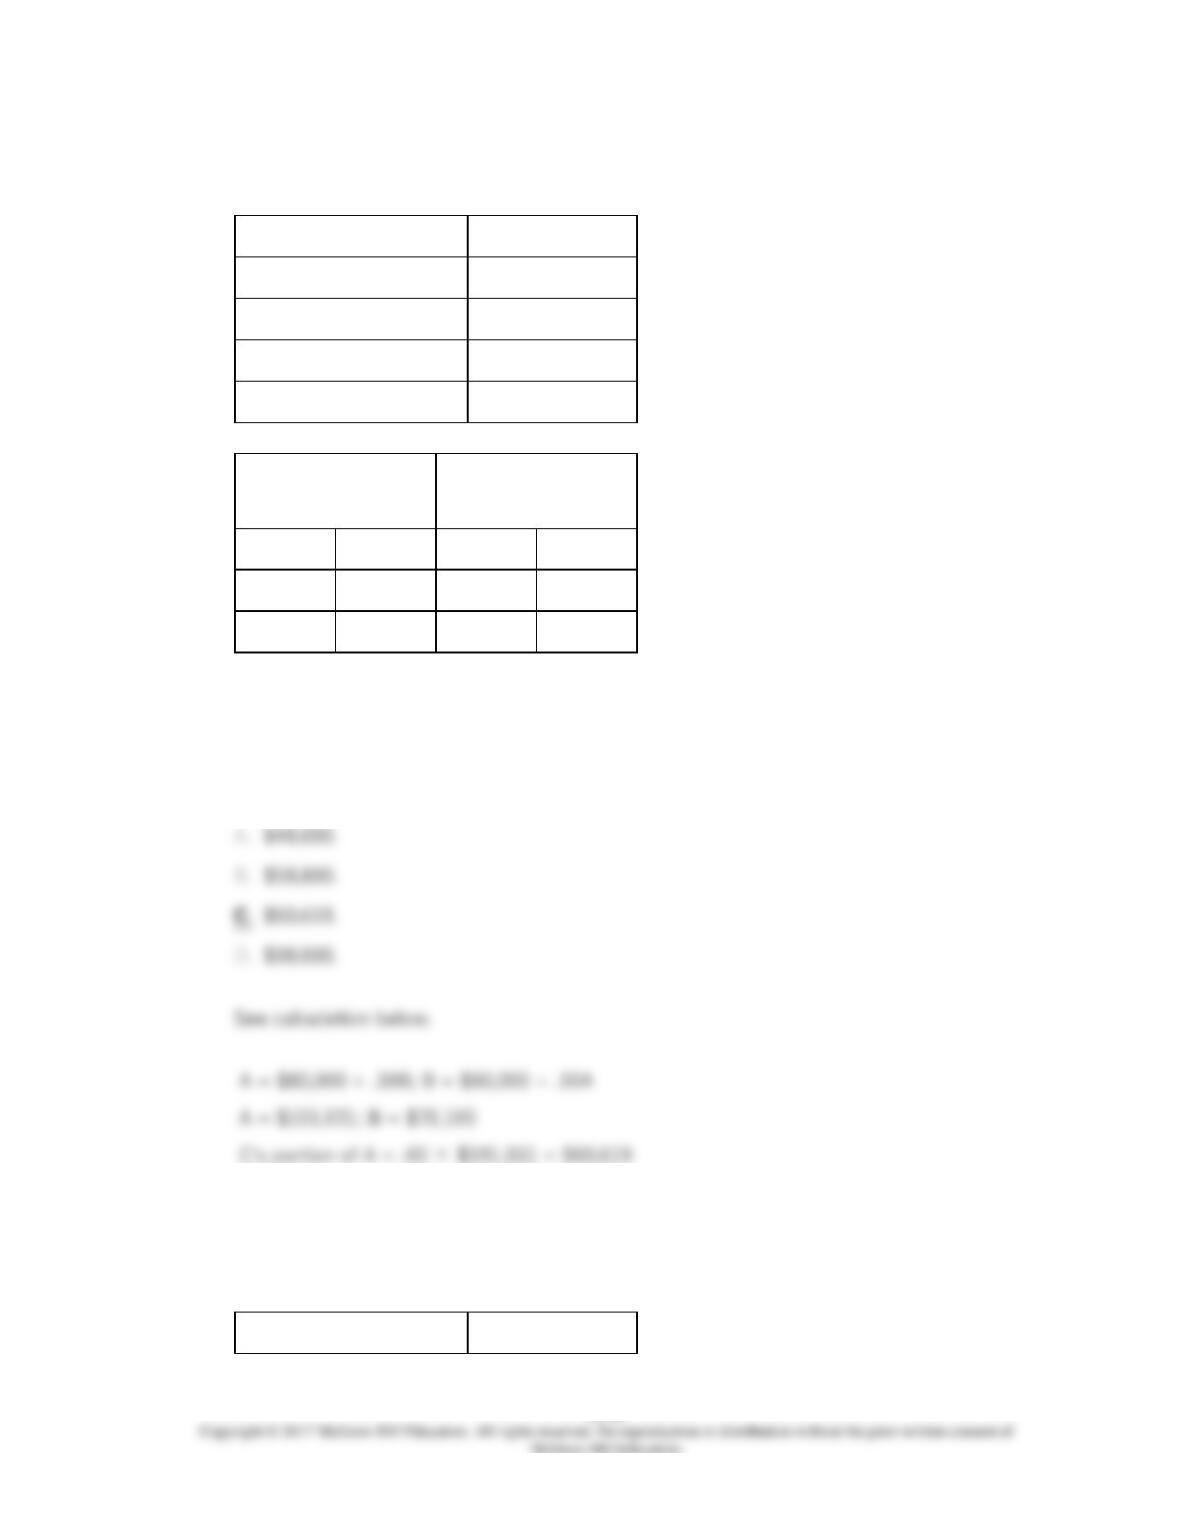
Cordner Corporation has two production Departments: P1 and P2 and two service
departments: S1 and S2. Direct costs for each department and the proportion of service
costs used by the various departments for the month of July are as follows:
Proportion of Services
Used by:
Department
Direct
costs
S1
S2
P1
P2
S1
$60,000
0.70
0.10
0.20
S2
$100,000
0.20
0.30
0.50
P1
$160,000
P2
$140,000
Under the direct-method of cost allocation, the amount of S1 costs allocated to the S2
would be:
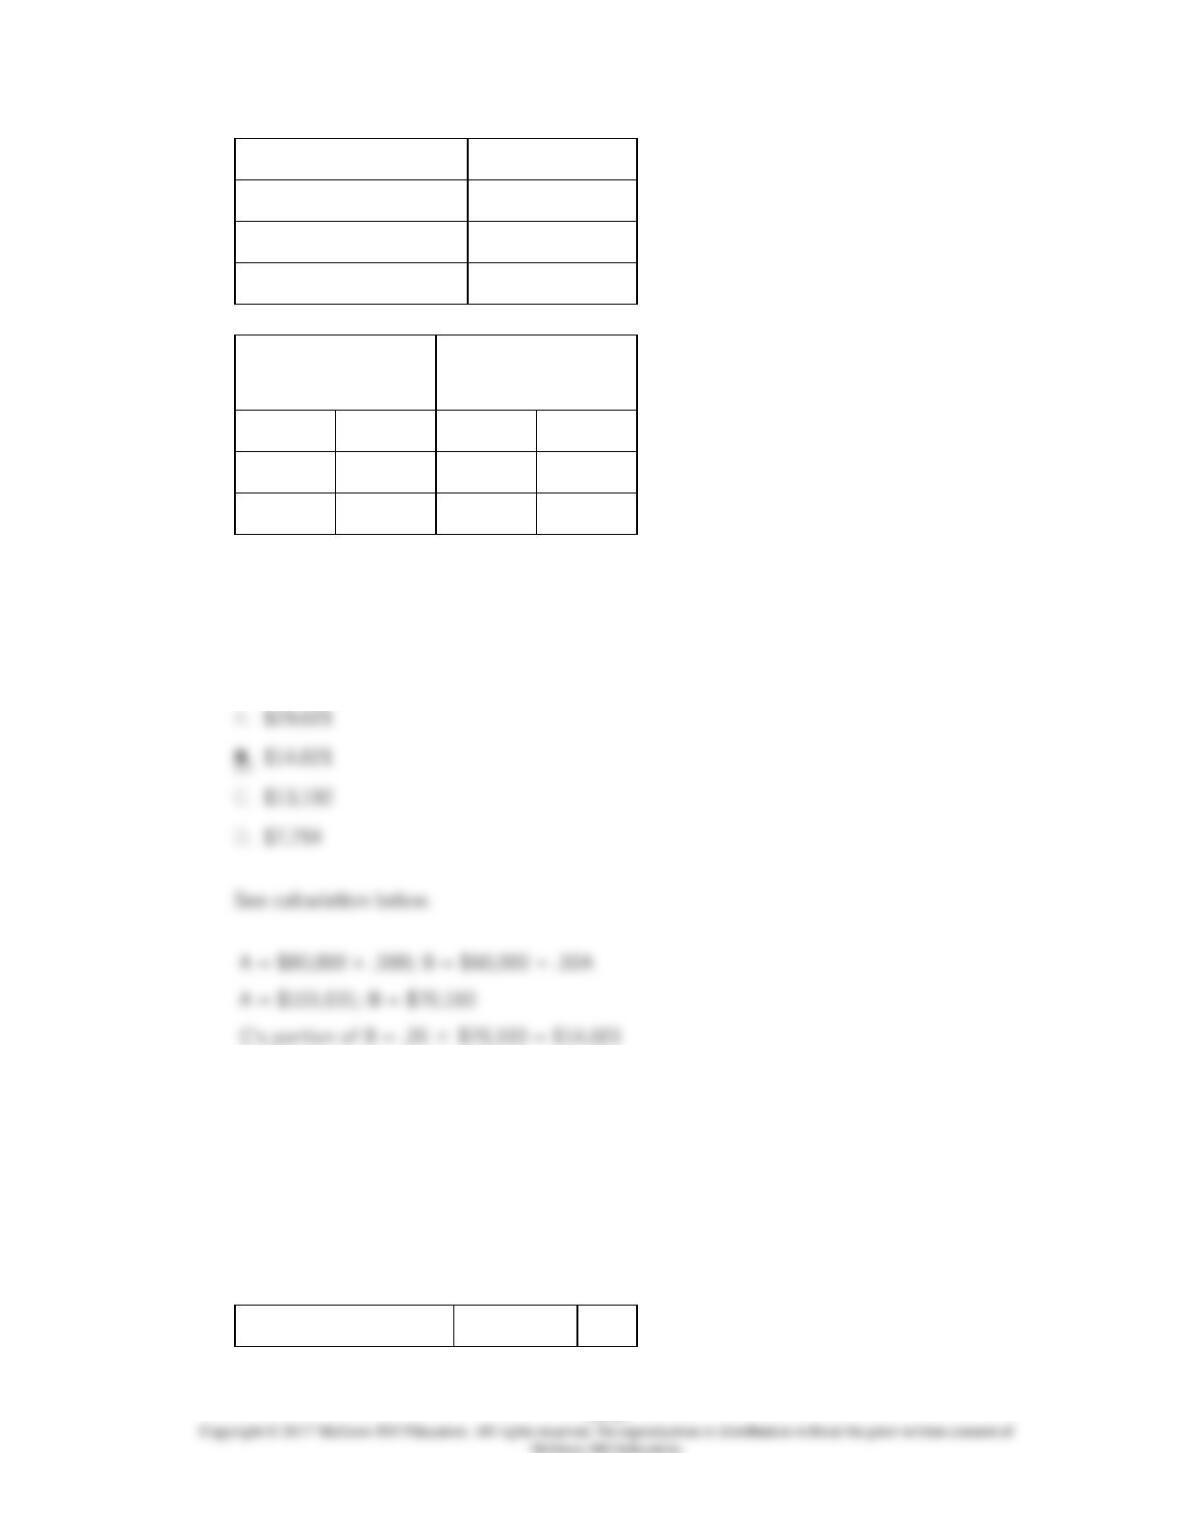
52.
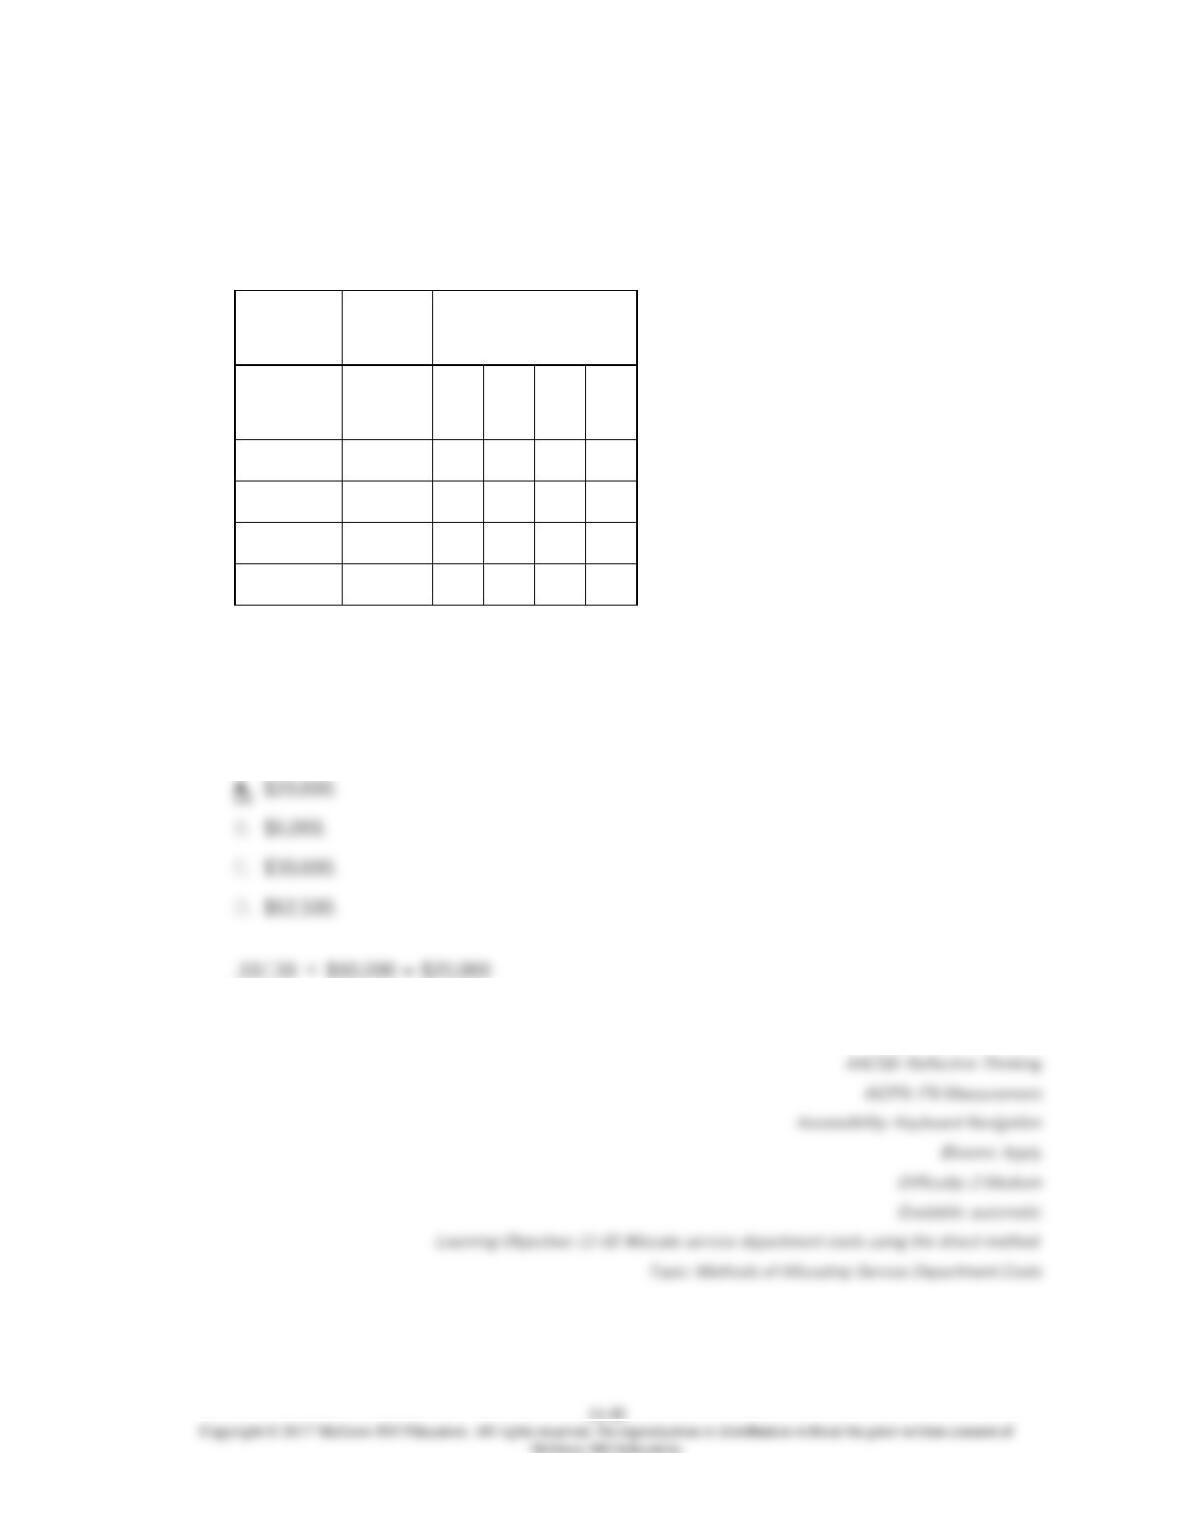
Cordner Corporation has two production Departments: P1 and P2 and two service
departments: S1 and S2. Direct costs for each department and the proportion of service
costs used by the various departments for the month of July are as follows:
Proportion of Services
Used by:
Department
Direct
costs
S1
S2
P1
P2
S1
$60,000
0.70
0.10
0.20
S2
$100,000
0.20
0.30
0.50
P1
$160,000
P2
$140,000
Under the direct-method of cost allocation, the amount of S1 costs allocated to P1 would
be:
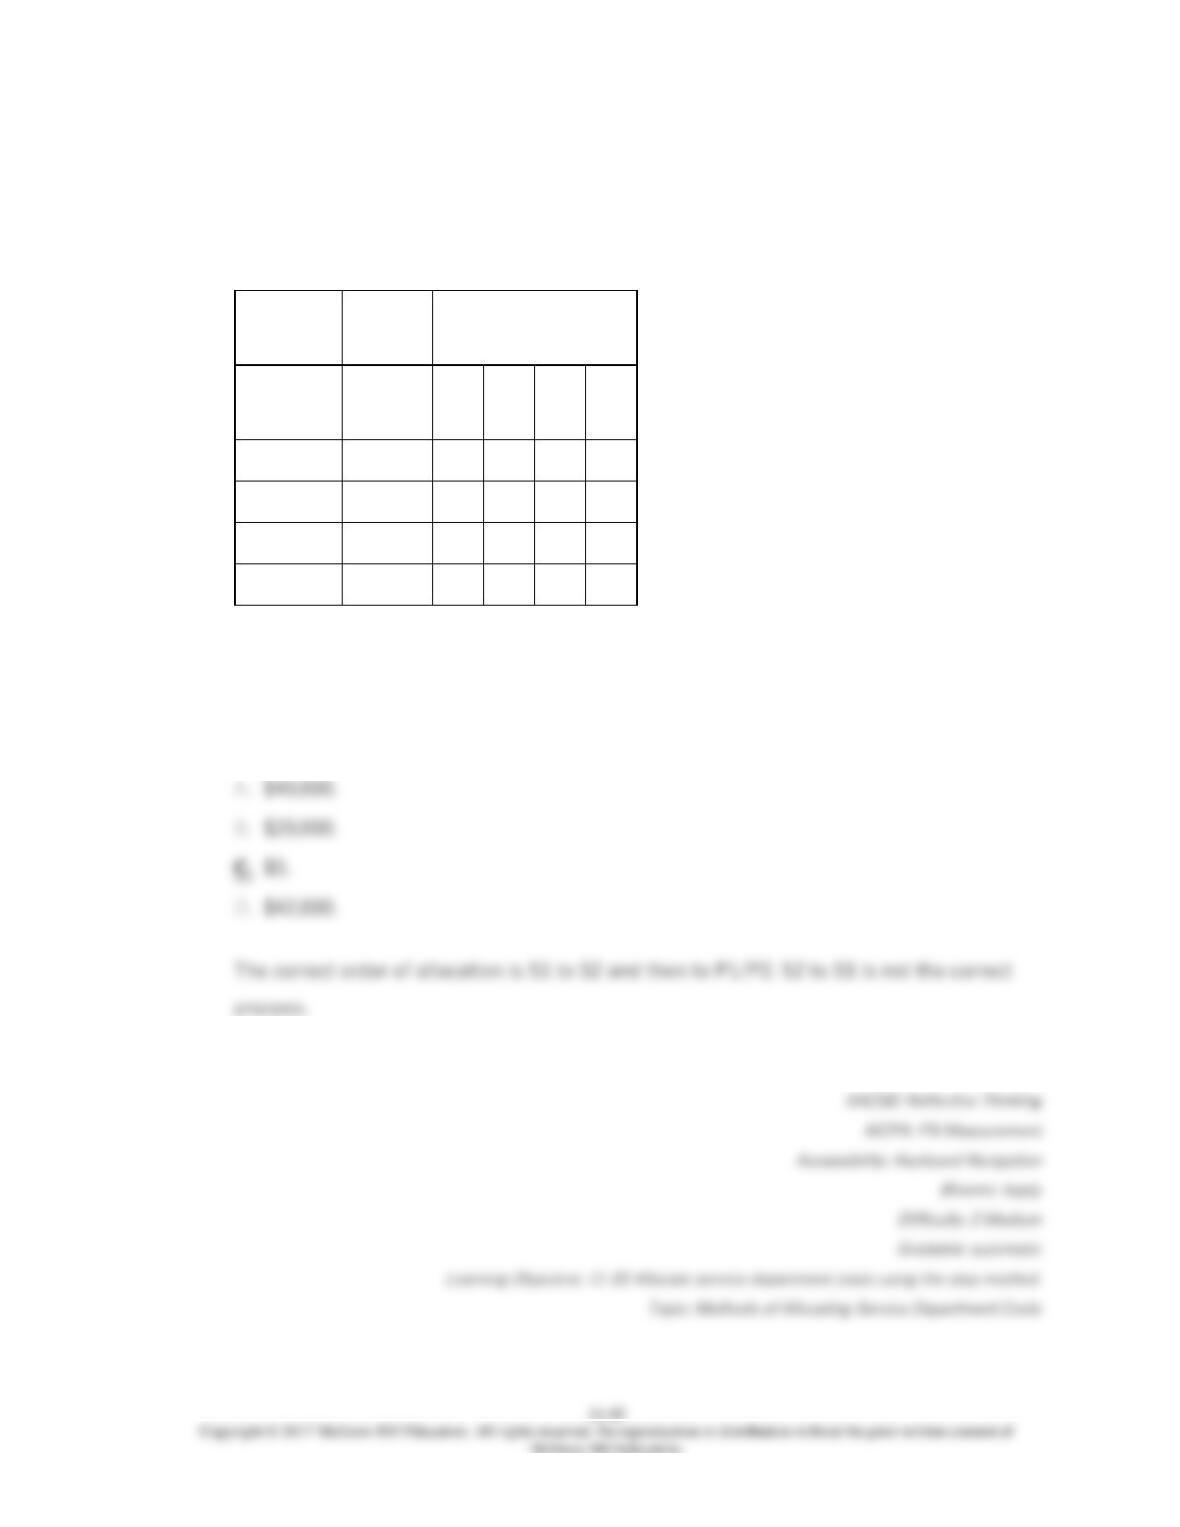
53.
Cordner Corporation has two production Departments: P1 and P2 and two service
departments: S1 and S2. Direct costs for each department and the proportion of service
costs used by the various departments for the month of July are as follows:
Proportion of Services
Used by:
Department
Direct
costs
S1
S2
P1
P2
S1
$60,000
0.70
0.10
0.20
S2
$100,000
0.20
0.30
0.50
P1
$160,000
P2
$140,000
Under the step-method of cost allocation, the amount of S2 costs allocated to S1 would
be:
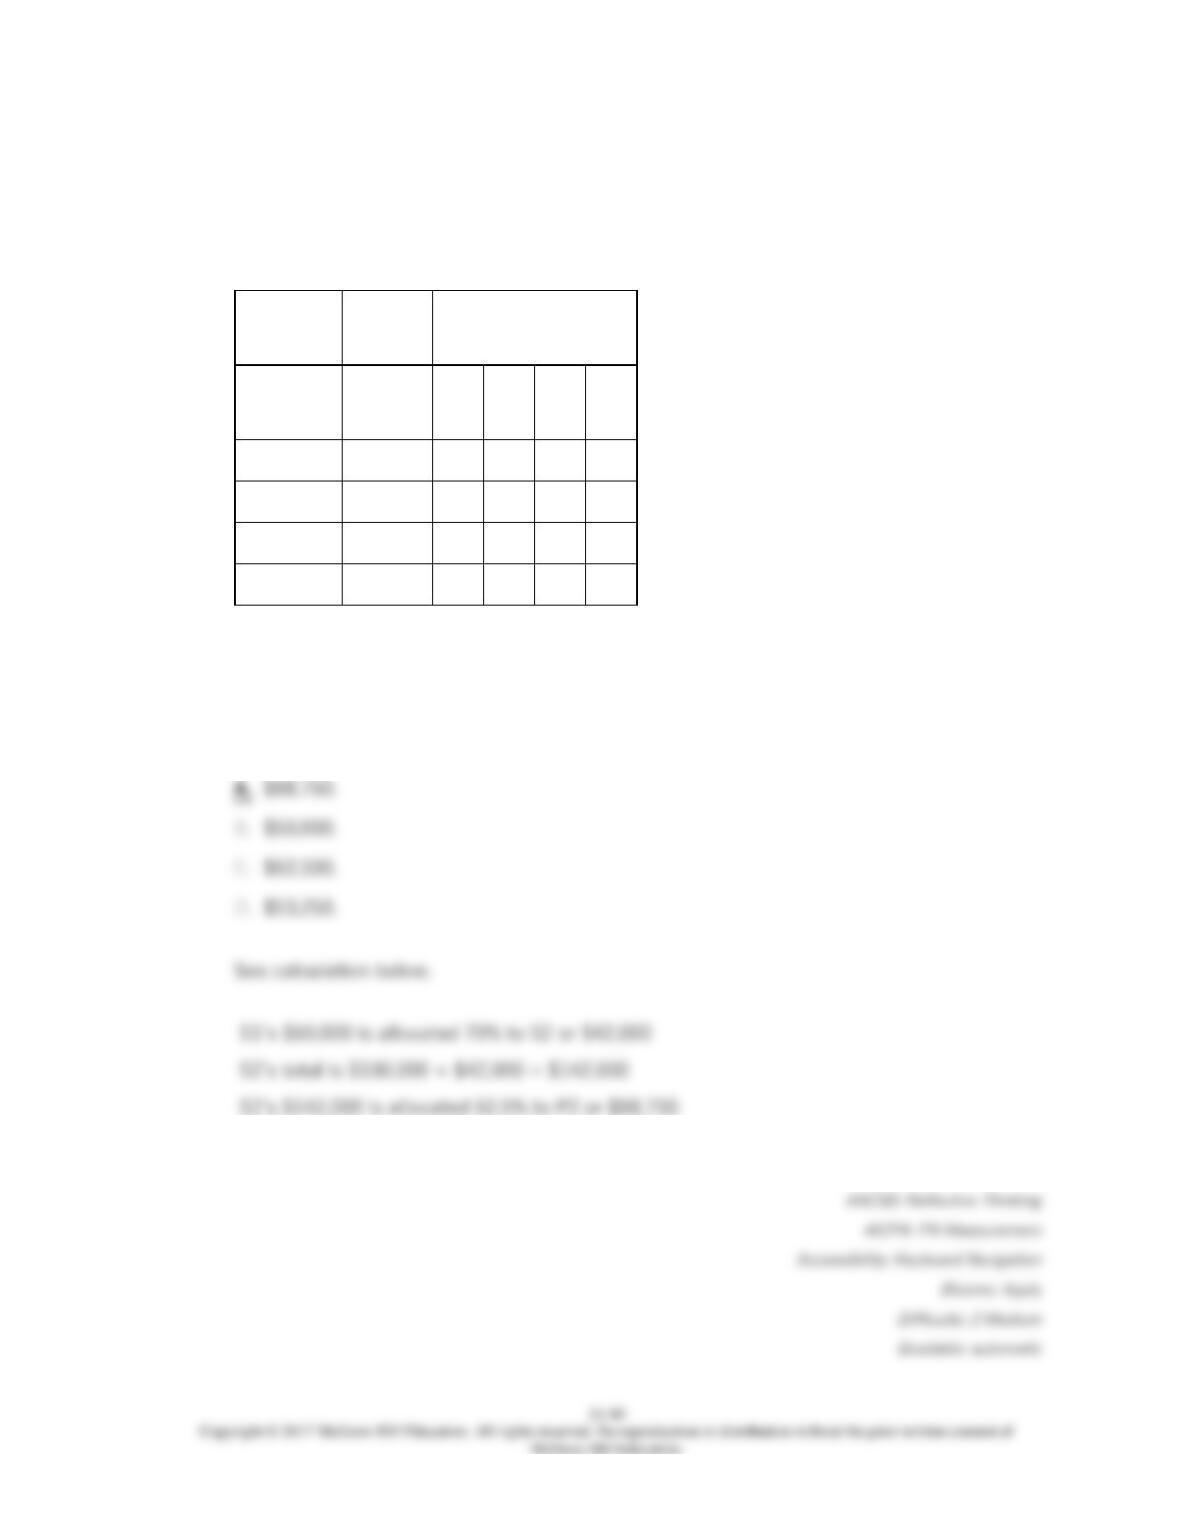
54.
Cordner Corporation has two production Departments: P1 and P2 and two service
departments: S1 and S2. Direct costs for each department and the proportion of service
costs used by the various departments for the month of July are as follows:
Proportion of Services
Used by:
Department
Direct
costs
S1
S2
P1
P2
S1
$60,000
0.70
0.10
0.20
S2
$100,000
0.20
0.30
0.50
P1
$160,000
P2
$140,000
Under the step-method of cost allocation, the amount of costs allocated from S2 to P2
would be:
55.
Cordner Corporation has two production Departments: P1 and P2 and two service
departments: S1 and S2. Direct costs for each department and the proportion of service
costs used by the various departments for the month of July are as follows:
Proportion of Services
Used by:
Department
Direct
costs
S1
S2
P1
P2
S1
$60,000
0.70
0.10
0.20
S2
$100,000
0.20
0.30
0.50
P1
$160,000
P2
$140,000
Under the step-method of allocation, the total amount of service costs allocated to
producing departments would be:
Topic: Methods of Allocating Service Department Costs
56.
Palace Company has two service departments and two user departments. The number of
employees in each department is:
Personnel
10
Cafeteria
25
Producing Department A
265
Producing Department B
250
550
57.
There are several methods for allocating service department costs to production
departments. The method which recognizes service provided by one service department to
another but does not recognize reciprocal interdepartmental service is called: (CMA
adapted)
58.
Because this allocation method recognizes that service departments often provide each
other with inter-departmental service, it is theoretically considered to be the most
accurate method for allocating service department costs to production departments. This
method is: (CMA adapted)
11–49
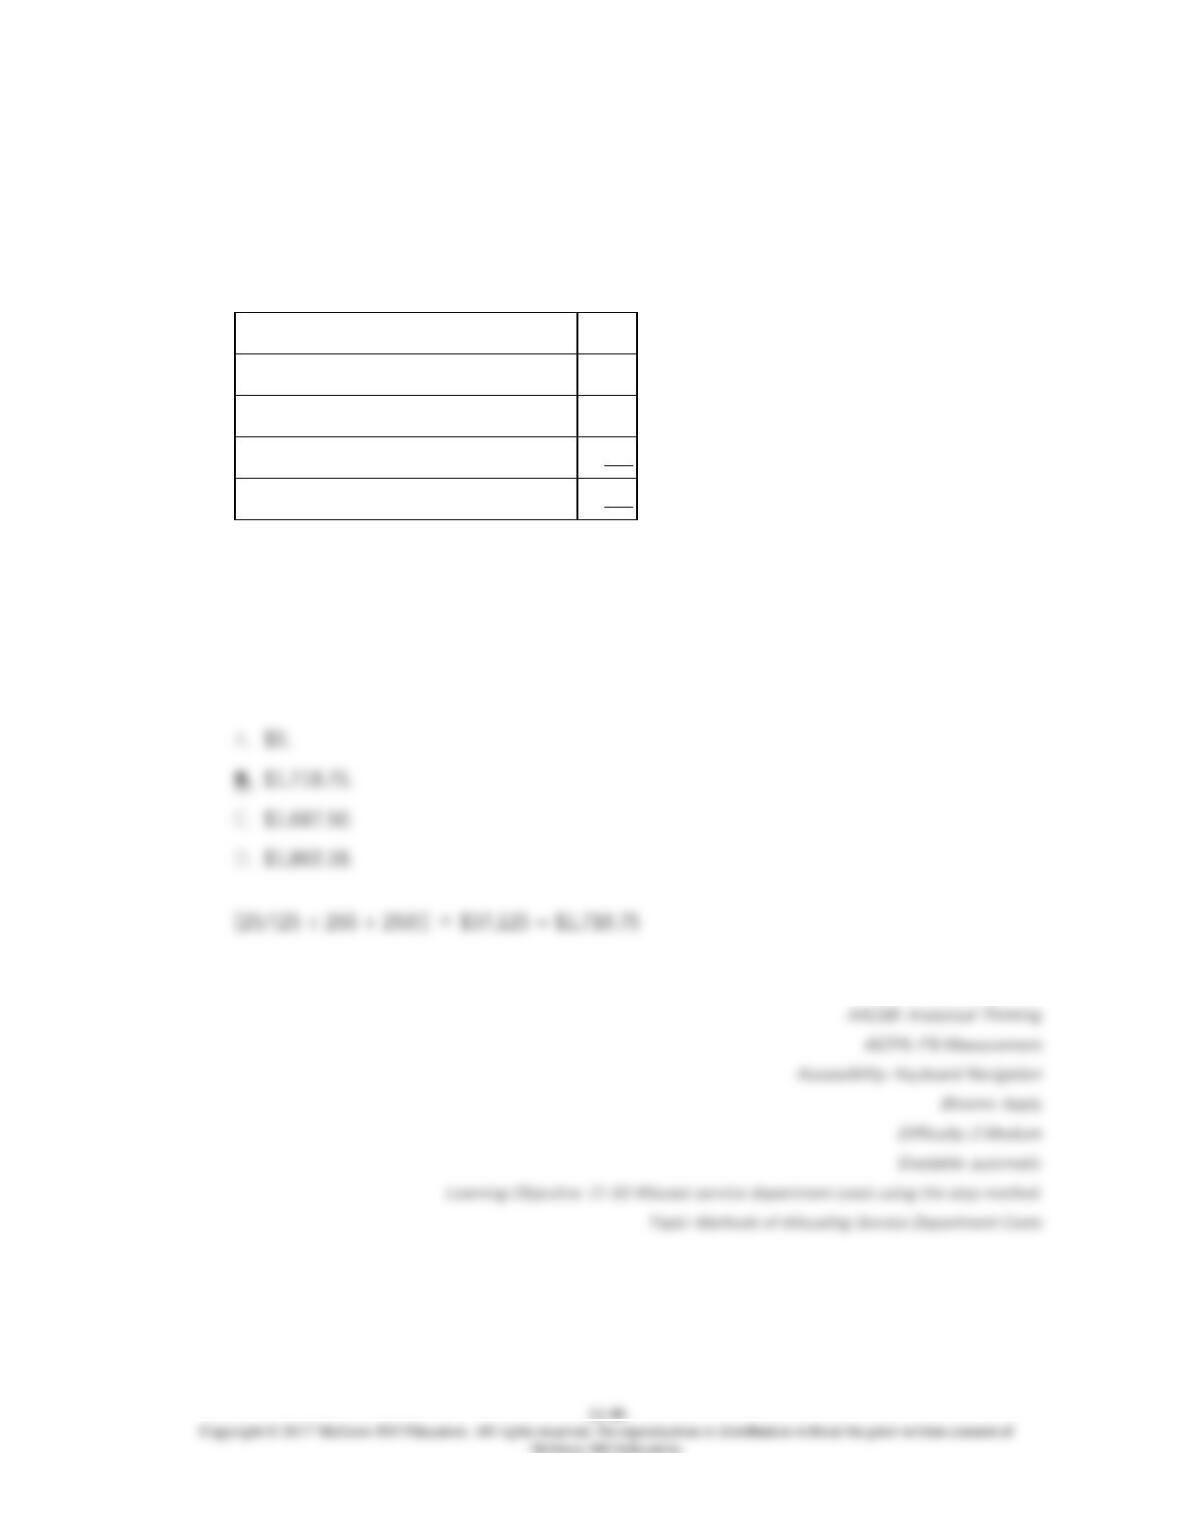
59.
The following information relates to Osceola Corporation for the past accounting period.
Direct costs
Service Dept A
$80,000
Service Dept B
60,000
Producing Dept C
15,000
Producing Dept D
20,000
Proportion of service
by A to:
Proportion of service
by B to:
B
10%
A
30%
C
60%
C
20%
D
30%
D
50%
Using the simultaneous solution method, Department A’s cost allocated to Department C
is:
60.
The following information relates to Osceola Corporation for the past accounting period.
Direct costs
11–50
Service Dept A
$80,000
Service Dept B
60,000
Producing Dept C
15,000
Producing Dept D
20,000
Proportion of service
by A to:
Proportion of service
by B to:
B
10%
A
30%
C
60%
C
20%
D
30%
D
50%
Using the simultaneous solution method, Department B’s cost allocated to Department C
is:
61.
The following set up is a system of simultaneous linear equations to allocate costs using
the reciprocal method. Matrix algebra is not required.
The following costs were incurred in three operating departments and three service
departments in Westmoreland Company.
Department
Direct Costs
Label
11–51
Subassemblies
$550,000
P1
Final assembly
775,000
P2
Marketing
285,000
P3
Building occupancy
85,000
S1
Research&development
120,000
S2
Supervision
45,000
S3
Use of services by other departments is as follows.
User Department
Service Cost
Center
Sub–
assemblies
Final Assembly
Marketing
Building
Occupancy
R&D
Supervision
Bldg.occupancy
.30
.25
.20
—
.15
.10
R&D
.50
.50
—
—
—
—
Supervision
.20
.30
.20
.10
.20
—
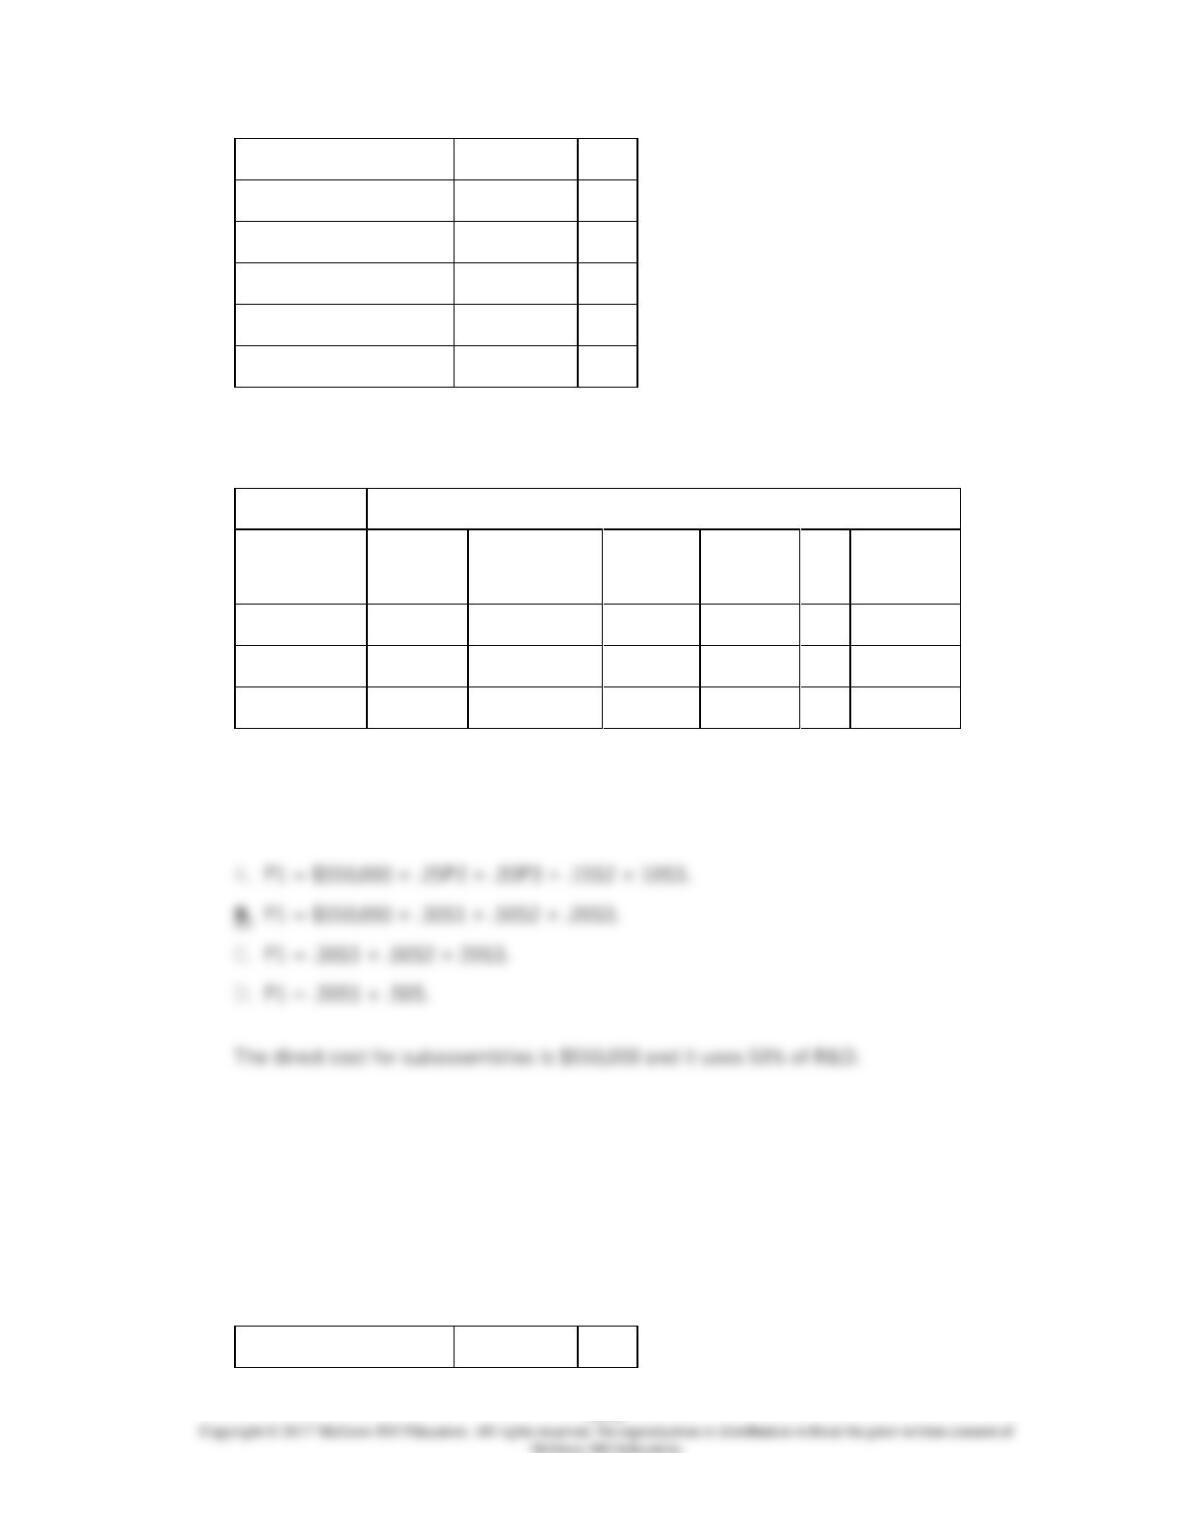
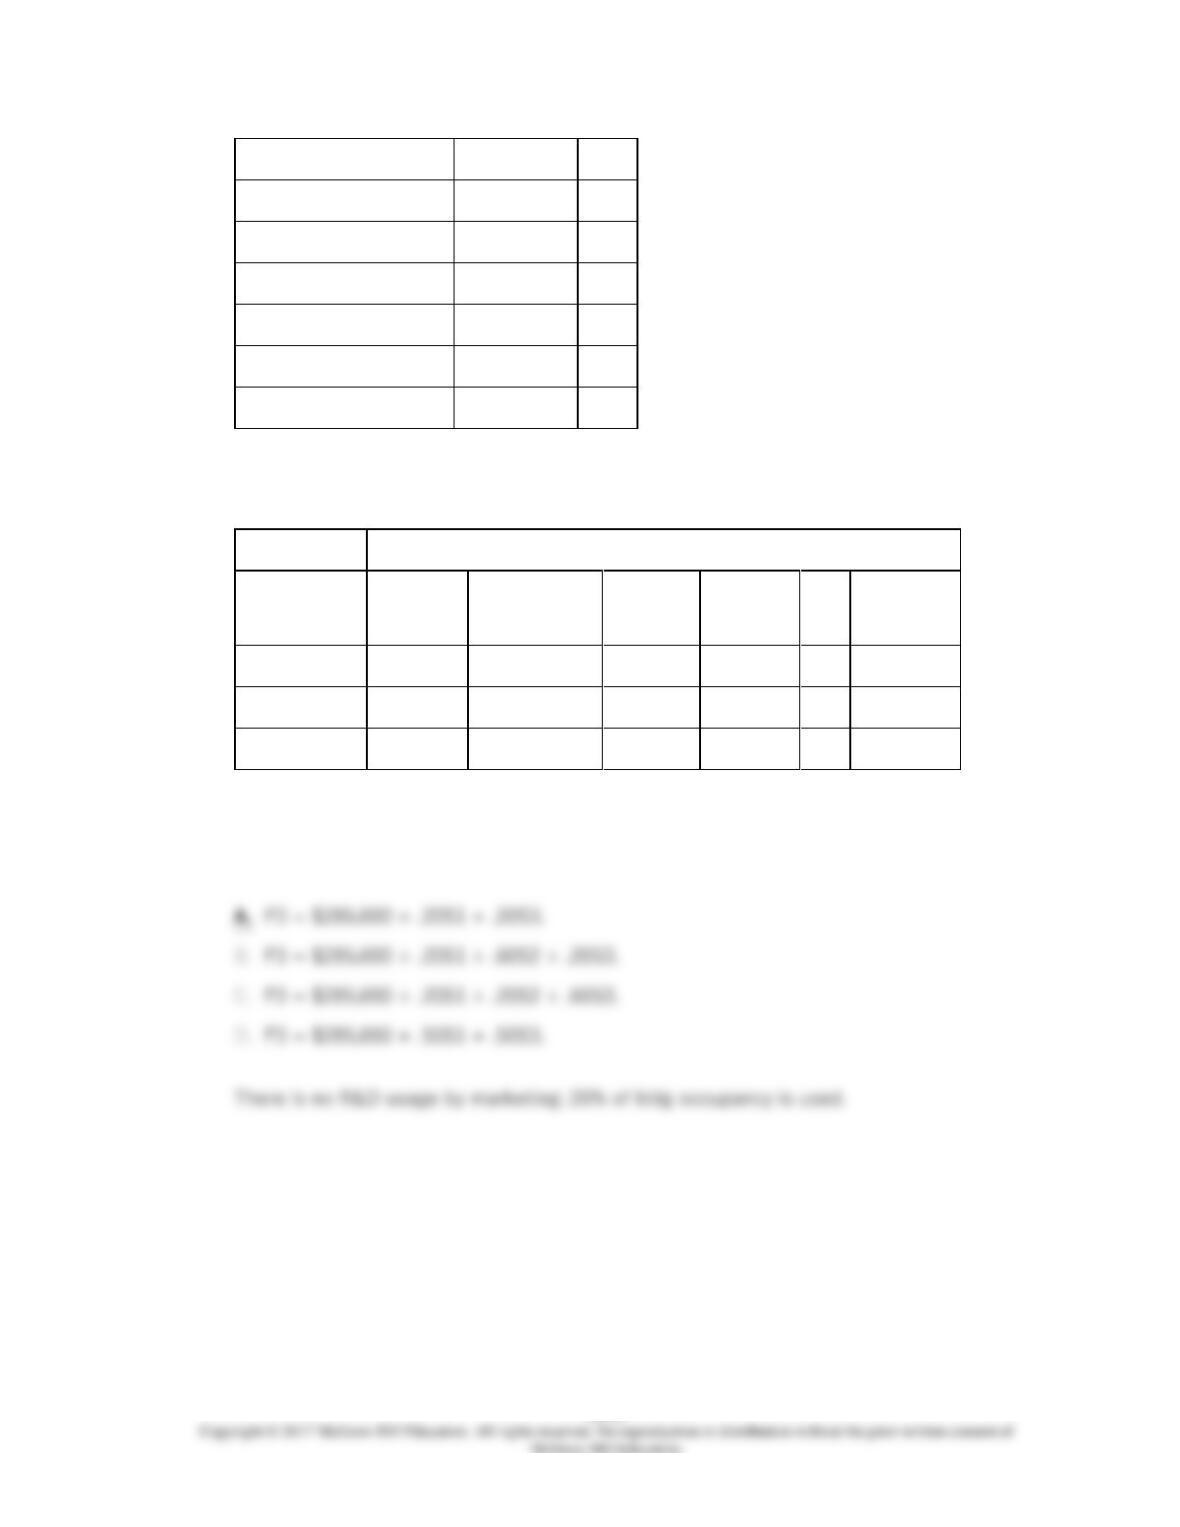
62.
The following set up is a system of simultaneous linear equations to allocate costs using
the reciprocal method. Matrix algebra is not required.
The following costs were incurred in three operating departments and three service
departments in Westmoreland Company.
Department
Direct Costs
Label
11–52
Subassemblies
$550,000
P1
Final assembly
775,000
P2
Marketing
285,000
P3
Building occupancy
85,000
S1
Research&development
120,000
S2
Supervision
45,000
S3
Use of services by other departments is as follows.
User Department
Service Cost
Center
Sub–
assemblies
Final Assembly
Marketing
Building
Occupancy
R&D
Supervision
Bldg.occupancy
.30
.25
.20
—
.15
.10
R&D
.50
.50
—
—
—
—
Supervision
.20
.30
.20
.10
.20
—
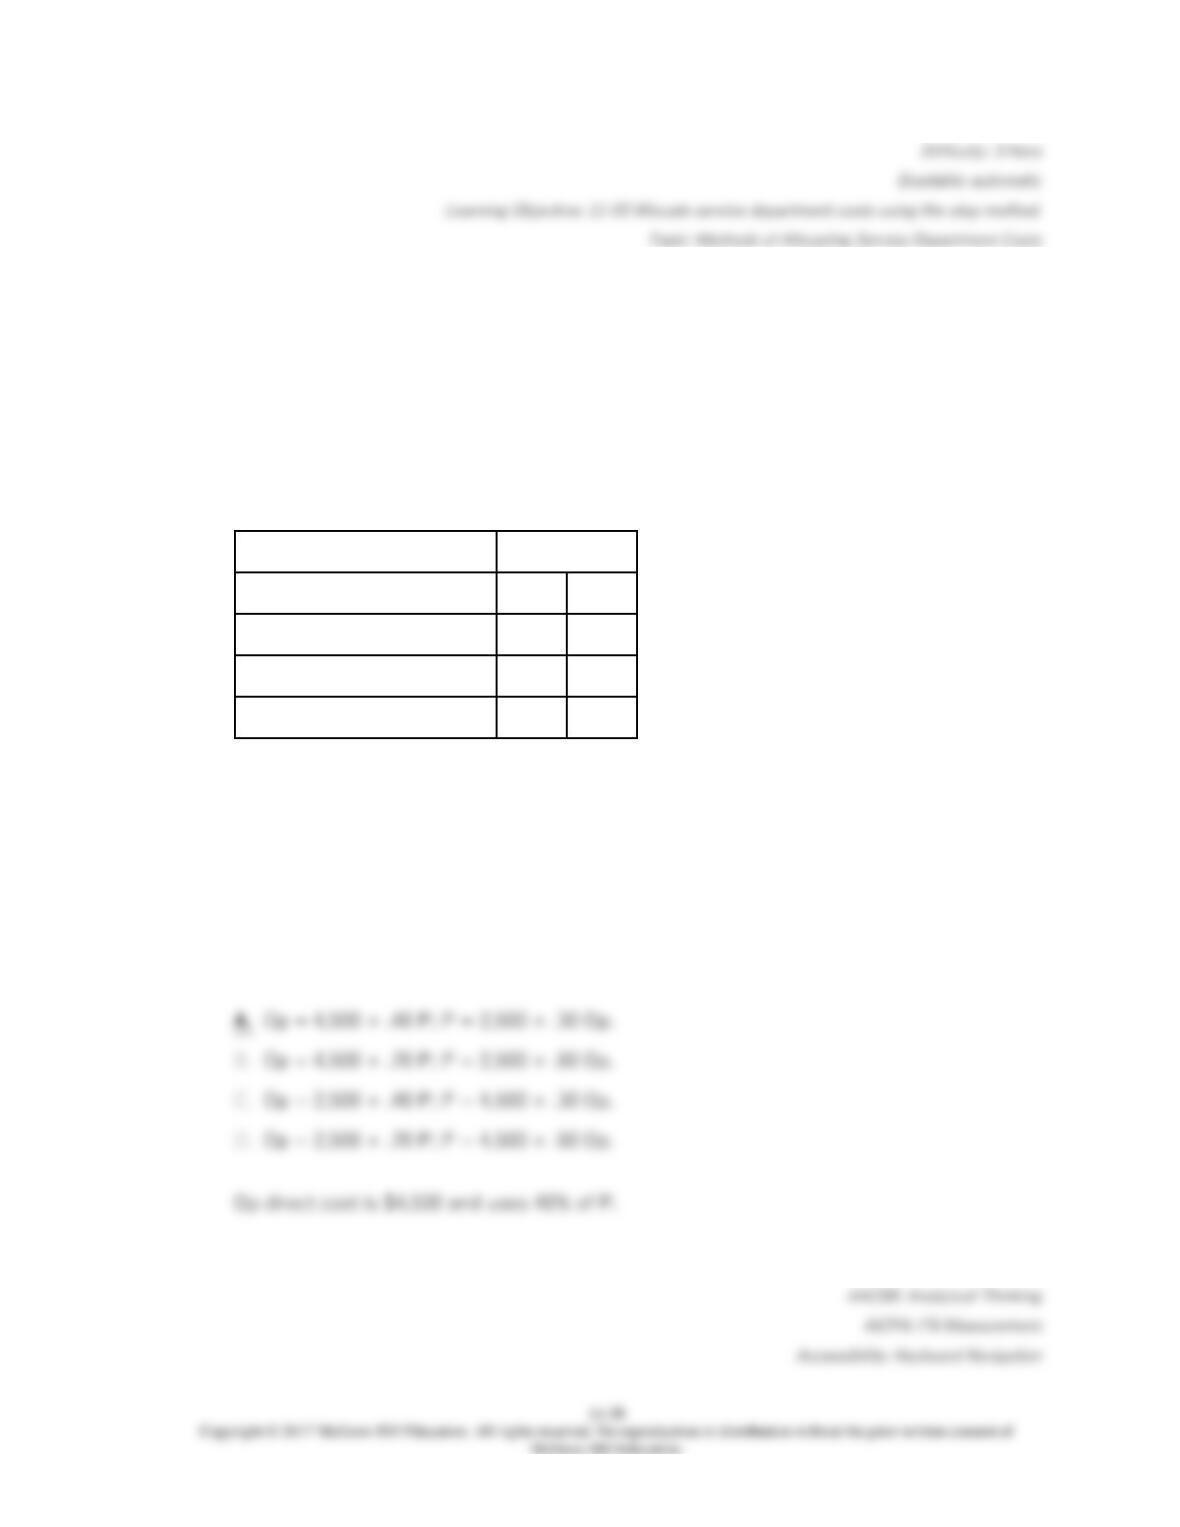
P2 = .25S1 + .50S2 + .30S3.
P2 = $775,000 + .25P2 + .20P3 + .15S2 + .10S3.
P2 = $775,000 + .30S1 + .50S2 + .20S3.
P2 = $775,000 + .25S1 + .50S2 + .30S3.
63.
The following set up is a system of simultaneous linear equations to allocate costs using
the reciprocal method. Matrix algebra is not required.
The following costs were incurred in three operating departments and three service
departments in Westmoreland Company.
11–53
Department
Direct Costs
Label
Subassemblies
$550,000
P1
Final assembly
775,000
P2
Marketing
285,000
P3
Building occupancy
85,000
S1
Research&development
120,000
S2
Supervision
45,000
S3
Use of services by other departments is as follows.
User Department
Service Cost
Center
Sub–
assemblies
Final Assembly
Marketing
Building
Occupancy
R&D
Supervision
Bldg.occupancy
.30
.25
.20
—
.15
.10
R&D
.50
.50
—
—
—
—
Supervision
.20
.30
.20
.10
.20
—
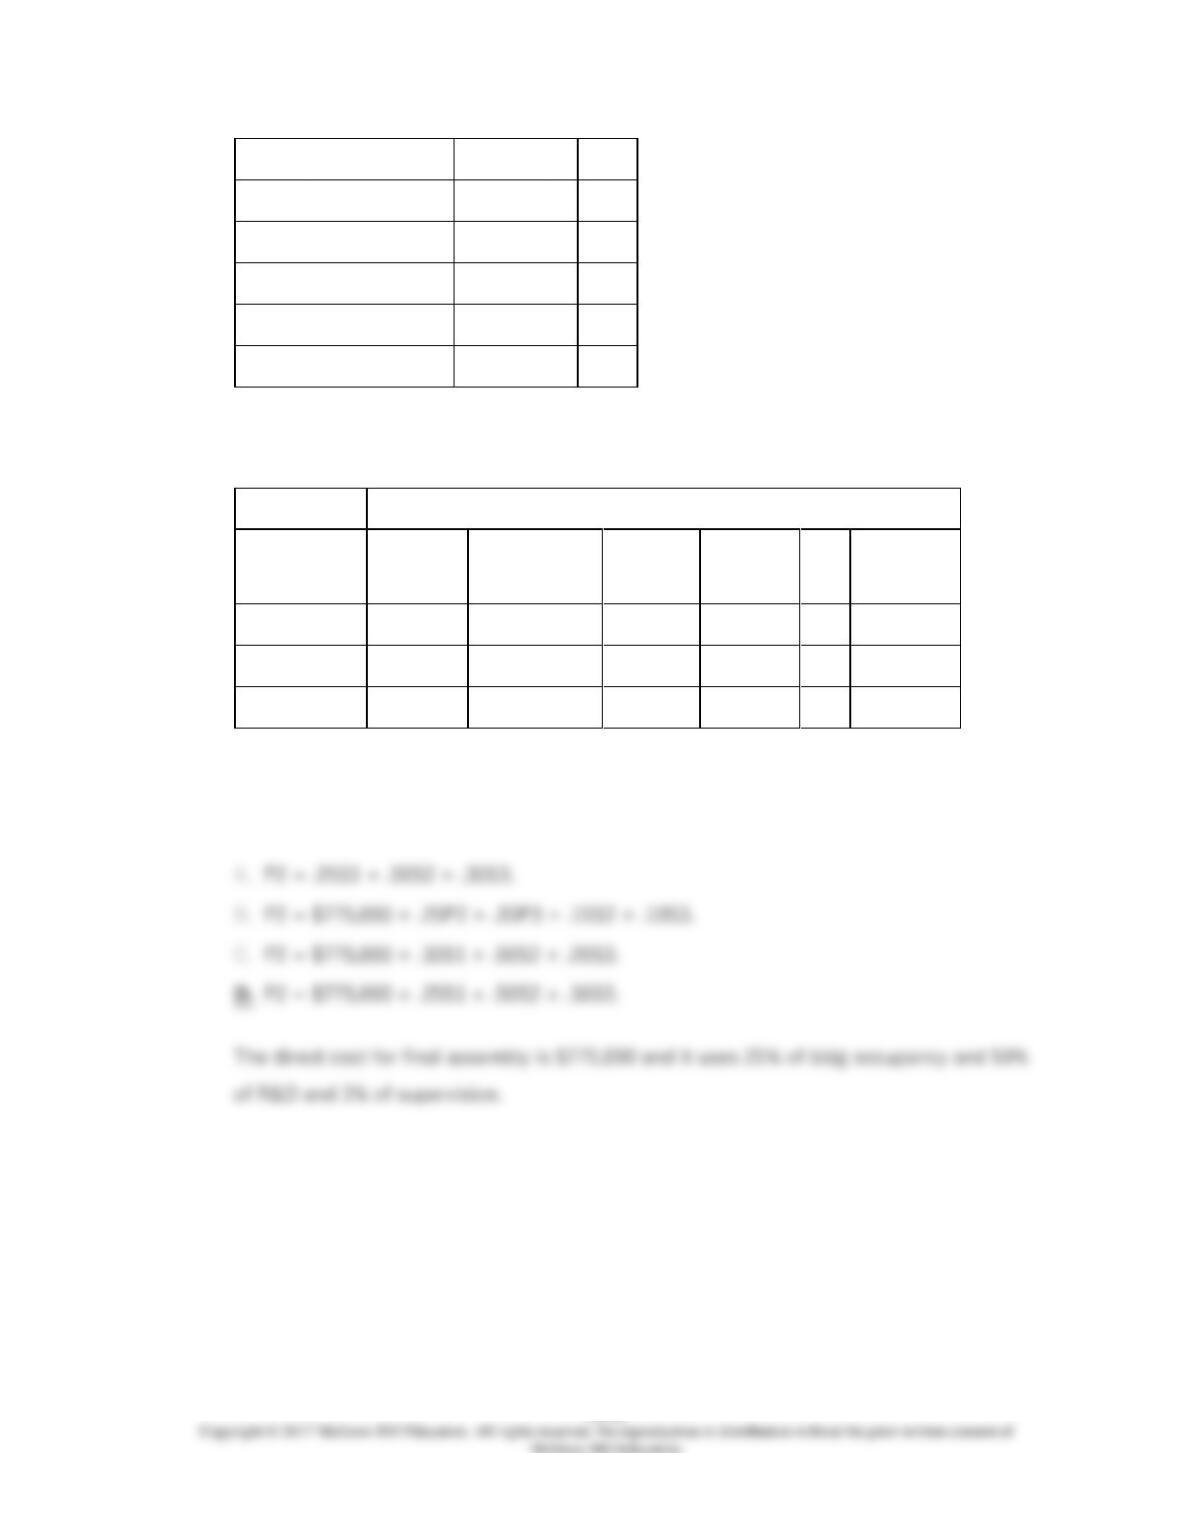
64.
The following set up is a system of simultaneous linear equations to allocate costs using
the reciprocal method. Matrix algebra is not required.
The following costs were incurred in three operating departments and three service
departments in Westmoreland Company.
11–54
Department
Direct Costs
Label
Subassemblies
$550,000
P1
Final assembly
775,000
P2
Marketing
285,000
P3
Building occupancy
85,000
S1
Research&development
120,000
S2
Supervision
45,000
S3
Use of services by other departments is as follows.
User Department
Service Cost
Center
Sub–
assemblies
Final Assembly
Marketing
Building
Occupancy
R&D
Supervision
Bldg.occupancy
.30
.25
.20
—
.15
.10
R&D
.50
.50
—
—
—
—
Supervision
.20
.30
.20
.10
.20
—
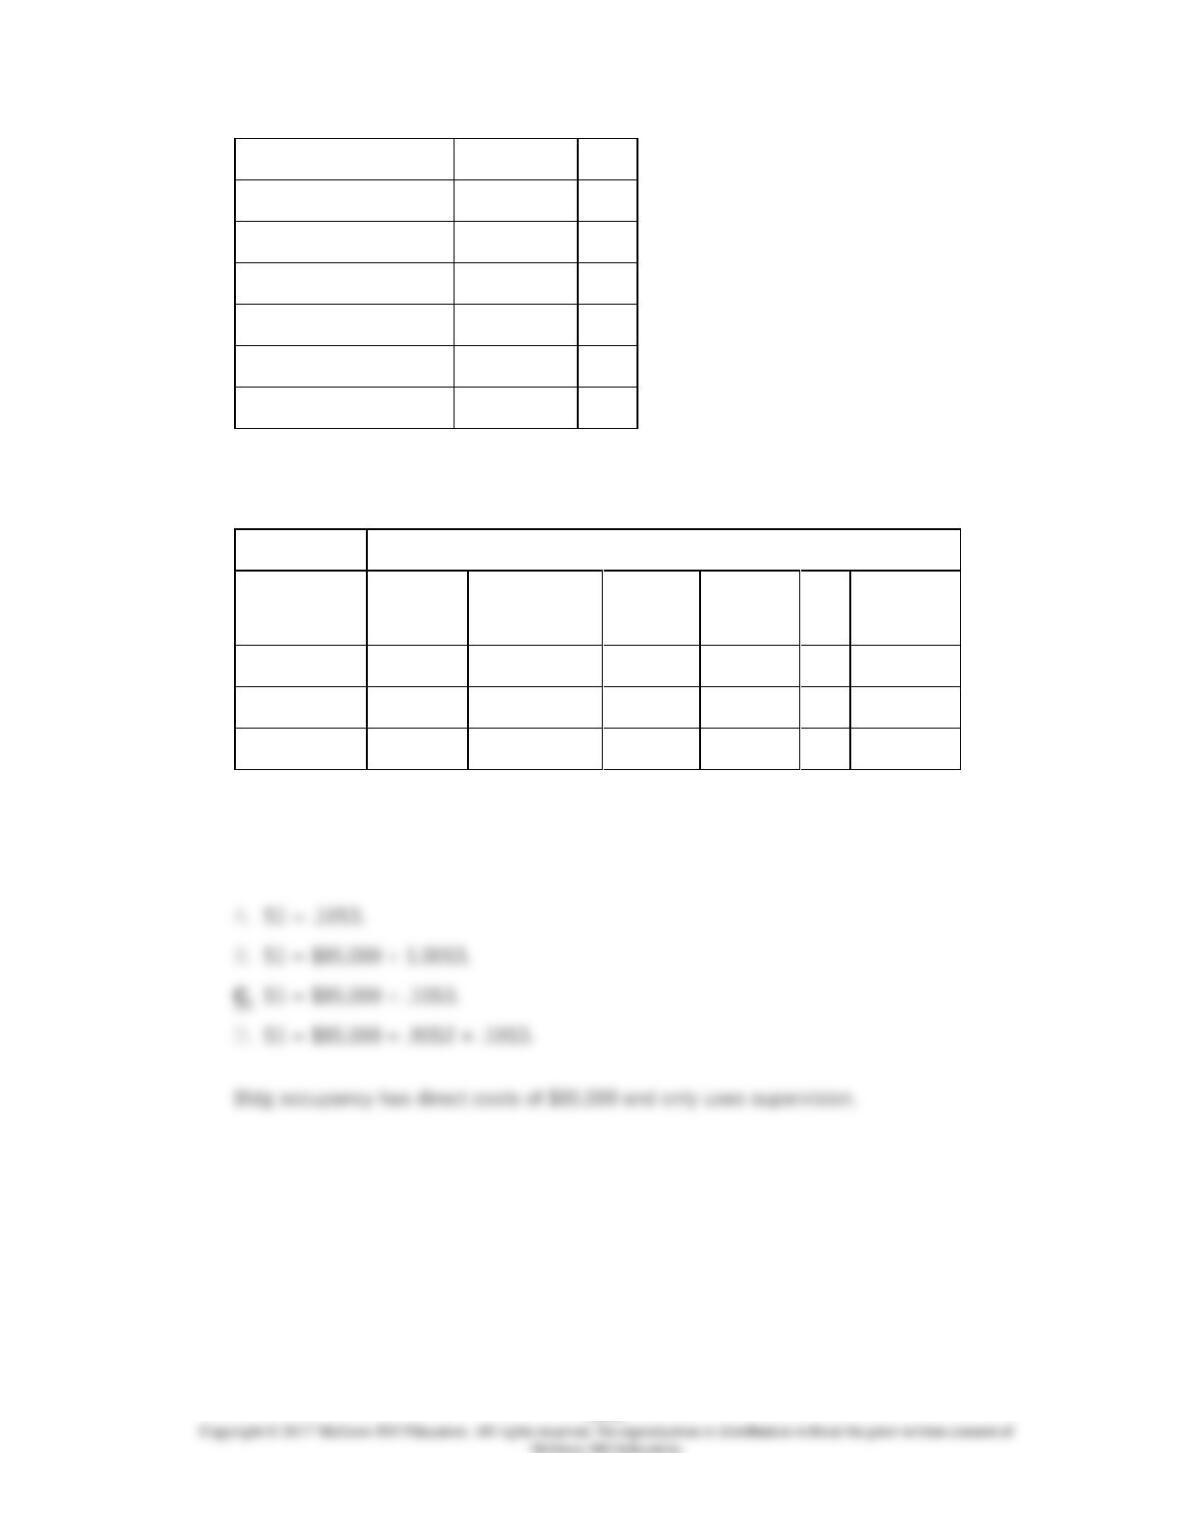
The equation for department S1 (building occupancy) is:
65.
The following set up is a system of simultaneous linear equations to allocate costs using
the reciprocal method. Matrix algebra is not required.
The following costs were incurred in three operating departments and three service
departments in Westmoreland Company.
11–55
Department
Direct Costs
Label
Subassemblies
$550,000
P1
Final assembly
775,000
P2
Marketing
285,000
P3
Building occupancy
85,000
S1
Research&development
120,000
S2
Supervision
45,000
S3
Use of services by other departments is as follows.
User Department
Service Cost
Center
Sub–
assemblies
Final Assembly
Marketing
Building
Occupancy
R&D
Supervision
Bldg.occupancy
.30
.25
.20
—
.15
.10
R&D
.50
.50
—
—
—
—
Supervision
.20
.30
.20
.10
.20
—
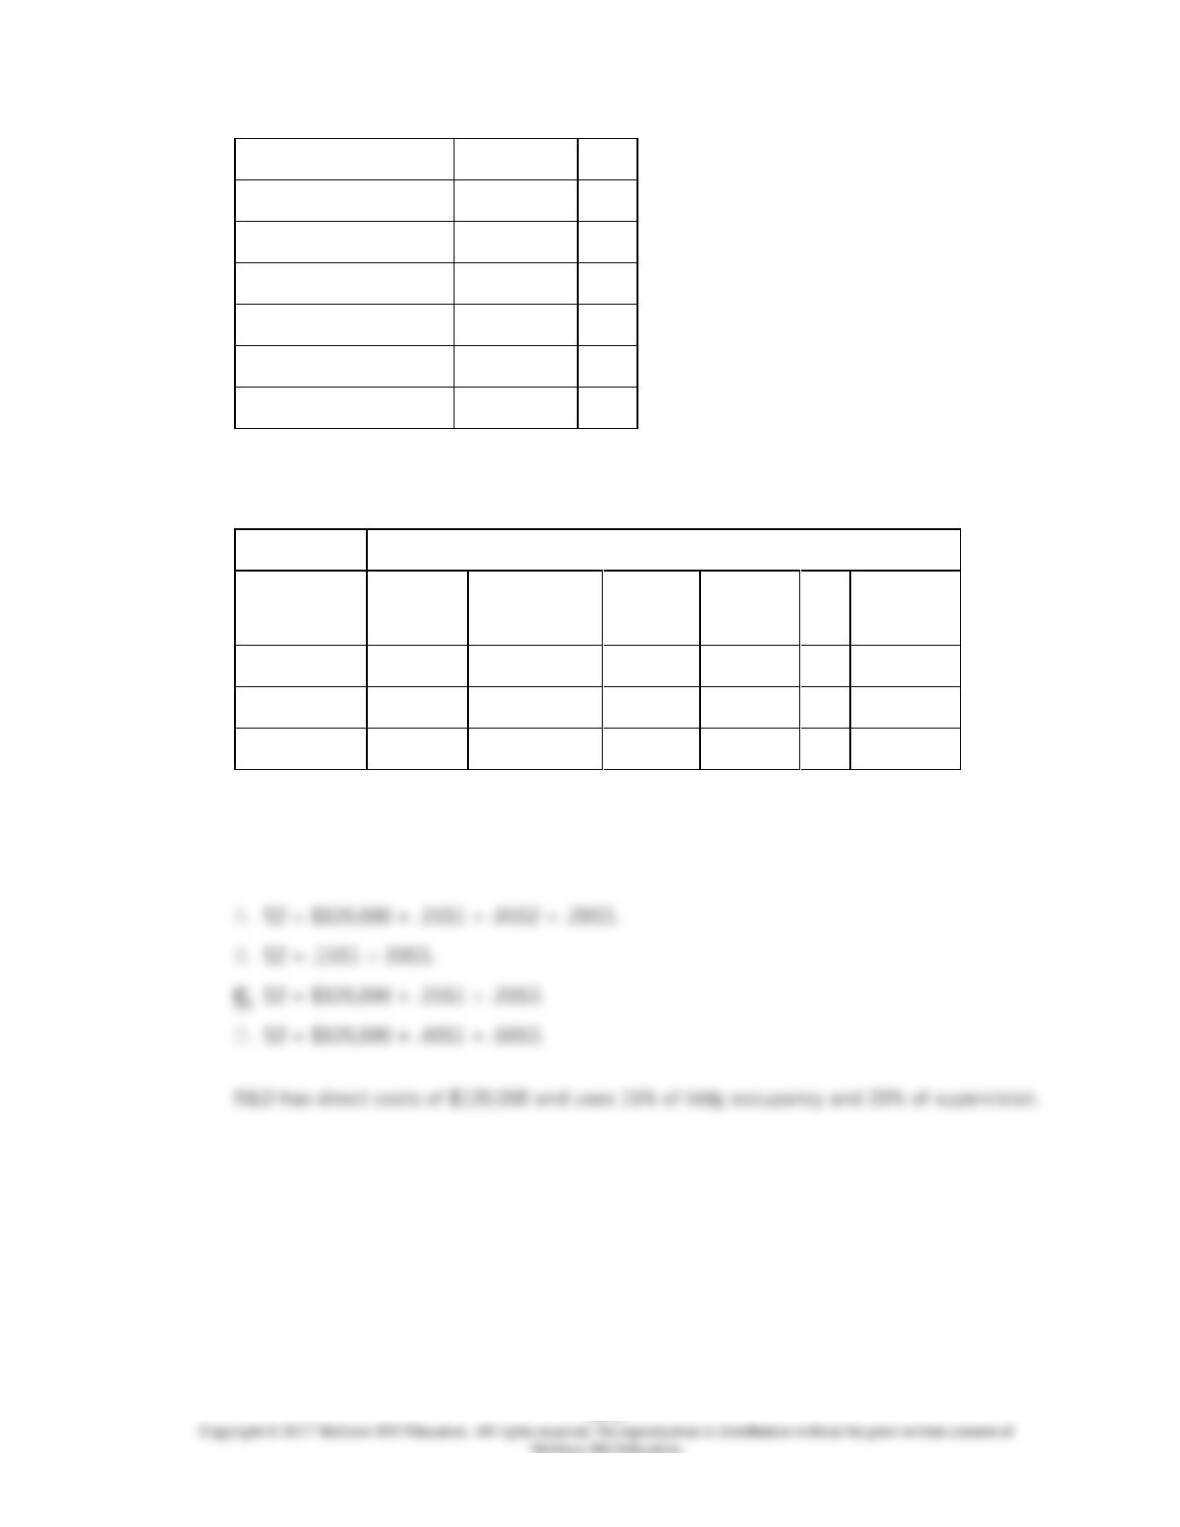
66.
The following set up is a system of simultaneous linear equations to allocate costs using
the reciprocal method. Matrix algebra is not required.
The following costs were incurred in three operating departments and three service
departments in Westmoreland Company.
11–56
Department
Direct Costs
Label
Subassemblies
$550,000
P1
Final assembly
775,000
P2
Marketing
285,000
P3
Building occupancy
85,000
S1
Research&development
120,000
S2
Supervision
45,000
S3
Use of services by other departments is as follows.
User Department
Service Cost
Center
Sub–
assemblies
Final Assembly
Marketing
Building
Occupancy
R&D
Supervision
Bldg.occupancy
.30
.25
.20
—
.15
.10
R&D
.50
.50
—
—
—
—
Supervision
.20
.30
.20
.10
.20
—
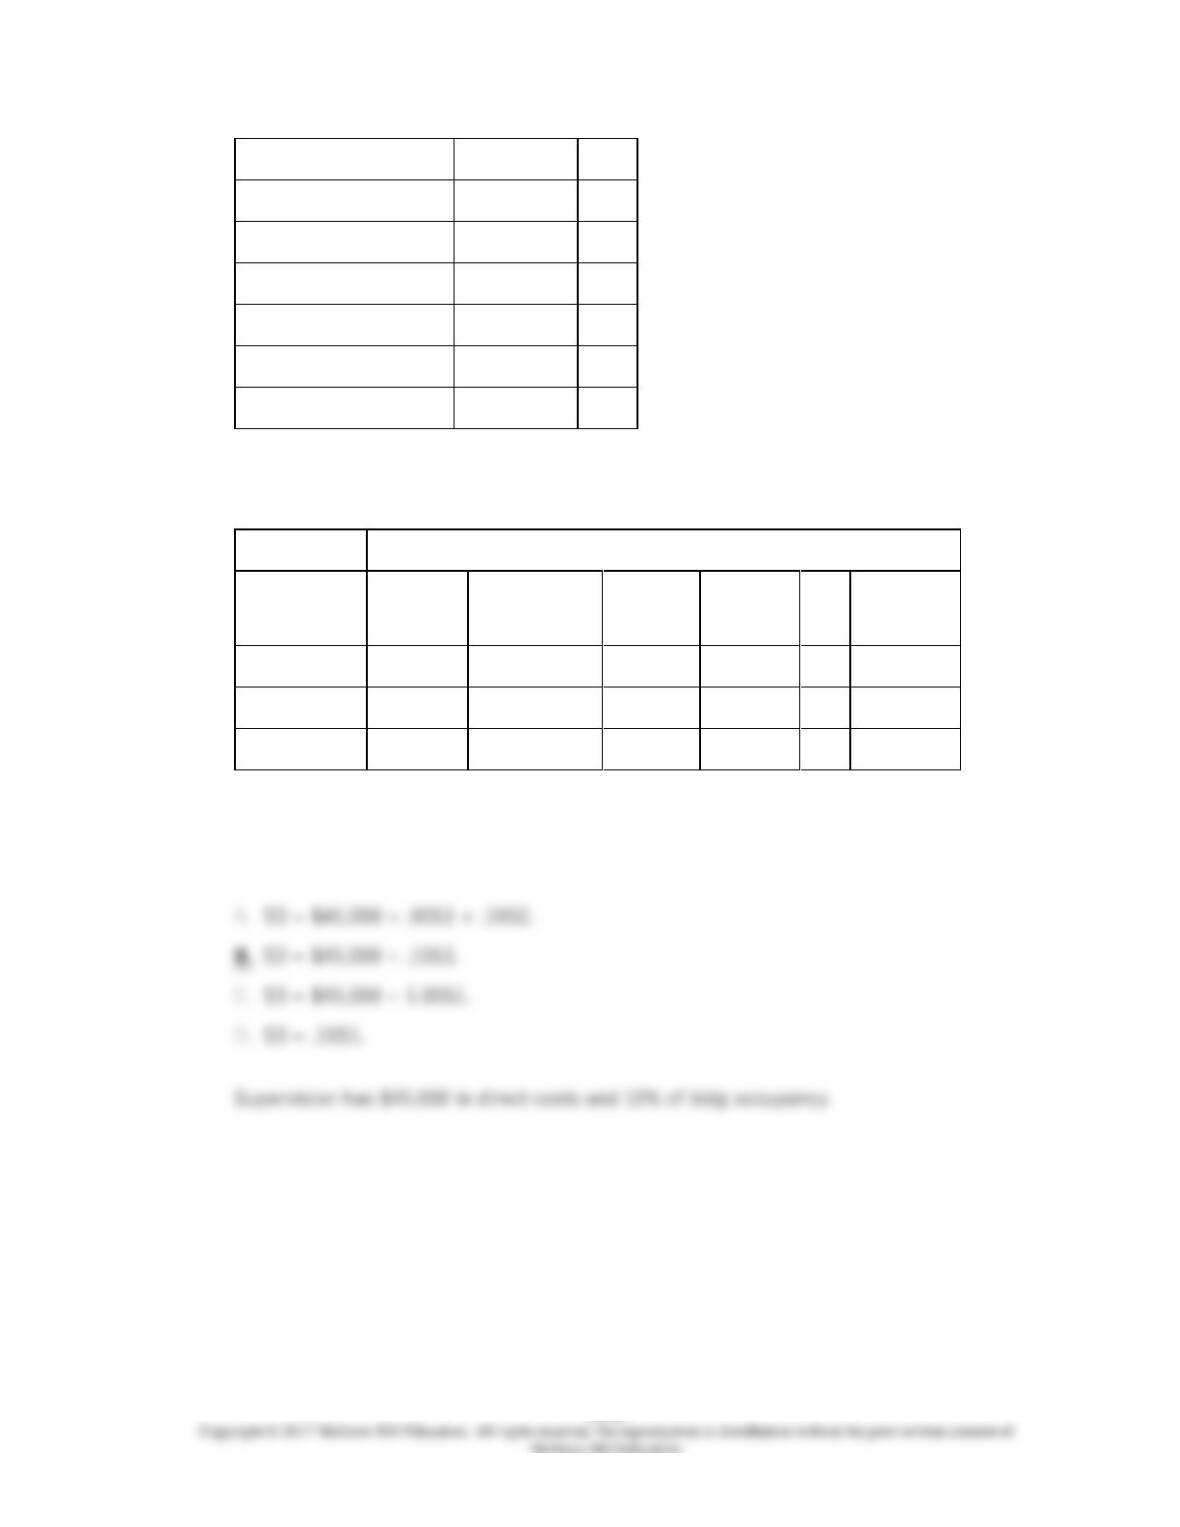
67.
Advanced Computer Solutions, Inc. has two main services: (1) time on a timeshared
computer system, and (2) proprietary computer programs. Computer time is provided by
the operation department (Op) and programs are written by the programming department
(P).
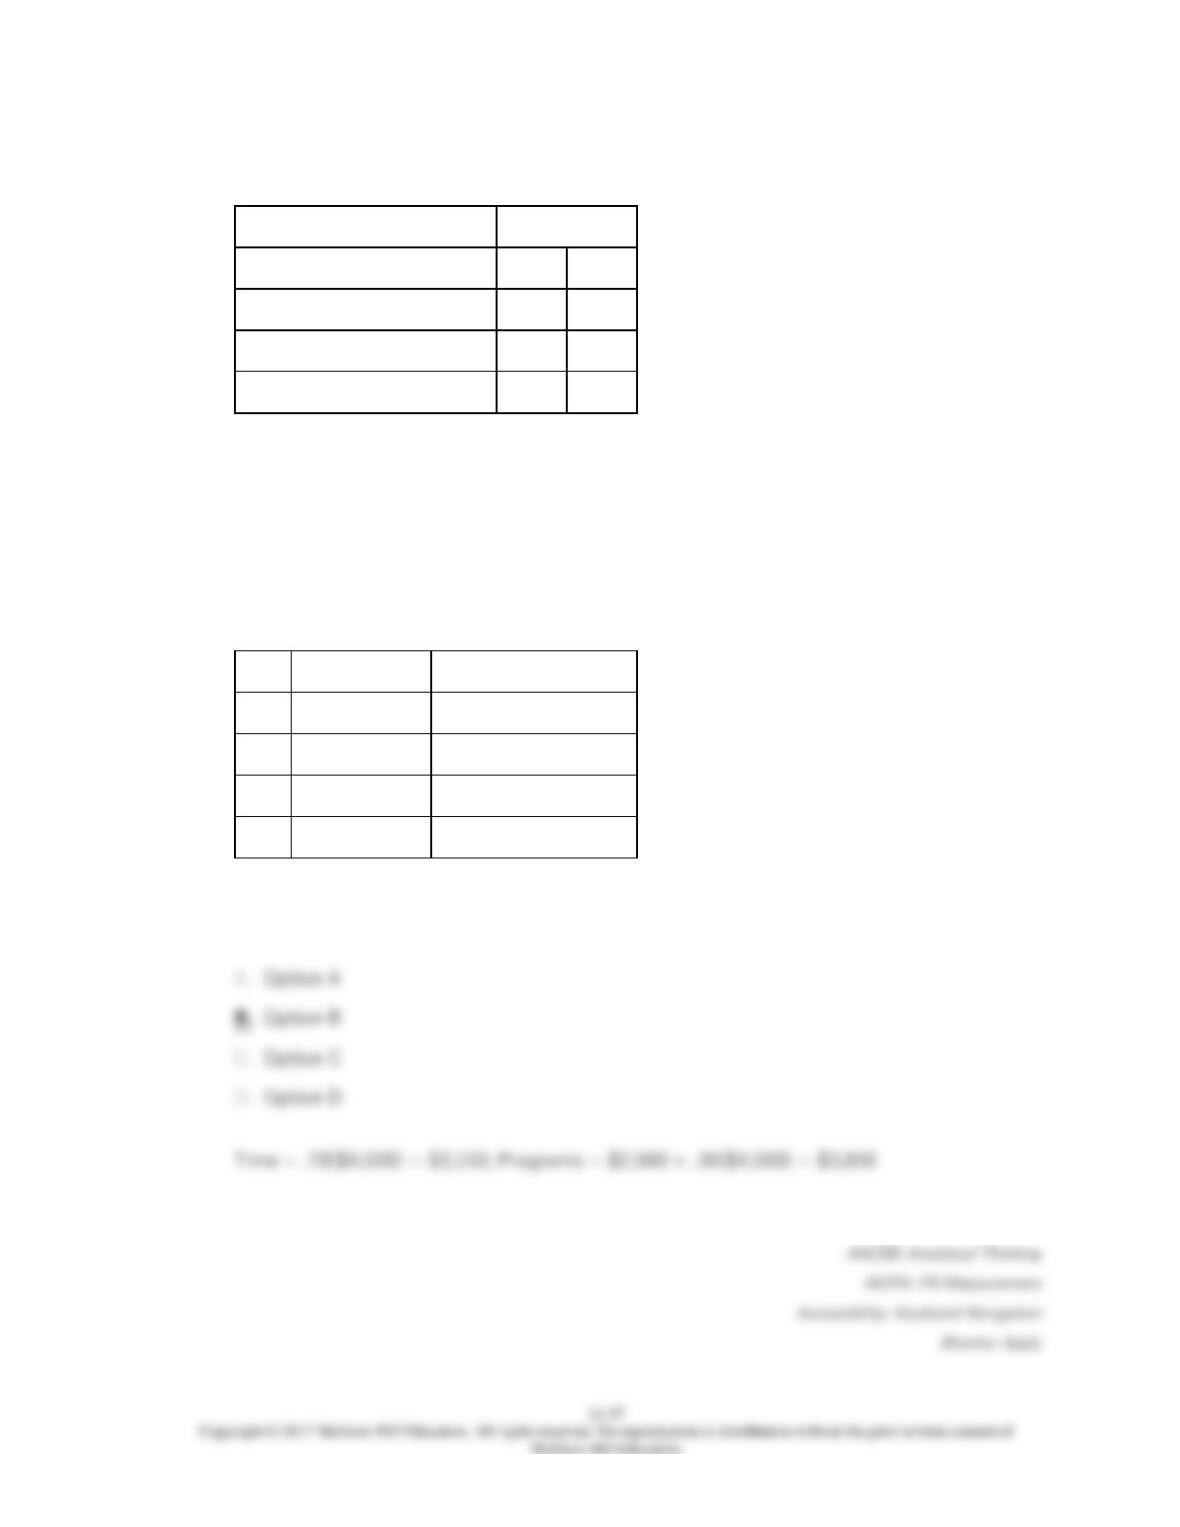
The percentage of each service used by each department for a typical period is:
Supplied
User
Op
P
Op
—
40%
P
30%
—
Sold to customers
70%
60%
In a typical period, the operation department (Op) spends $4,500 and the programming
department (P) spends $2,500.
Under the step method (Op first), what is the cost of the computer time and the computer
programs for sale?
Time
Programs
A.
$4,500
$2,500
B.
$3,150
$3,850
C.
$1,350
$5,650
D.
$2,700
$4,300
68.
Advanced Computer Solutions, Inc. has two main services: (1) time on a timeshared
computer system, and (2) proprietary computer programs. Computer time is provided by
the operation department (Op) and programs are written by the programming department
(P).
The percentage of each service used by each department for a typical period is:
Supplied
User
Op
P
Op
—
40%
P
30%
—
Sold to customers
70%
60%
69.
Which of the following best describes the objective of joint cost allocation?
70.
Allocated joint costs are useful for:
71.