Unlock document.
This document is partially blurred.
Unlock all pages and 1 million more documents.
Get Access
93) Gauntlett Inc. reported the following results from last year's operations:
Sales
$
12,000,000
Variable expenses
9,580,000
Contribution margin
2,420,000
Fixed expenses
1,460,000
Net operating income
$
960,000
Average operating assets
$
5,000,000
-
At the beginning of this year, the company has a $1,300,000 investment opportunity with the
following characteristics:
Sales
$
4,680,000
Contribution margin ratio
50
% of sales
Fixed expenses
$
2,059,200
-
If the company pursues the investment opportunity and otherwise performs the same as last year,
the combined turnover for the entire company will be closest to:
A) 12.83
B) 2.65
C) 1.90
D) 3.34
94) Bonilla Inc. has a $700,000 investment opportunity with the following characteristics:
Sales
$
2,240,000
Contribution margin ratio
40
% of sales
Fixed expenses
$
739,200
-
The margin for the investment opportunity is closest to:
A) 40.0%
B) 33.0%
C) 67.0%
D) 7.0%

95) Bonilla Inc. has a $700,000 investment opportunity with the following characteristics:
Sales
$
2,240,000
Contribution margin ratio
40
% of sales
Fixed expenses
$
739,200
-
The turnover for the investment opportunity is closest to:
A) 14.29
B) 3.20
C) 0.07
D) 0.31
96) Bonilla Inc. has a $700,000 investment opportunity with the following characteristics:
Sales
$
2,240,000
Contribution margin ratio
40
% of sales
Fixed expenses
$
739,200
-
The ROI for the investment opportunity is closest to:
A) 7.0%
B) 128.0%
C) 21.2%
D) 22.4%
97) Babak Industries is a division of a major corporation. Last year the division had total sales of
$19,560,000, net operating income of $1,877,760, and average operating assets of $6,000,000.
The division's margin is closest to:
A) 31.3%
B) 9.6%
C) 30.7%
D) 40.3%
98) Babak Industries is a division of a major corporation. Last year the division had total sales of
$19,560,000, net operating income of $1,877,760, and average operating assets of $6,000,000.
The division's turnover is closest to:
A) 3.26
B) 0.31
C) 2.48
D) 10.42
99) Babak Industries is a division of a major corporation. Last year the division had total sales of
$19,560,000, net operating income of $1,877,760, and average operating assets of $6,000,000.
The division's return on investment (ROI) is closest to:
A) 7.3%
B) 23.8%
C) 31.3%
D) 3.0%
100) Minar Inc. reported the following results from last year's operations:
Sales
$
5,700,000
Variable expenses
3,510,000
Contribution margin
2,190,000
Fixed expenses
1,734,000
Net operating income
$
456,000
Average operating assets
$
3,000,000
At the beginning of this year, the company has a $900,000 investment opportunity with the
following characteristics:
Sales
$
1,530,000
Contribution margin ratio
60
% of sales
Fixed expenses
$
810,900
If the company pursues the investment opportunity and otherwise performs the same as last year,
the combined margin for the entire company will be closest to:
A) 9.9%
B) 1.9%
C) 7.8%
D) 6.3%
101) Minar Inc. reported the following results from last year's operations:
Sales
$
5,700,000
Variable expenses
3,510,000
Contribution margin
2,190,000
Fixed expenses
1,734,000
Net operating income
$
456,000
Average operating assets
$
3,000,000
-
At the beginning of this year, the company has a $900,000 investment opportunity with the
following characteristics:
Sales
$
1,530,000
Contribution margin ratio
60
% of sales
Fixed expenses
$
810,900
-
If the company pursues the investment opportunity and otherwise performs the same as last year,
the combined turnover for the entire company will be closest to:
A) 8.03
B) 1.85
C) 2.41
D) 1.46
102) Minar Inc. reported the following results from last year's operations:
Sales
$
5,700,000
Variable expenses
3,510,000
Contribution margin
2,190,000
Fixed expenses
1,734,000
Net operating income
$
456,000
Average operating assets
$
3,000,000
At the beginning of this year, the company has a $900,000 investment opportunity with the
following characteristics:
Sales
$
1,530,000
Contribution margin ratio
60
% of sales
Fixed expenses
$
810,900
If the company pursues the investment opportunity and otherwise performs the same as last year,
the combined ROI for the entire company will be closest to:
A) 14.4%
B) 2.7%
C) 11.7%
D) 18.8%
103) Weafer Inc. reported the following results from last year's operations:
Sales
$
14,000,000
Variable expenses
9,560,000
Contribution margin
4,440,000
Fixed expenses
3,740,000
Net operating income
$
700,000
Average operating assets
$
7,000,000
-
Last year's margin was closest to:
A) 10.0%
B) 73.3%
C) 5.0%
D) 31.7%
104) Weafer Inc. reported the following results from last year's operations:
Sales
$
14,000,000
Variable expenses
9,560,000
Contribution margin
4,440,000
Fixed expenses
3,740,000
Net operating income
$
700,000
Average operating assets
$
7,000,000
-
Last year's turnover was closest to:
A) 0.05
B) 2.00
C) 20.00
D) 0.50
105) Weafer Inc. reported the following results from last year's operations:
Sales
$
14,000,000
Variable expenses
9,560,000
Contribution margin
4,440,000
Fixed expenses
3,740,000
Net operating income
$
700,000
Average operating assets
$
7,000,000
-
Last year's return on investment (ROI) was closest to:
A) 10.0%
B) 50.0%
C) 5.0%
D) 63.4%
106) The Millard Division's operating data for the past two years are provided below:
Year 1
Year 2
Return on investment
12
%
36
%
Net operating income
?
$
360,000
Turnover
?
3
Margin
?
?
Sales
$
3,200,000
?
-
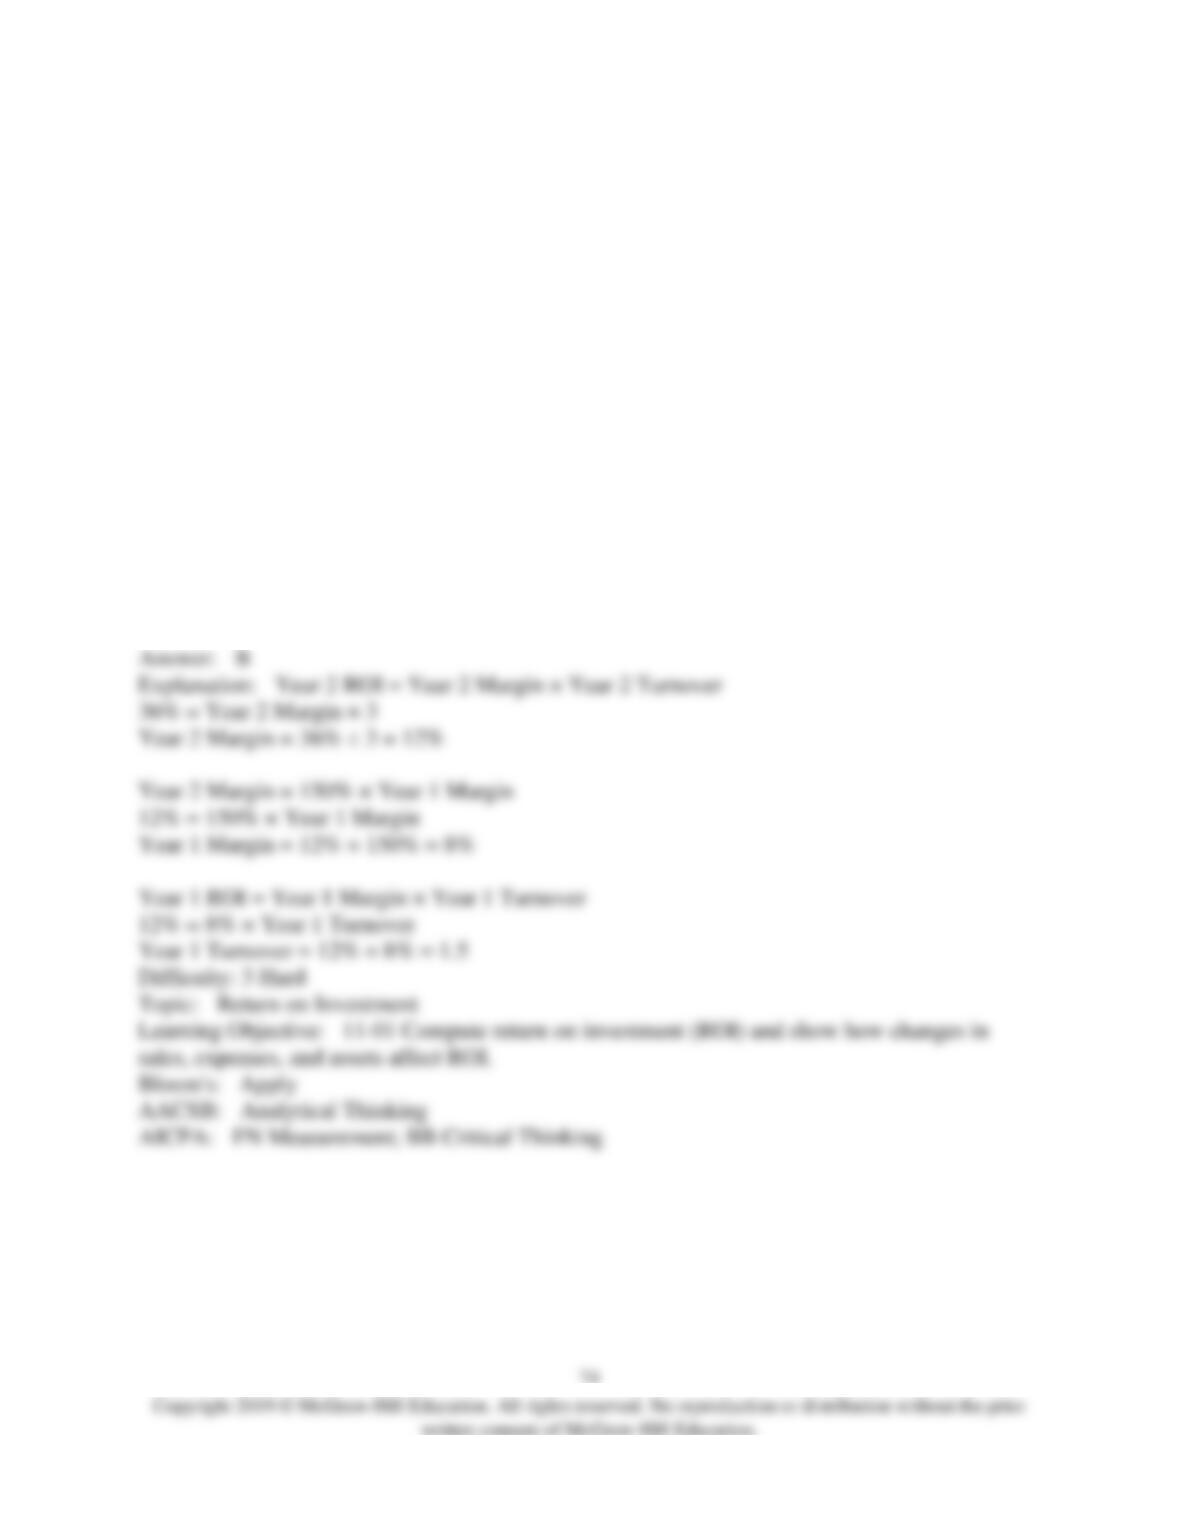
Millard Division's margin in Year 2 was 150% of the margin in Year 1.
The net operating income for Year 1 was:
A) $240,000
B) $256,000
C) $384,000
D) $768,000
107) The Millard Division's operating data for the past two years are provided below:
Year 1
Year 2
Return on investment
12
%
36
%
Net operating income
?
$
360,000
Turnover
?
3
Margin
?
?
Sales
$
3,200,000
?
-
Millard Division's margin in Year 2 was 150% of the margin in Year 1.
The turnover for Year 1 was:
A) 1.2
B) 1.5
C) 3.0
D) 4.0
108) The Millard Division's operating data for the past two years are provided below:
Year 1
Year 2
Return on investment
12
%
36
%
Net operating income
?
$
360,000
Turnover
?
3
Margin
?
?
Sales
$
3,200,000
?
-
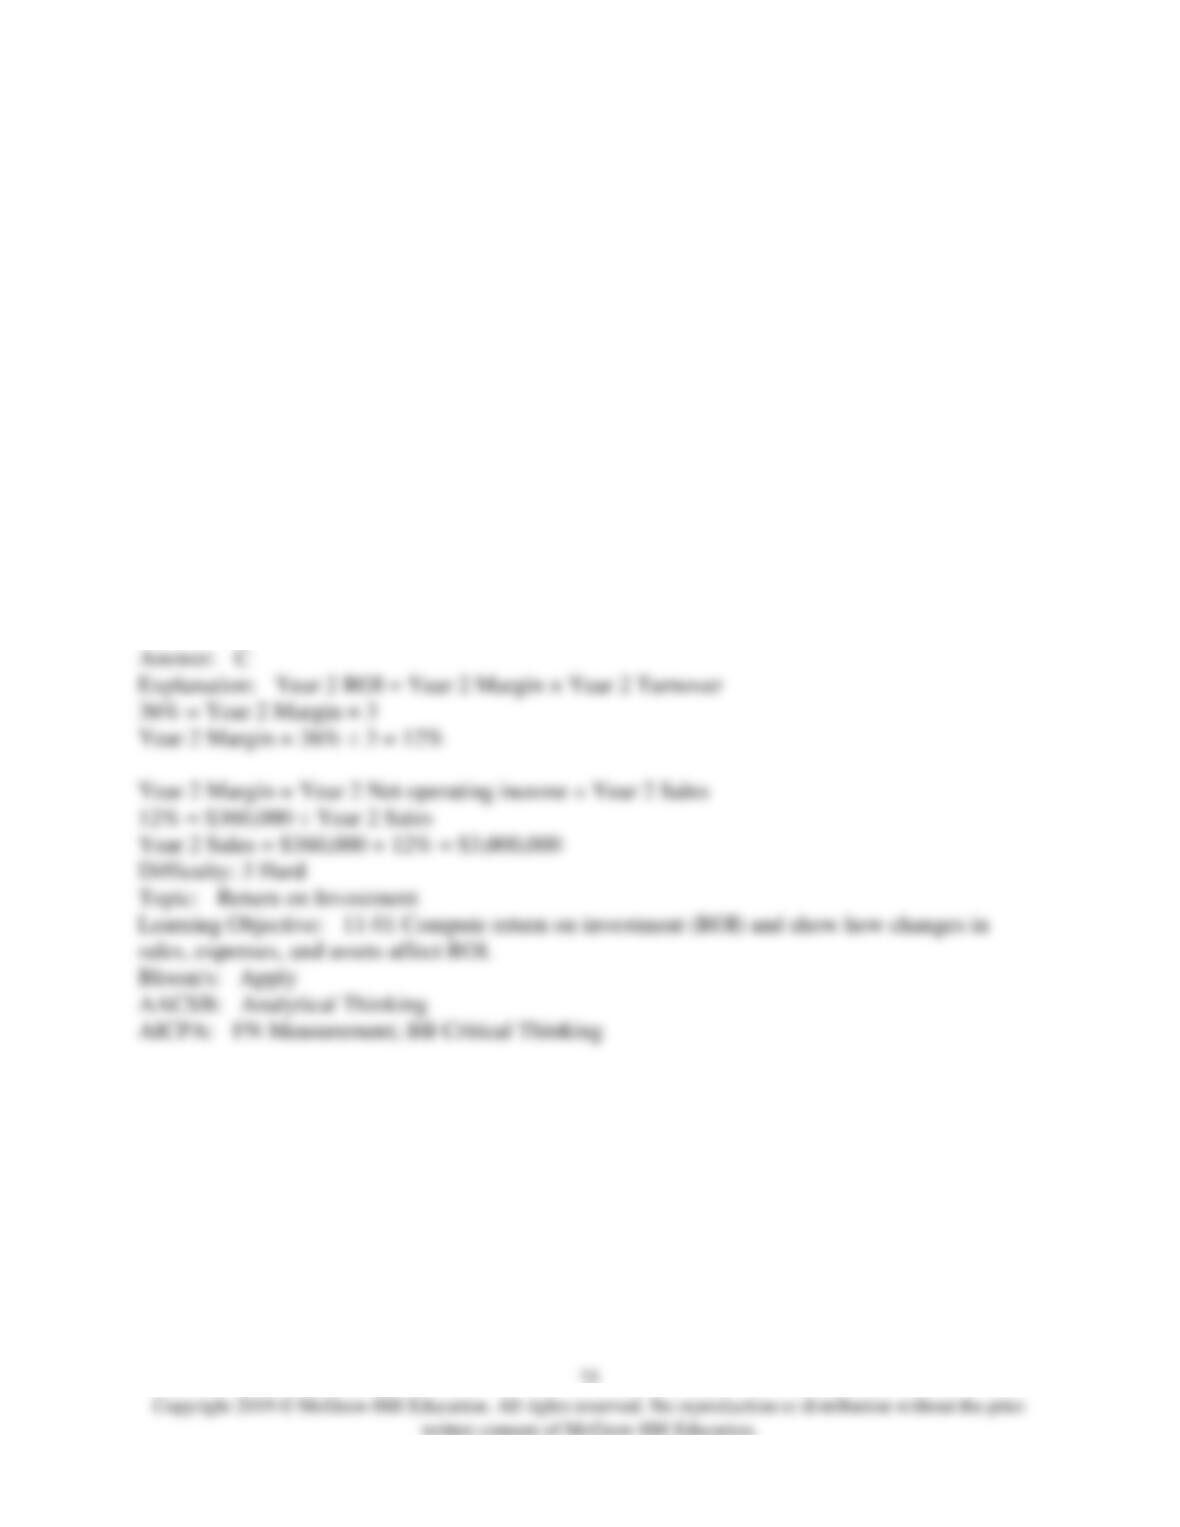
Millard Division's margin in Year 2 was 150% of the margin in Year 1.
The sales for Year 2 were:
A) $1,200,000
B) $3,200,000
C) $3,000,000
D) $3,333,333
109) The Millard Division's operating data for the past two years are provided below:
Year 1
Year 2
Return on investment
12
%
36
%
Net operating income
?
$
360,000
Turnover
?
3
Margin
?
?
Sales
$
3,200,000
?
-
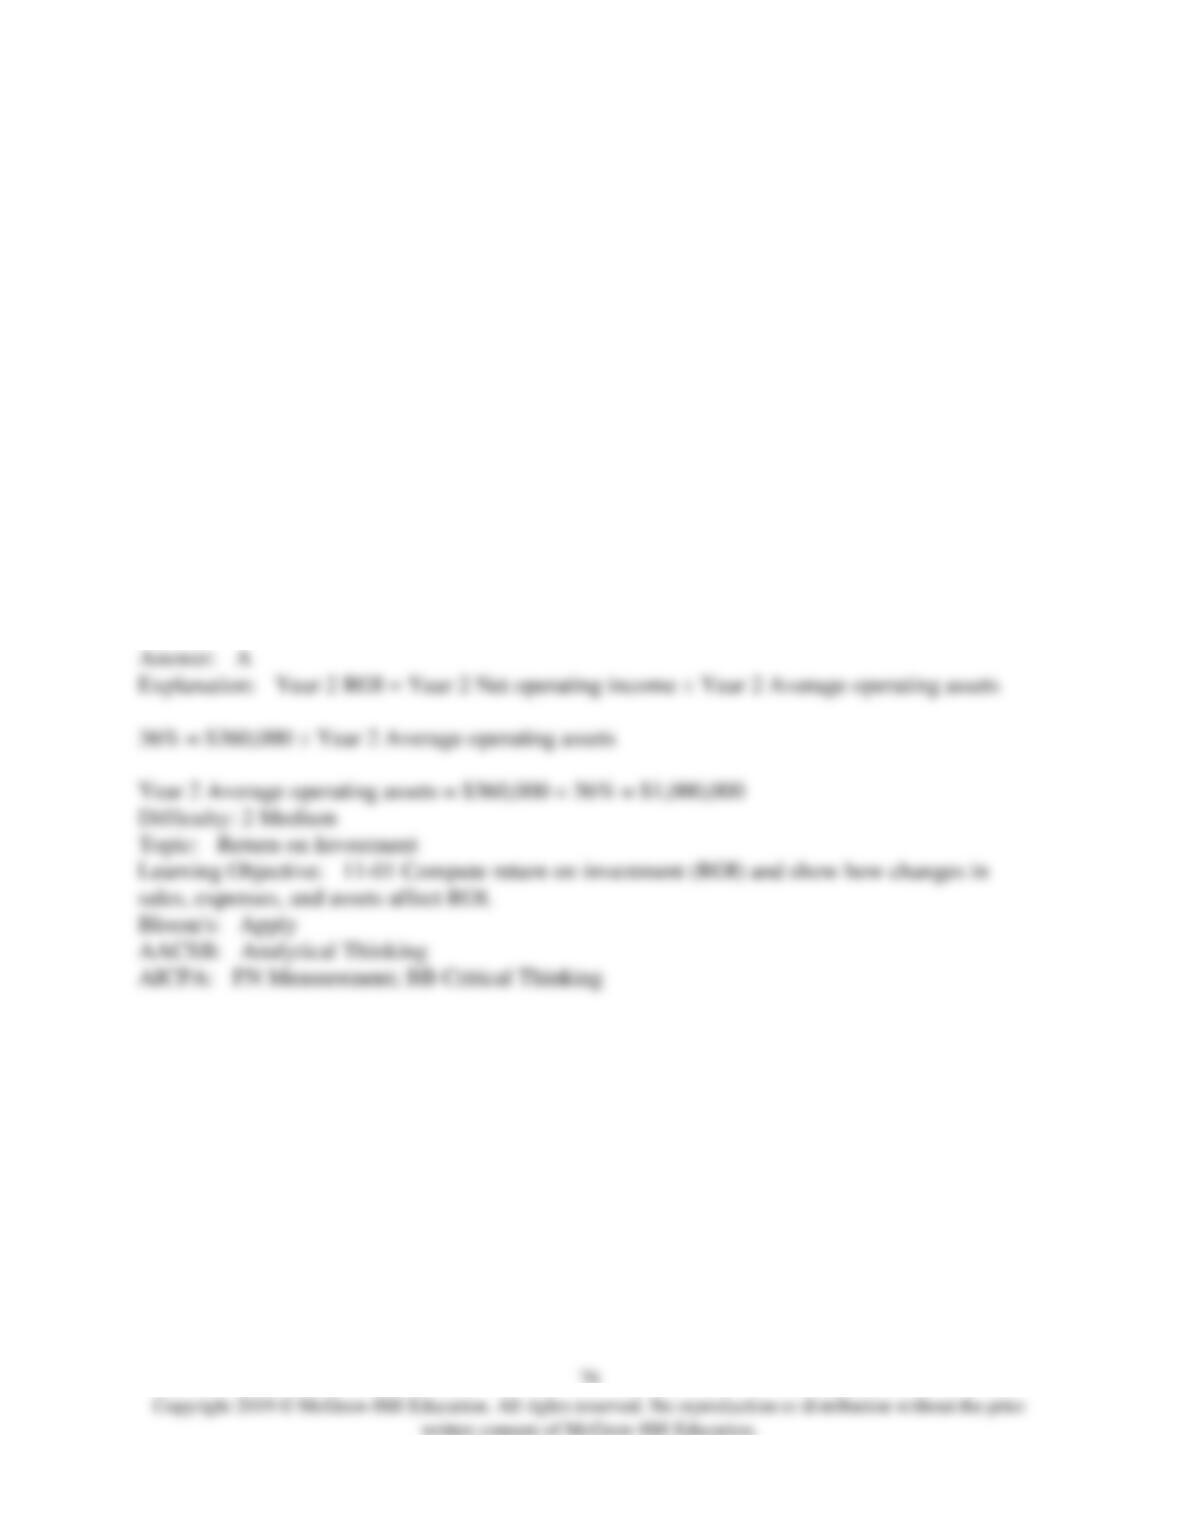
Millard Division's margin in Year 2 was 150% of the margin in Year 1.
The average operating assets for Year 2 were:
A) $1,000,000
B) $1,080,000
C) $1,200,000
D) $1,388,889

110) Agustin Industries is a division of a major corporation. Data concerning the most recent
year appears below:
Sales
$
17,000,000
Net operating income
$
1,581,000
Average operating assets
$
5,000,000
-
The division's margin is closest to:
A) 31.6%
B) 29.4%
C) 38.7%
D) 9.3%
111) Agustin Industries is a division of a major corporation. Data concerning the most recent
year appears below:
Sales
$
17,000,000
Net operating income
$
1,581,000
Average operating assets
$
5,000,000
-
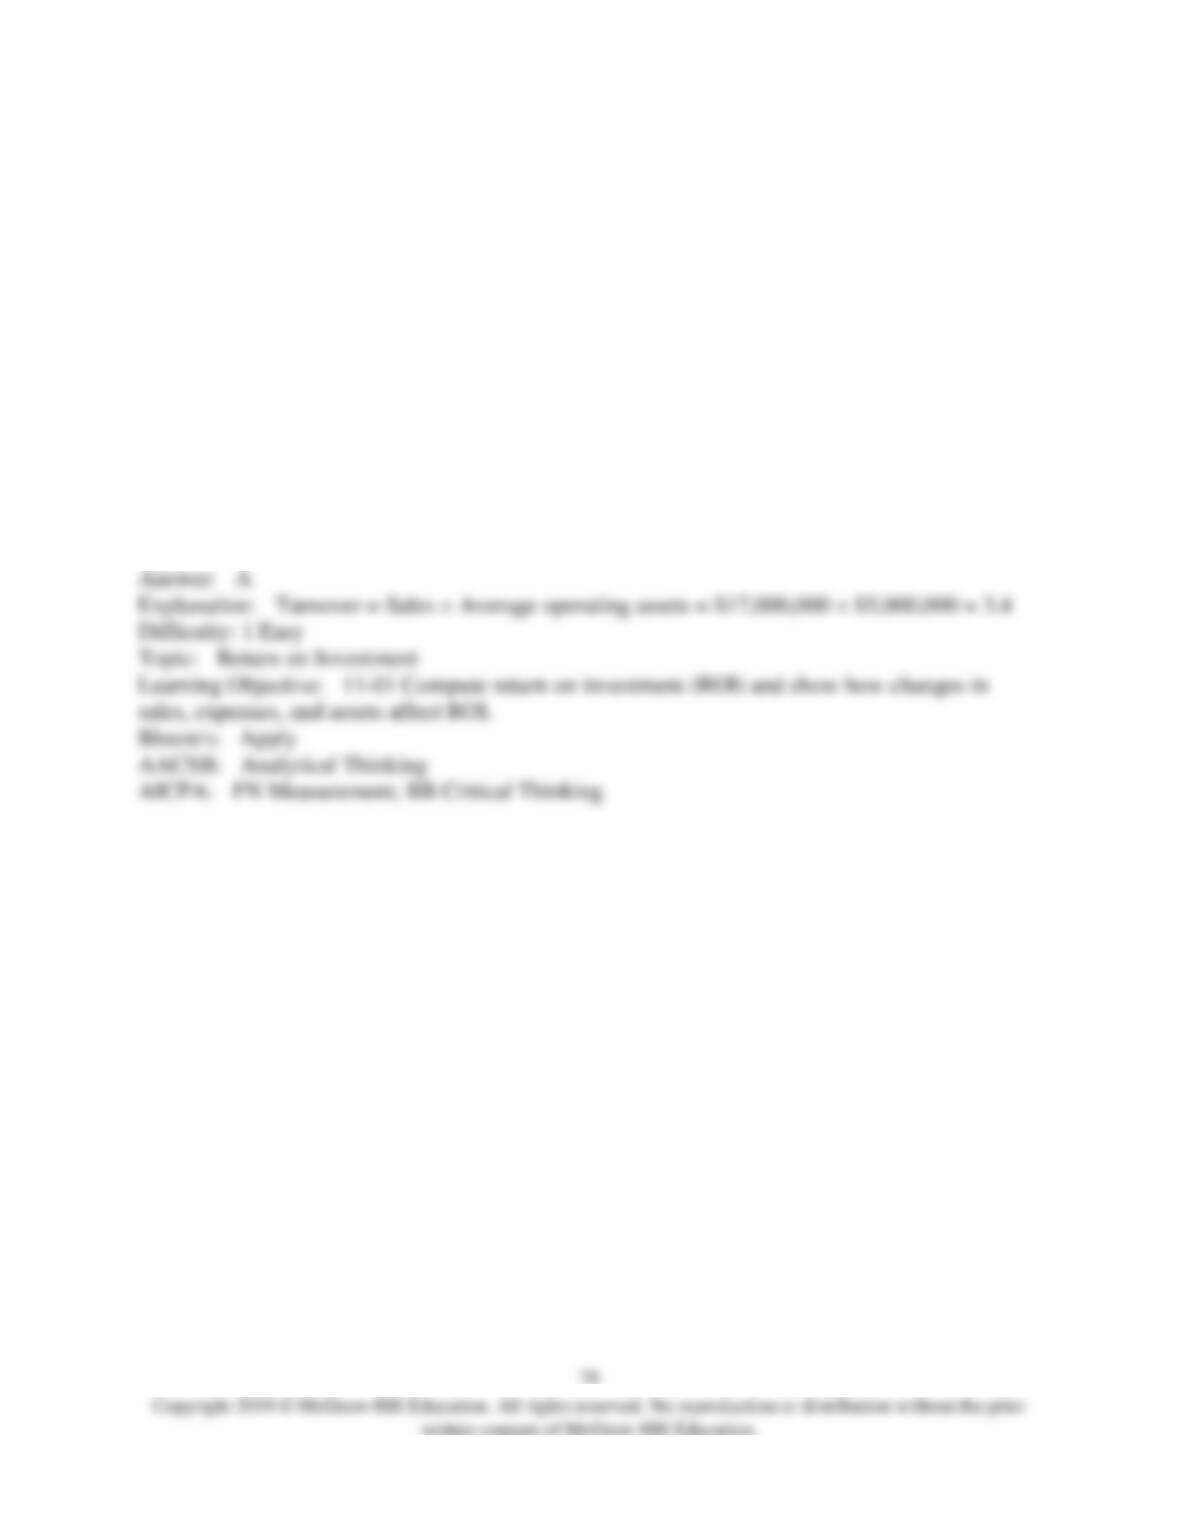
The division's turnover is closest to:
A) 3.40
B) 10.75
C) 2.58
D) 0.32
112) Agustin Industries is a division of a major corporation. Data concerning the most recent
year appears below:
Sales
$
17,000,000
Net operating income
$
1,581,000
Average operating assets
$
5,000,000
The division's return on investment (ROI) is closest to:
A) 24.0%
B) 31.62%
C) 3.0%
D) 9.3%
113) Serie Inc. reported the following results from last year's operations:
Sales
$
16,800,000
Variable expenses
10,640,000
Contribution margin
6,160,000
Fixed expenses
5,488,000
Net operating income
$
672,000
Average operating assets
$
7,000,000
-
At the beginning of this year, the company has a $2,100,000 investment opportunity with the
following characteristics:
Sales
$
2,520,000
Contribution margin ratio
50
% of sales
Fixed expenses
$
1,108,800
-
Last year's margin was closest to:
A) 36.7%
B) 67.3%
C) 9.6%
D) 4.0%


