1-240
1-241
158.
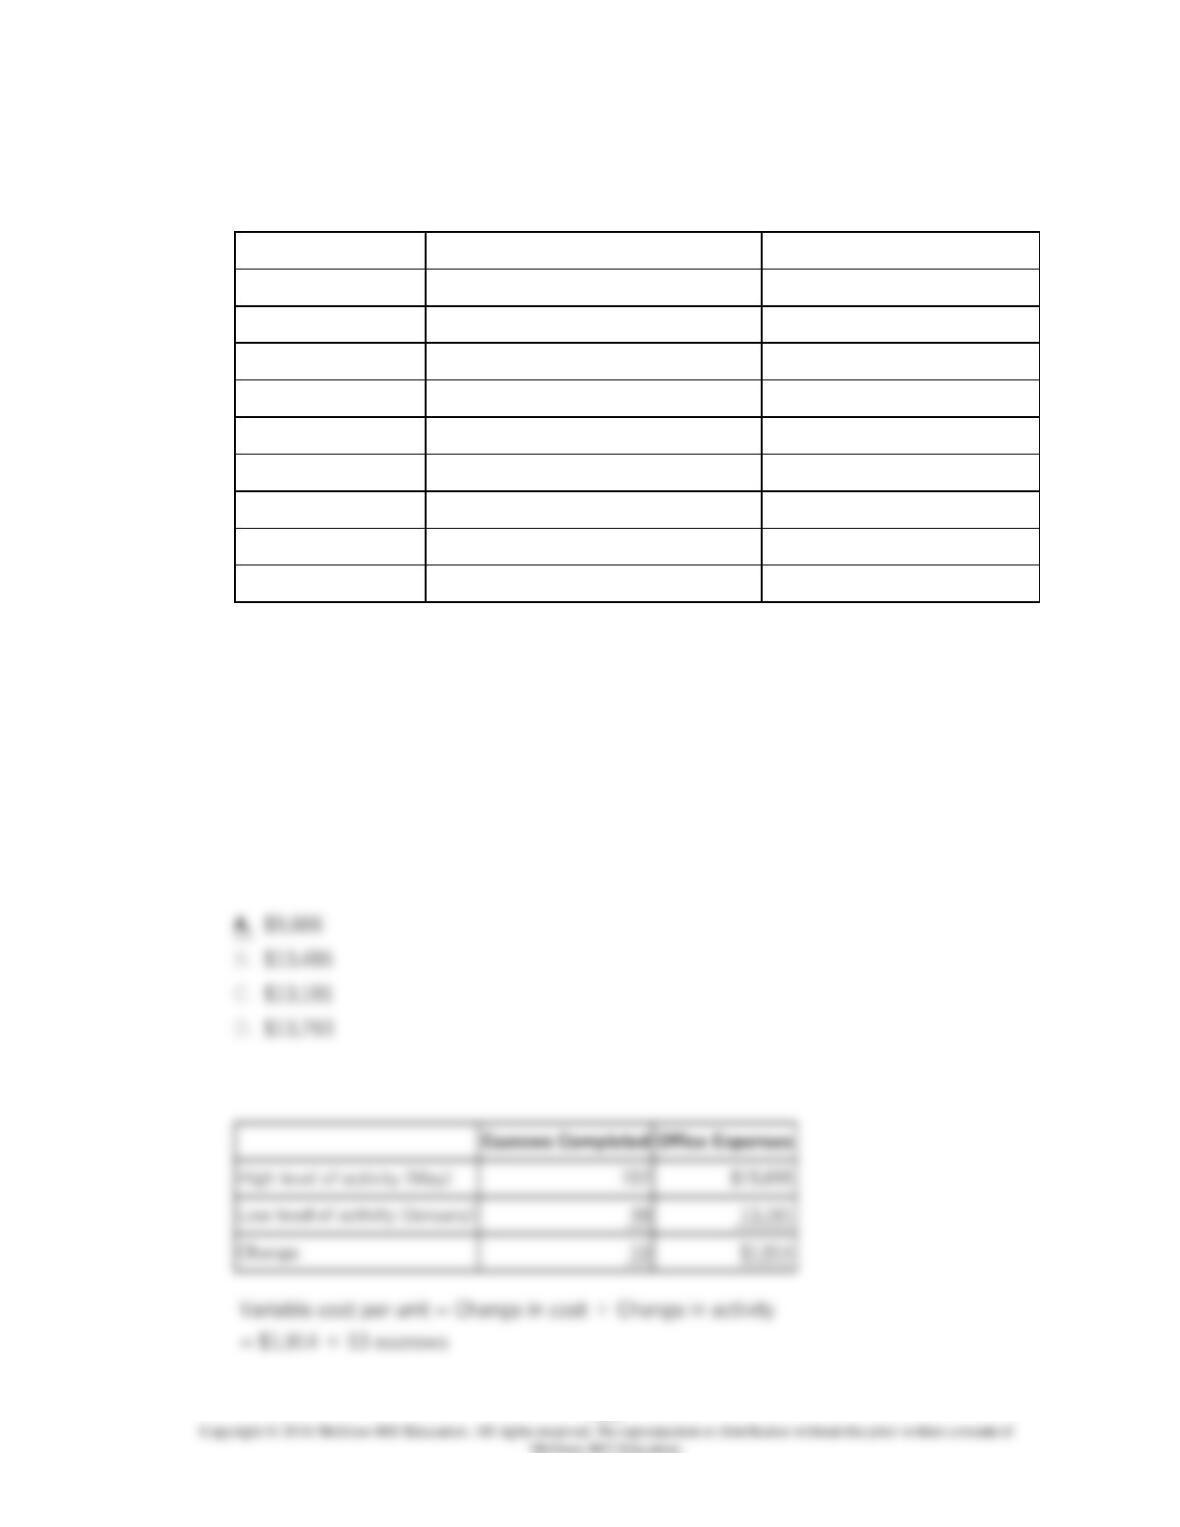
Cardillo Inc., an escrow agent, has provided the following data concerning its office
expenses:
Escrows Completed
Office Expenses
January
99
$13,181
February
111
$13,598
March
129
$14,239
April
133
$14,357
May
152
$15,095
June
104
$13,335
July
118
$13,847
August
100
$13,211
September
103
$13,283
Change
Management believes that office expense is a mixed cost that depends on the number of
escrows completed.
Note: Real estate purchases usually involve the services of an escrow agent that holds
funds and prepares documents to complete the transaction.
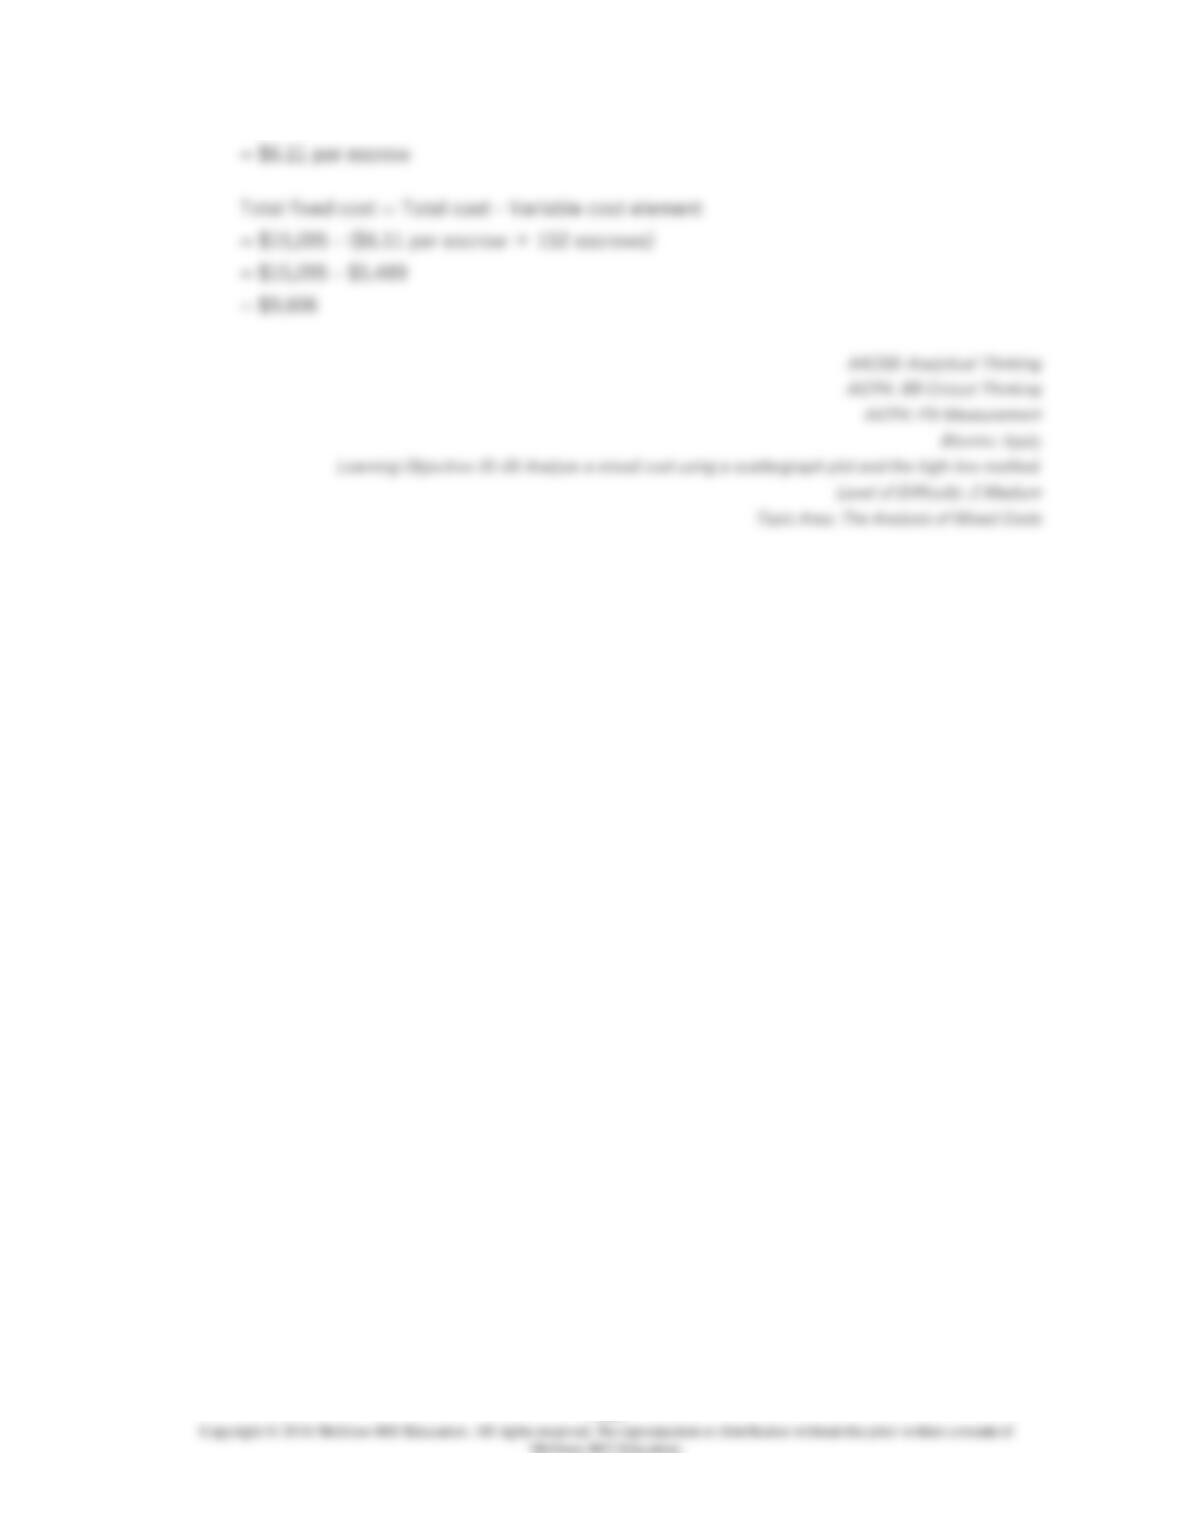
Using the high-low method, the estimate of the fixed component of office expense per
month is closest to:
1-242
159.
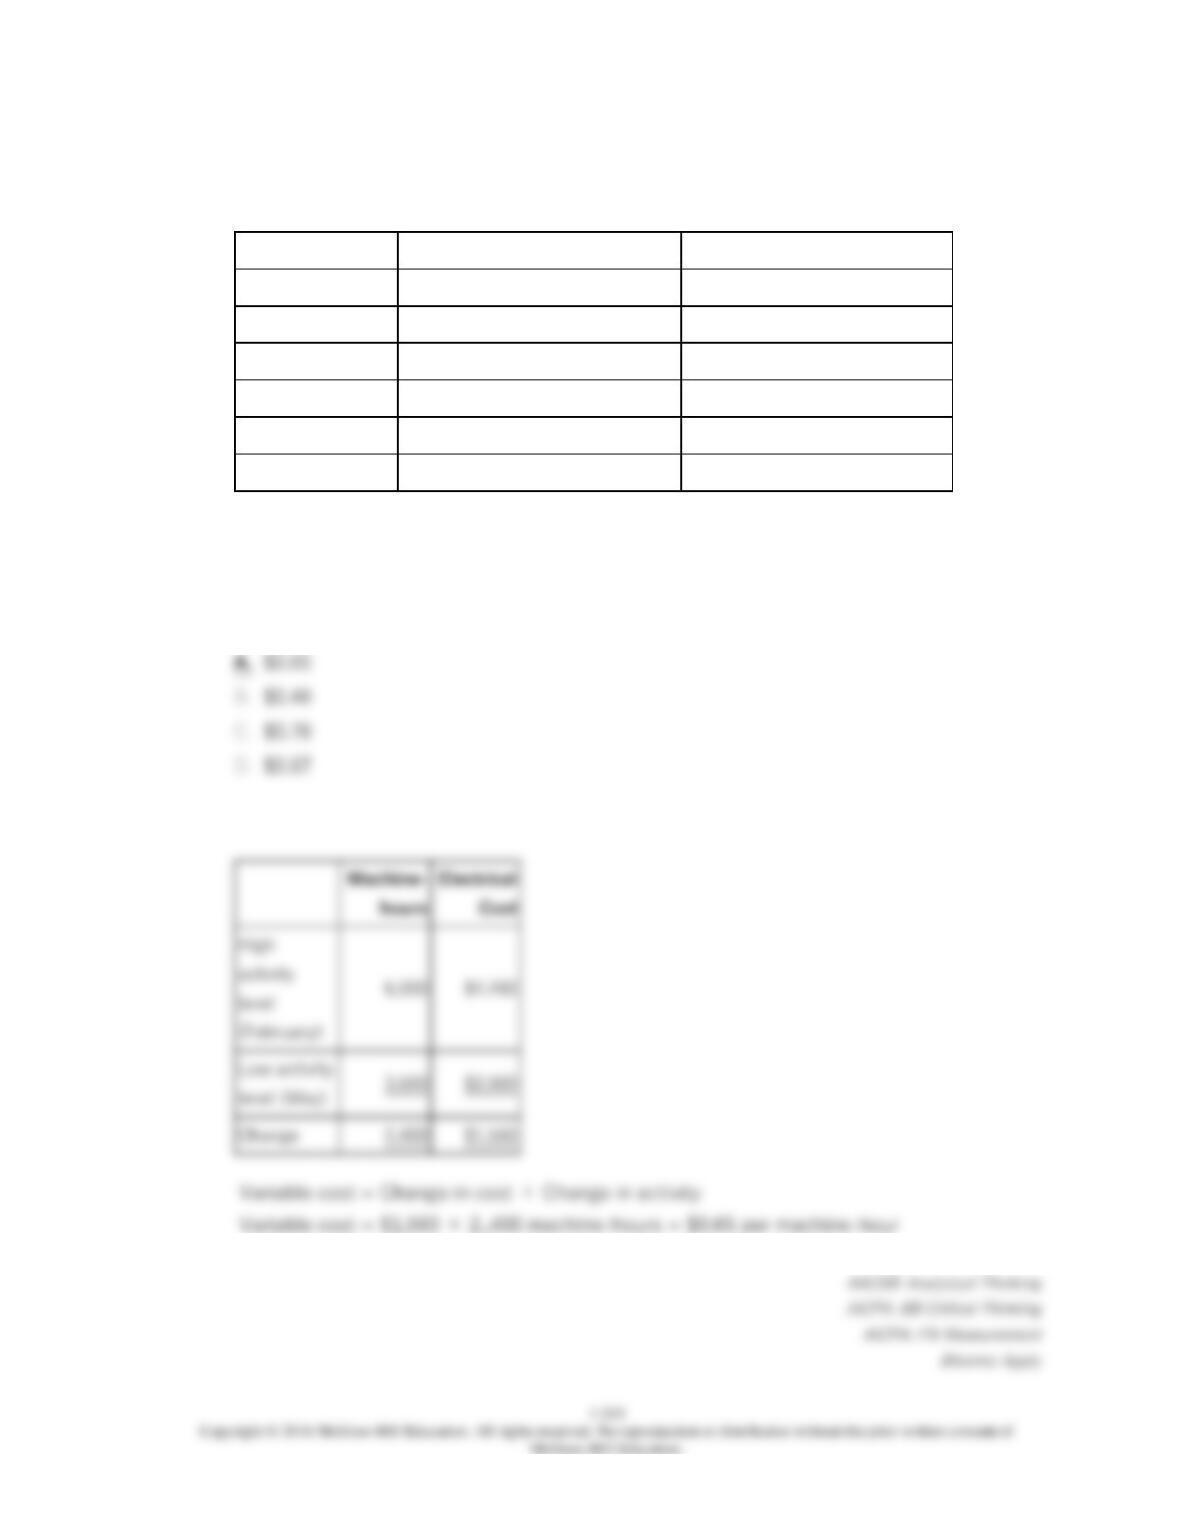
Data concerning Nelson Company’s activity for the first six months of the year appear
below:
Machine Hours
Electrical Cost
January
4,000
$3,120
February
6,000
$4,460
March
4,800
$3,500
April
3,800
$3,040
May
3,600
$2,900
June
4,200
$3,200
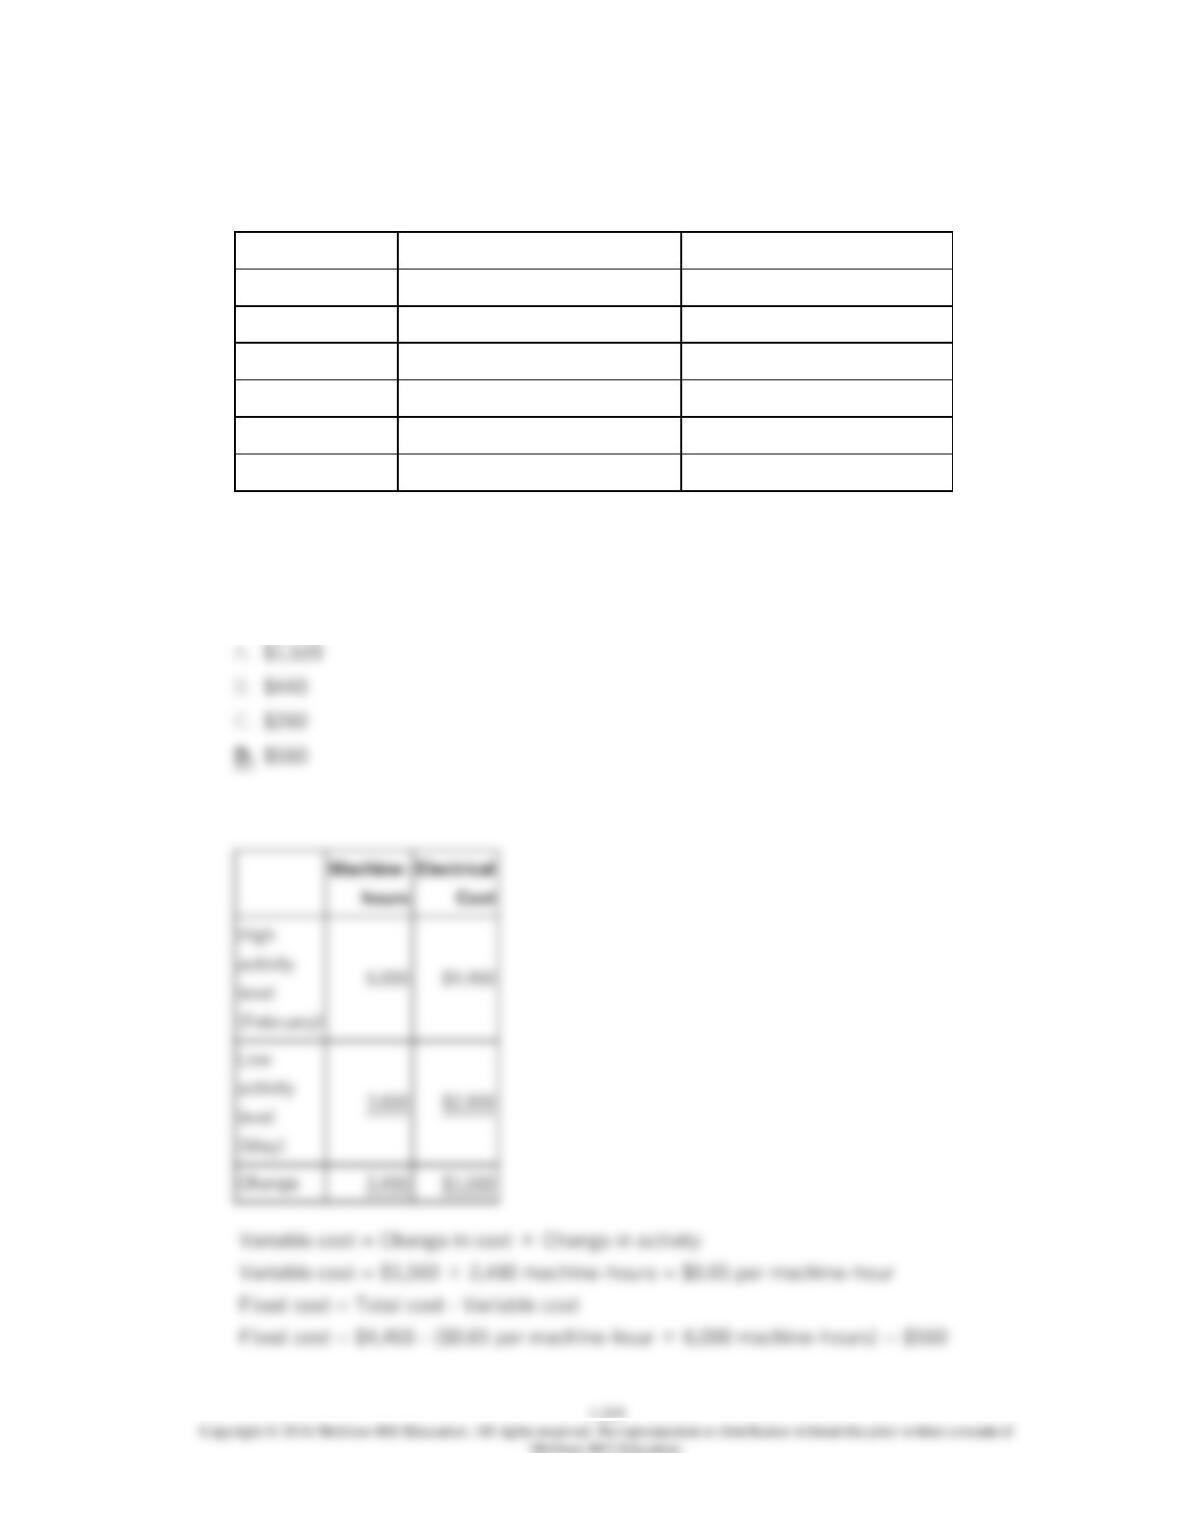
Using the high-low method of analysis, the estimated variable electrical cost per machine
hour is:
Change
1-244
160.
Data concerning Nelson Company’s activity for the first six months of the year appear
below:
Machine Hours
Electrical Cost
January
4,000
$3,120
February
6,000
$4,460
March
4,800
$3,500
April
3,800
$3,040
May
3,600
$2,900
June
4,200
$3,200
Using the high-low method of analysis, the estimated monthly fixed component of the
electrical cost is:
Change

1-246
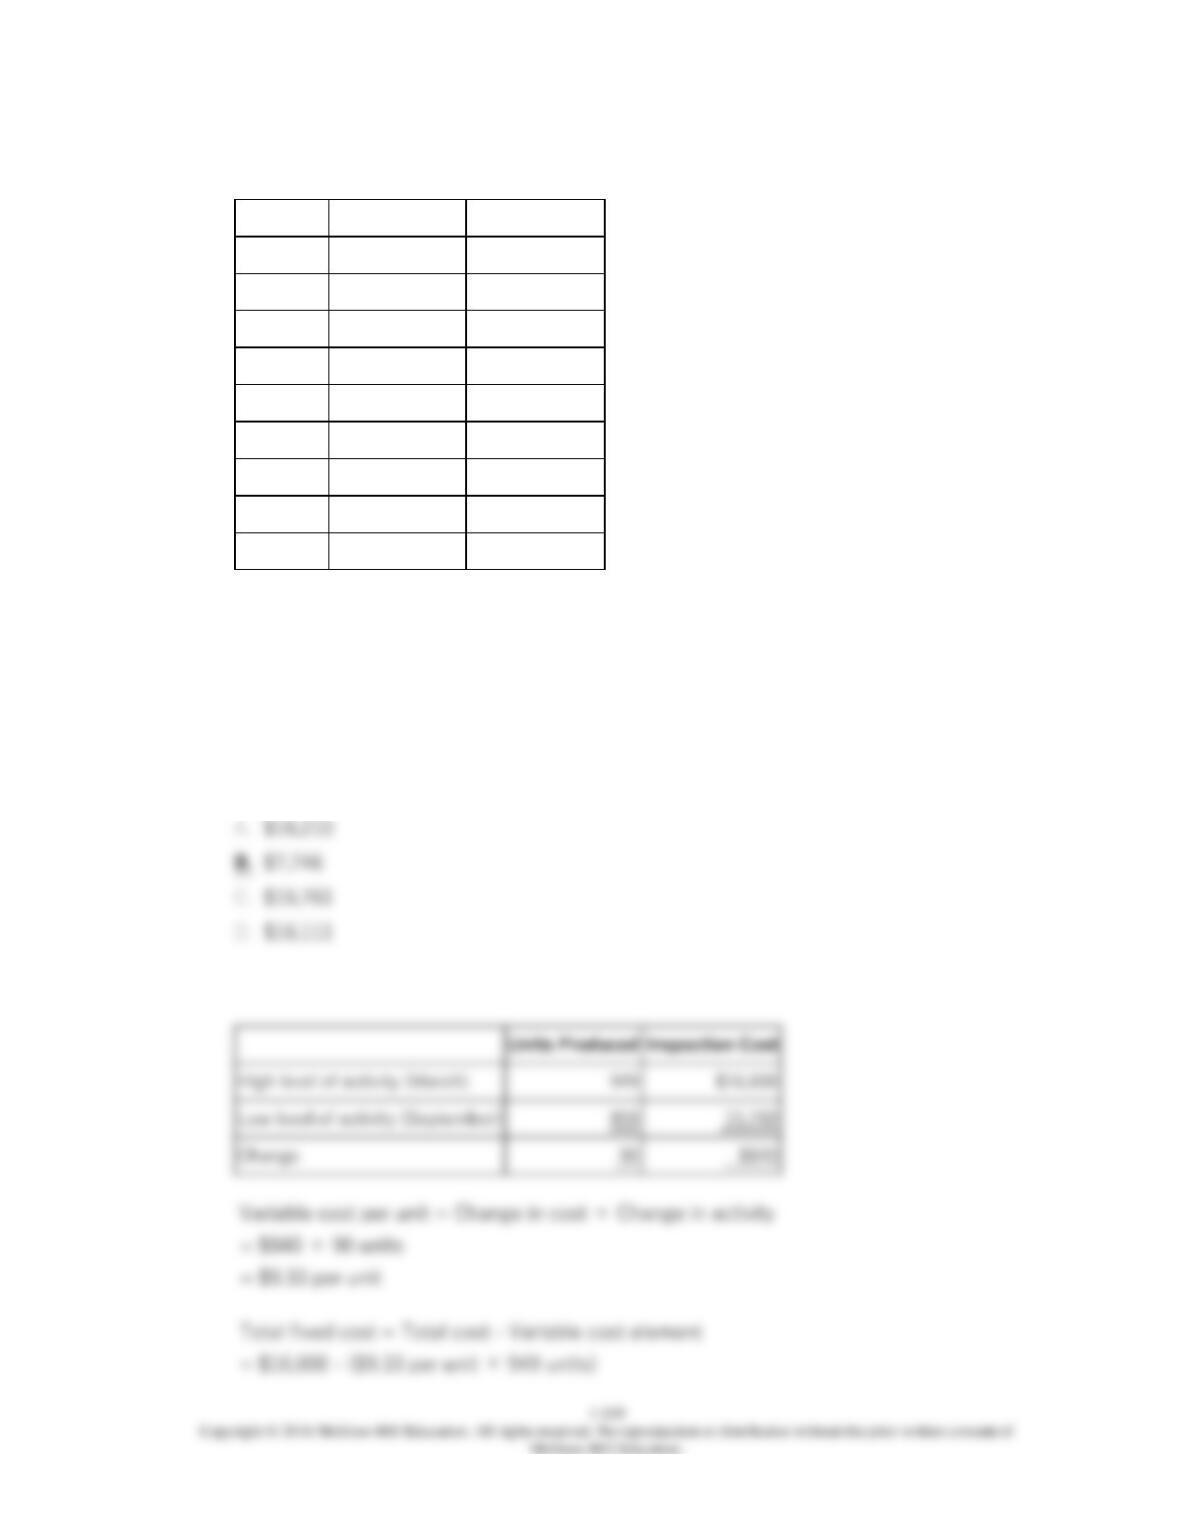
161.
Inspection costs at one of Iuliano Corporation’s factories are listed below:
Units Produced
Inspection Cost
February
905
$16,212
March
949
$16,600
April
911
$16,265
May
895
$16,110
June
917
$16,294
July
902
$16,180
August
919
$16,332
September
859
$15,760
October
898
$16,138
Management believes that inspection cost is a mixed cost that depends on units
produced.
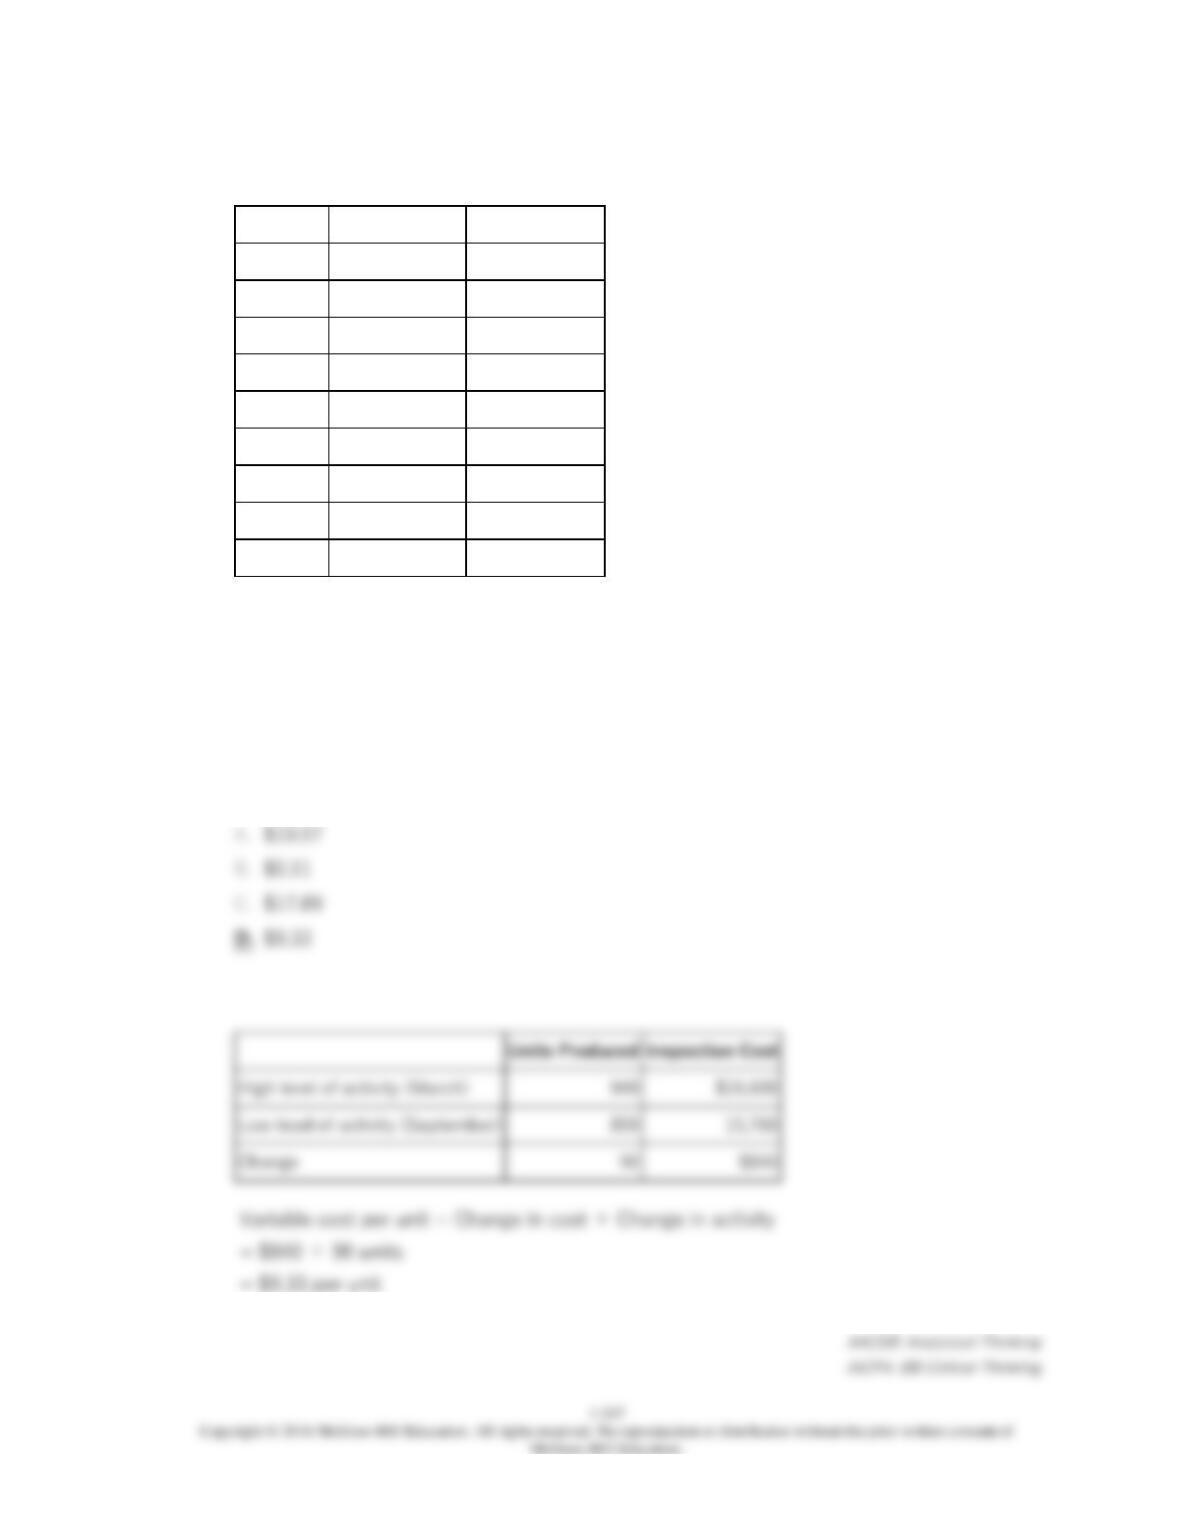
Using the high-low method, the estimate of the variable component of inspection cost per
unit produced is closest to:
Units Produced
Inspection Cost
$16,600
Change
1-248
162.
Inspection costs at one of Iuliano Corporation’s factories are listed below:
Units Produced
Inspection Cost
February
905
$16,212
March
949
$16,600
April
911
$16,265
May
895
$16,110
June
917
$16,294
July
902
$16,180
August
919
$16,332
September
859
$15,760
October
898
$16,138
Management believes that inspection cost is a mixed cost that depends on units
produced.
Using the high-low method, the estimate of the fixed component of inspection cost per
month is closest to:
Units Produced
Inspection Cost
$16,600
Change
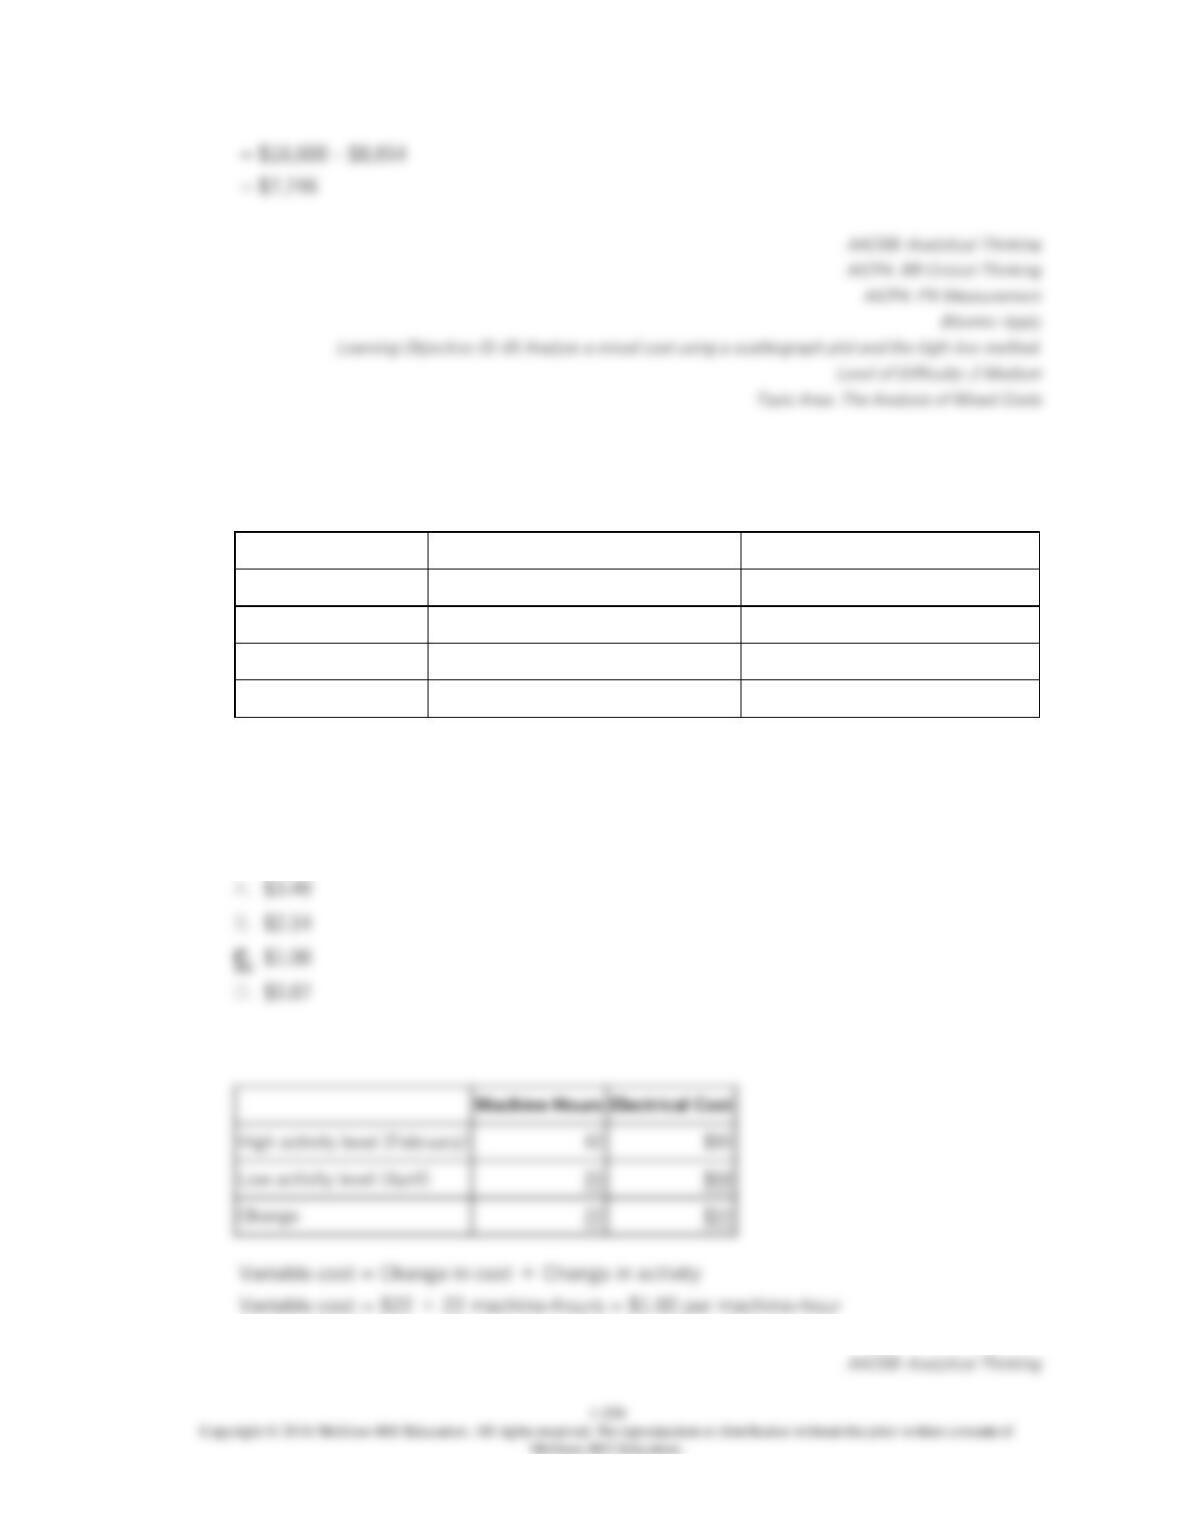
163.
Farnor, Inc., would like to estimate the variable and fixed components of its electrical
costs and has compiled the following data for the last four months of operations.
Machine Hours
Electrical Cost
January
30
$75
February
42
$90
March
35
$81
April
20
$68
Using the high-low method of analysis, the estimated variable cost per machine hour for
electricity is closest to:
Change
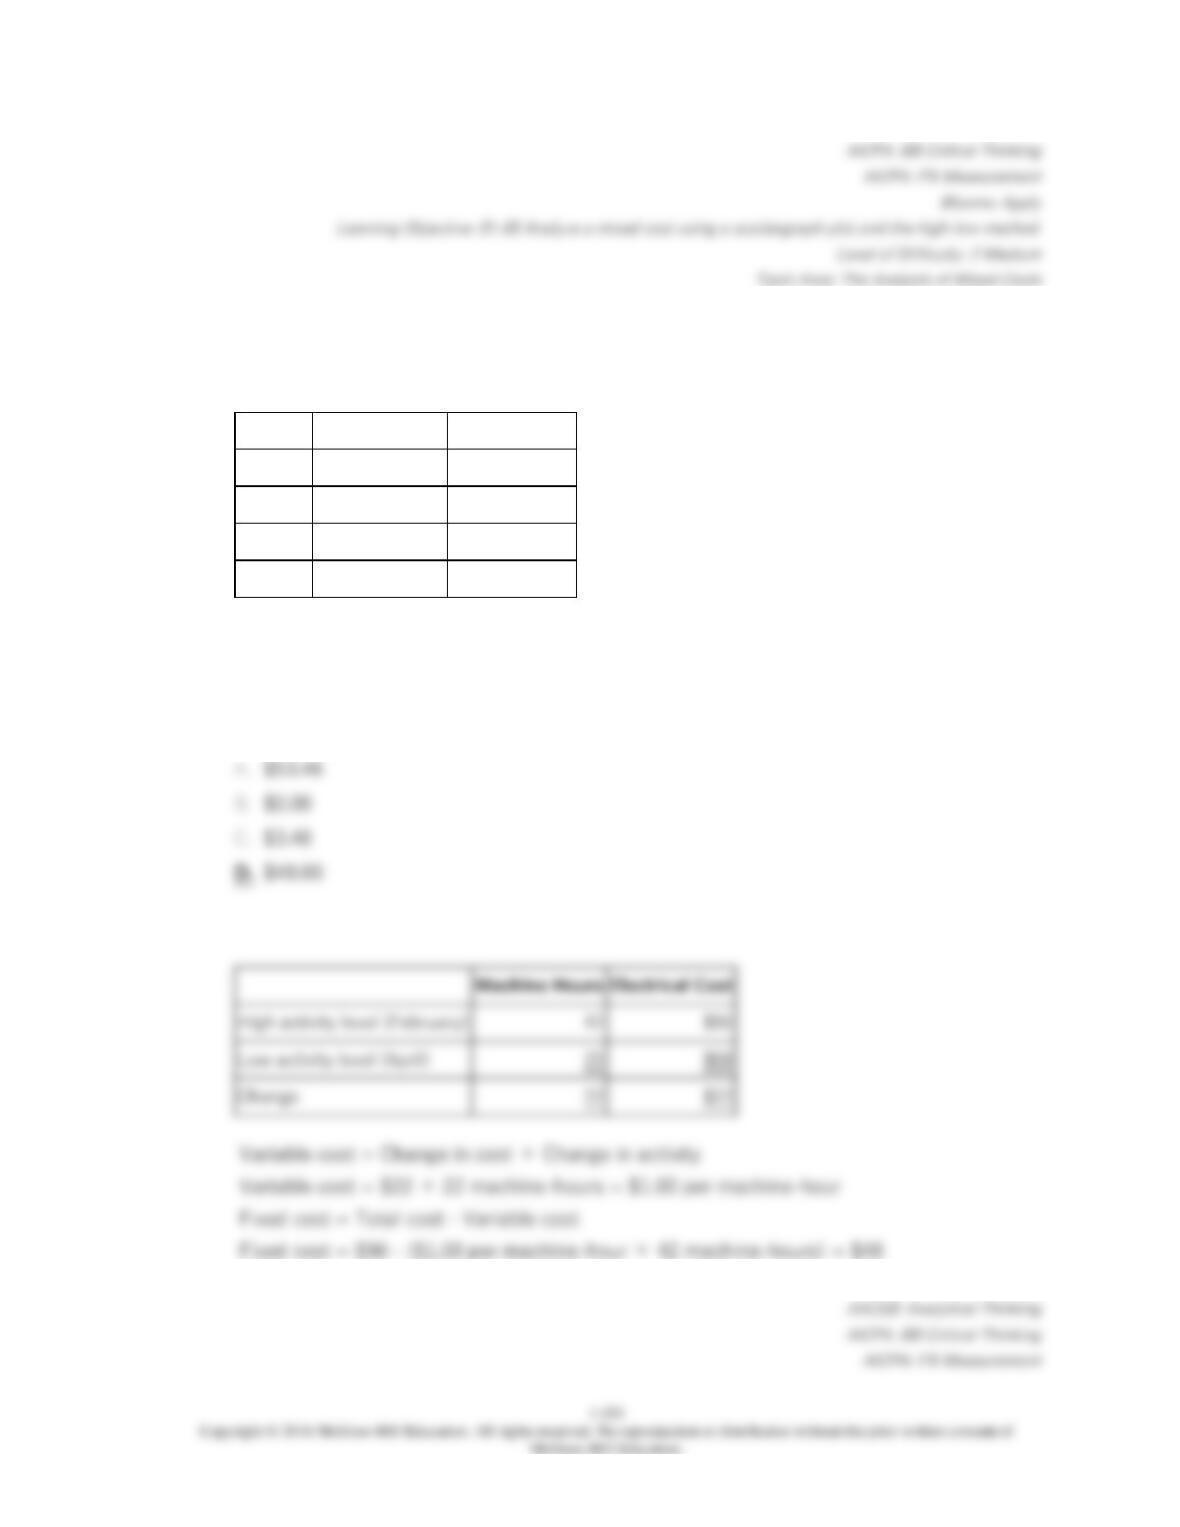
164.
Farnor, Inc., would like to estimate the variable and fixed components of its electrical
costs and has compiled the following data for the last four months of operations.
Machine Hours
Electrical Cost
January
30
$75
February
42
$90
March
35
$81
April
20
$68
Using the high-low method of analysis, the estimated fixed cost per month for electricity
is closest to:
Machine Hours
Electrical Cost
$90
$68
Change
$22
1-252
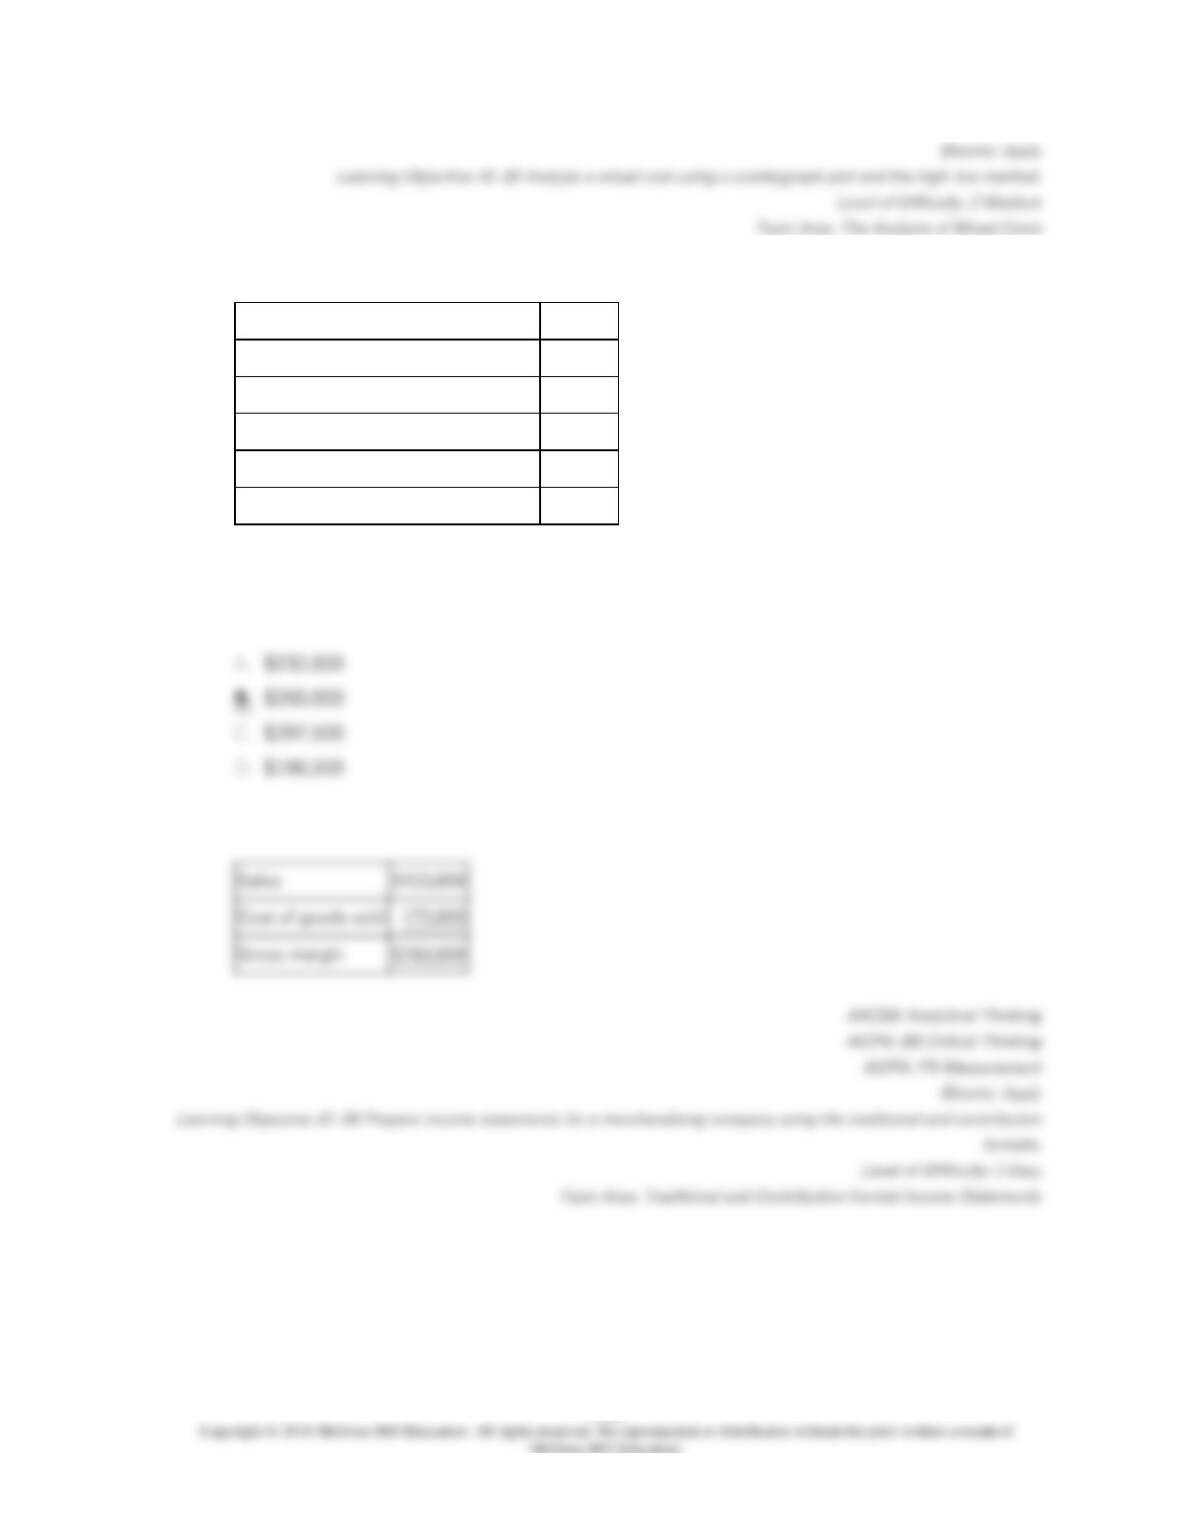
165.
Calip Corporation, a merchandising company, reported the following results for October:
Sales
$433,000
Cost of goods sold (all variable)
$173,000
Total variable selling expense
$18,000
Total fixed selling expense
$9,900
Total variable administrative expense
$10,000
Total fixed administrative expense
$25,600
Sales
$433,000
Cost of goods sold
Gross margin
$260,000
The gross margin for October is:
1-253
166.
Calip Corporation, a merchandising company, reported the following results for October:
Sales
$433,000
Cost of goods sold (all variable)
$173,000
Total variable selling expense
$18,000
Total fixed selling expense
$9,900
Total variable administrative expense
$10,000
Total fixed administrative expense
$25,600
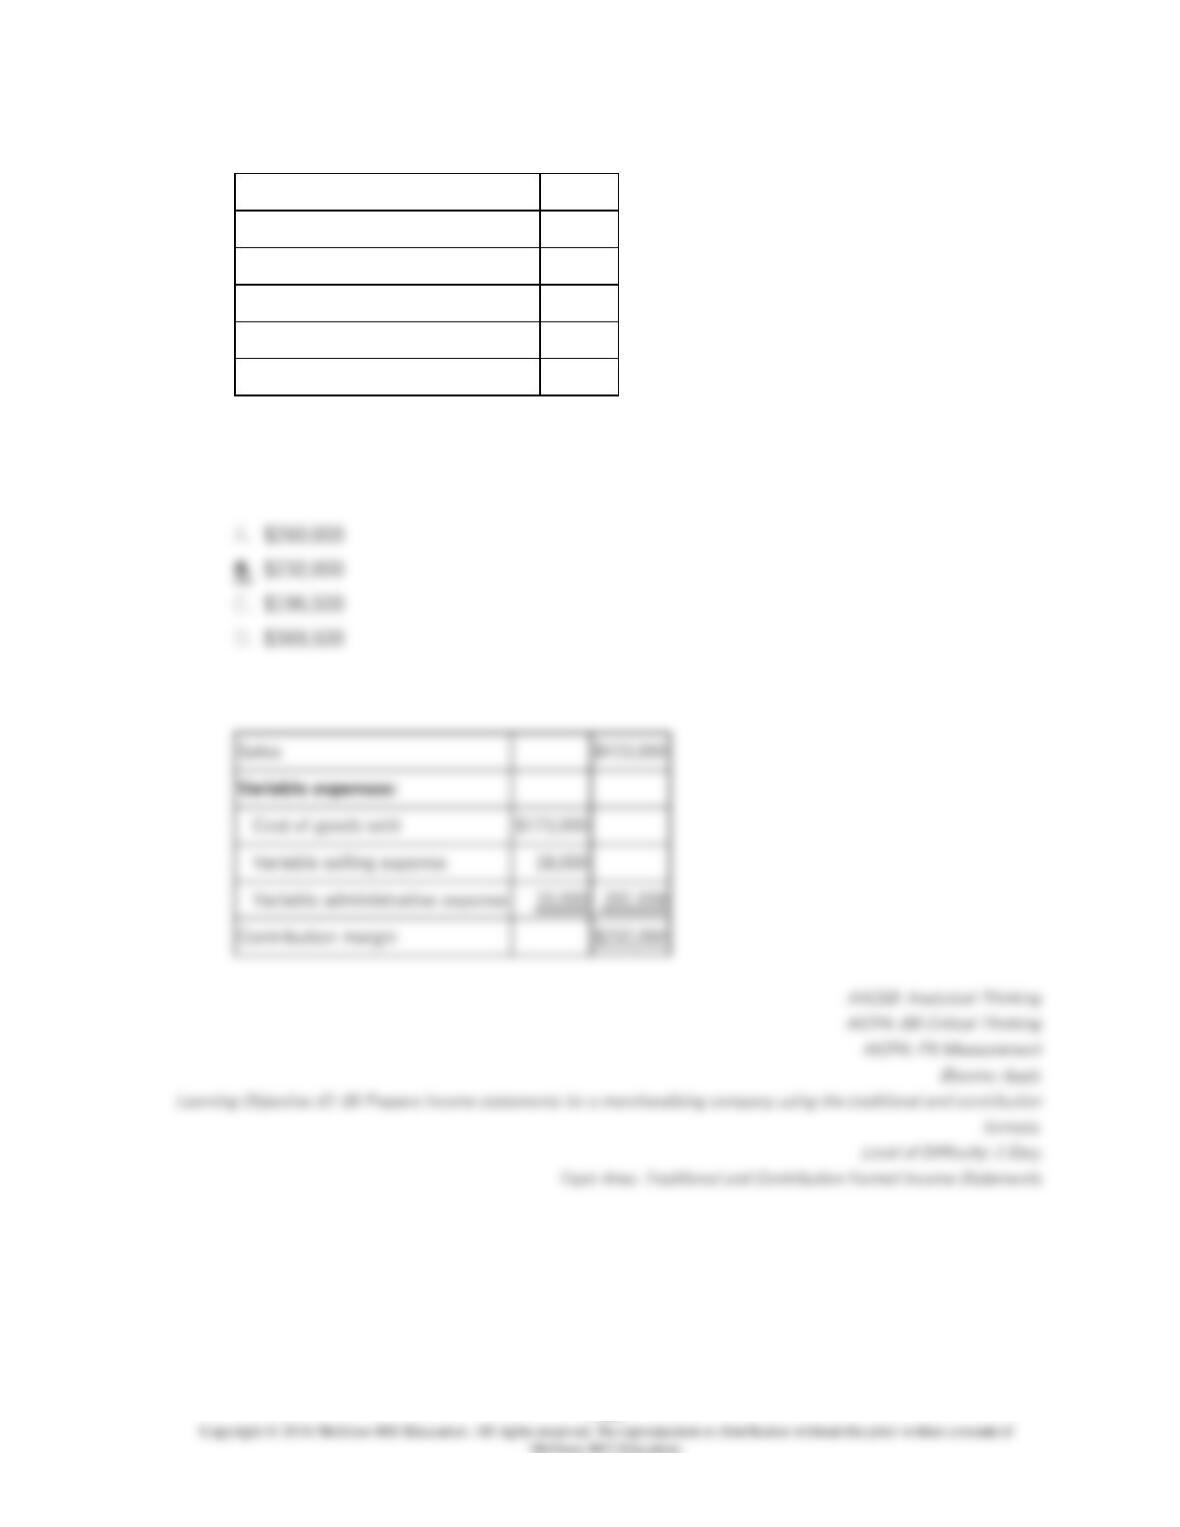
The contribution margin for October is:
Sales
$433,000
$173,000
18,000
10,000
Contribution margin
$232,000
1-254
167.
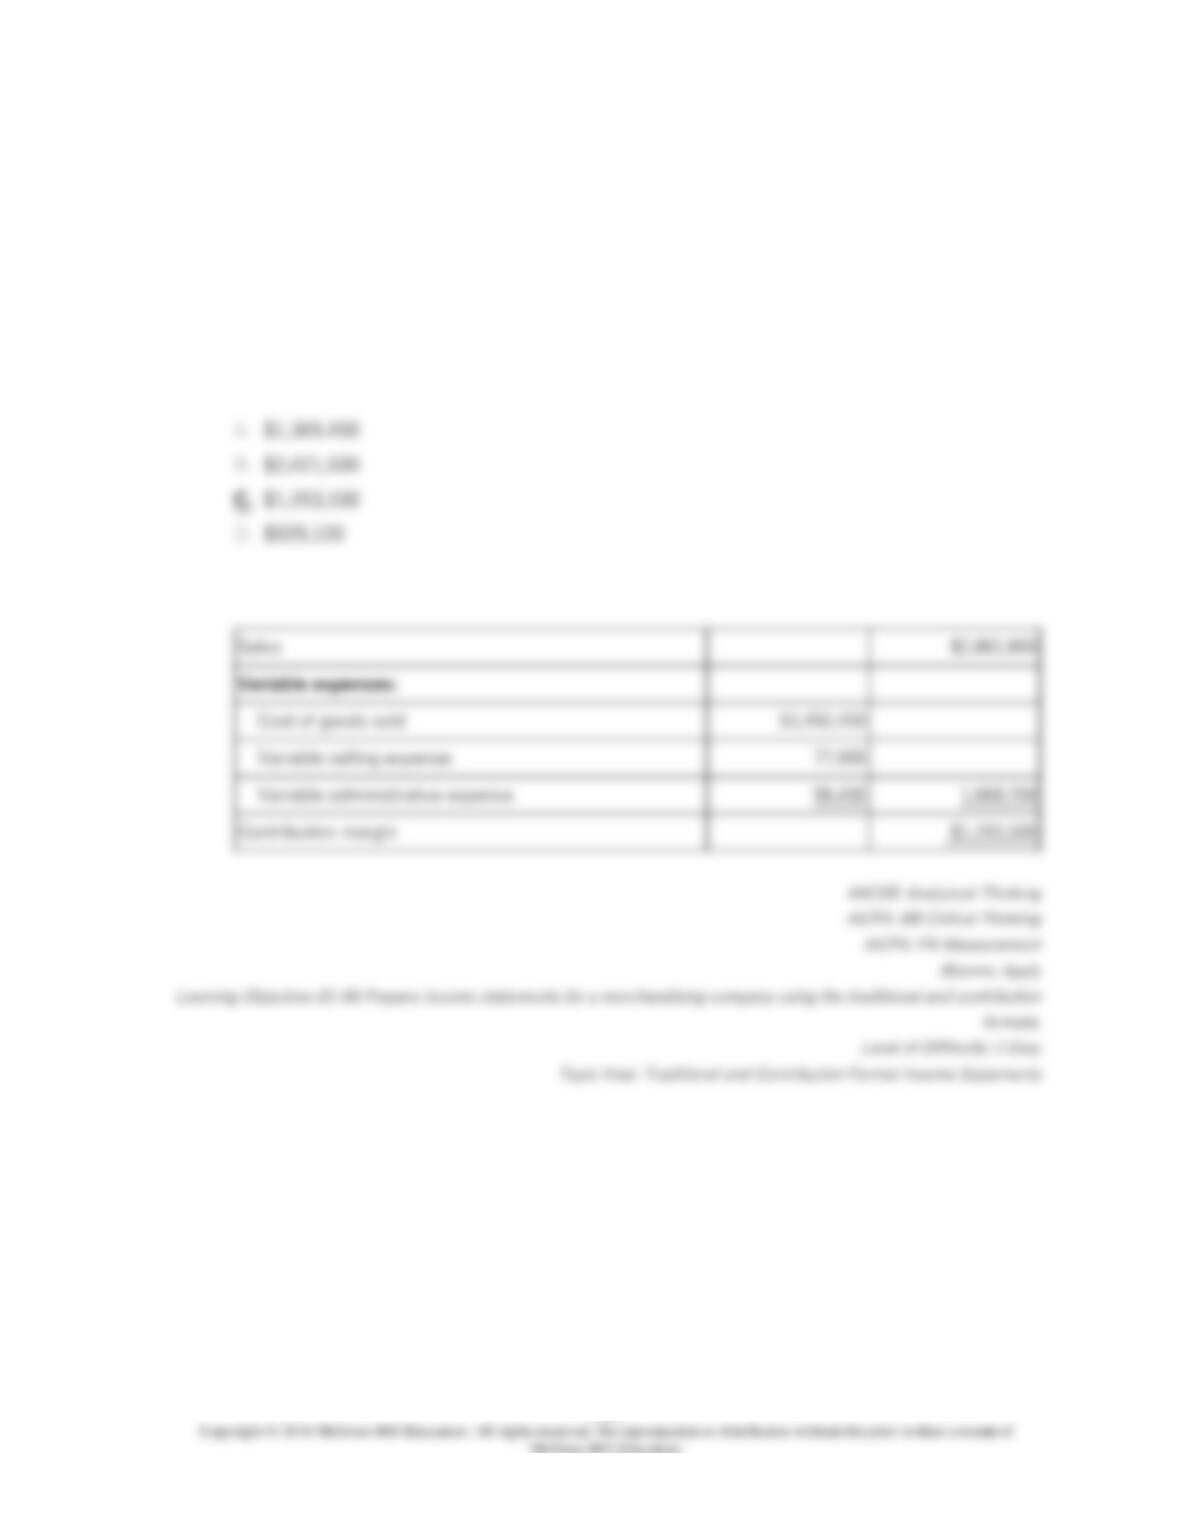
Tolden Marketing, Inc., a merchandising company, reported sales of $2,861,800 and cost
of goods sold of $1,492,400 for December. The company’s total variable selling expense
was $77,900; its total fixed selling expense was $70,600; its total variable administrative
expense was $98,400; and its total fixed administrative expense was $193,400. The cost of
goods sold in this company is a variable cost.
The contribution margin for December is:
1-255
168.
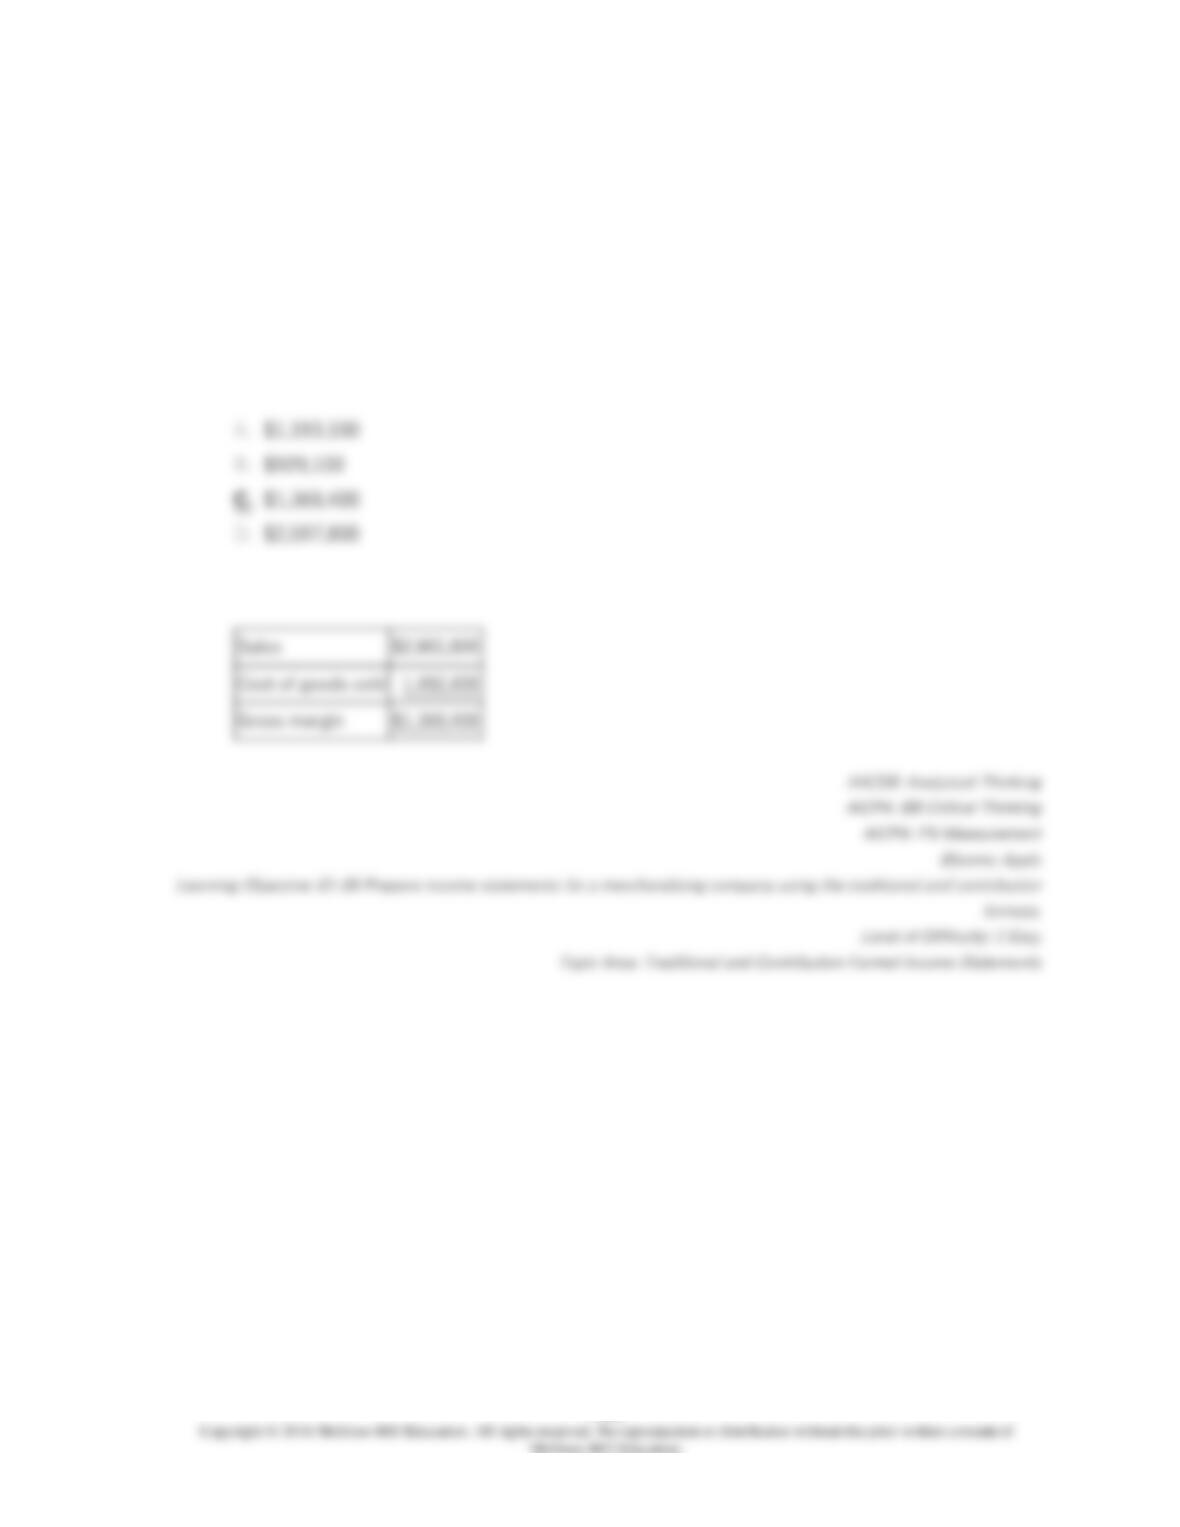
Tolden Marketing, Inc., a merchandising company, reported sales of $2,861,800 and cost
of goods sold of $1,492,400 for December. The company’s total variable selling expense
was $77,900; its total fixed selling expense was $70,600; its total variable administrative
expense was $98,400; and its total fixed administrative expense was $193,400. The cost of
goods sold in this company is a variable cost.
The gross margin for December is:
1-256
169.
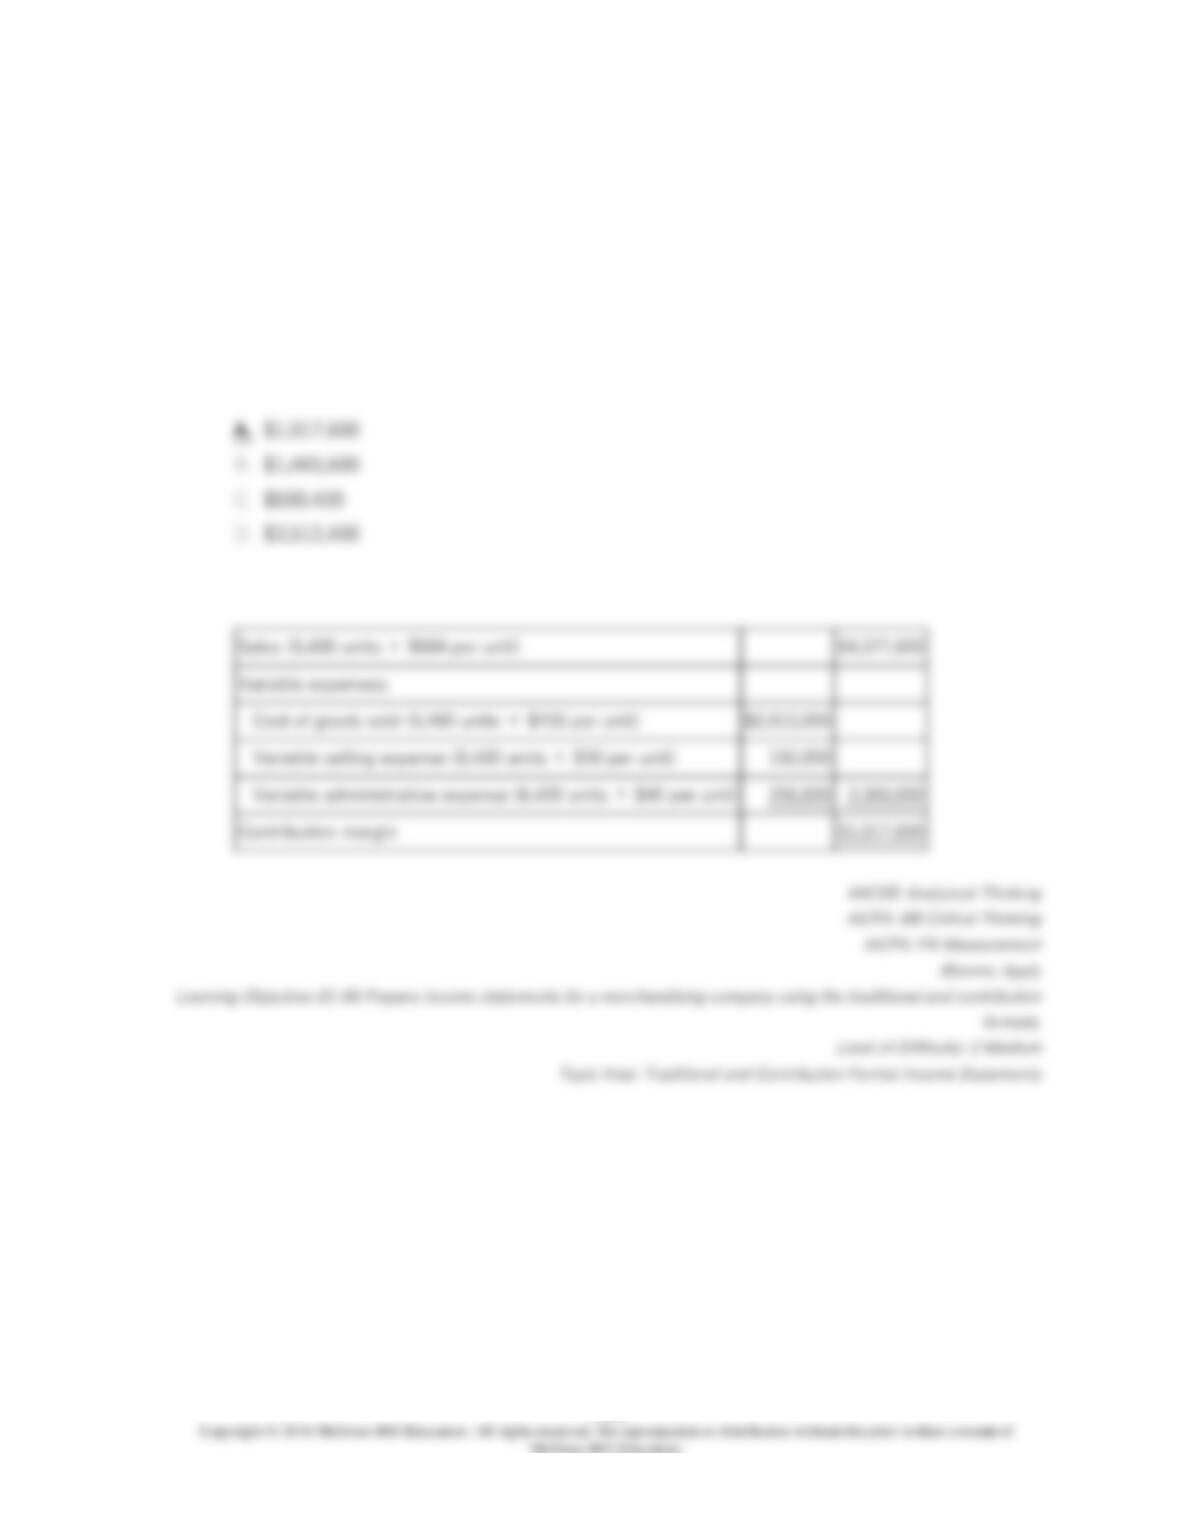
Ence Sales, Inc., a merchandising company, reported sales of 6,400 units in April at a
selling price of $684 per unit. Cost of goods sold, which is a variable cost, was $455 per
unit. Variable selling expenses were $30 per unit and variable administrative expenses
were $40 per unit. The total fixed selling expenses were $156,800 and the total
administrative expenses were $260,400.
The contribution margin for April was:
1-257
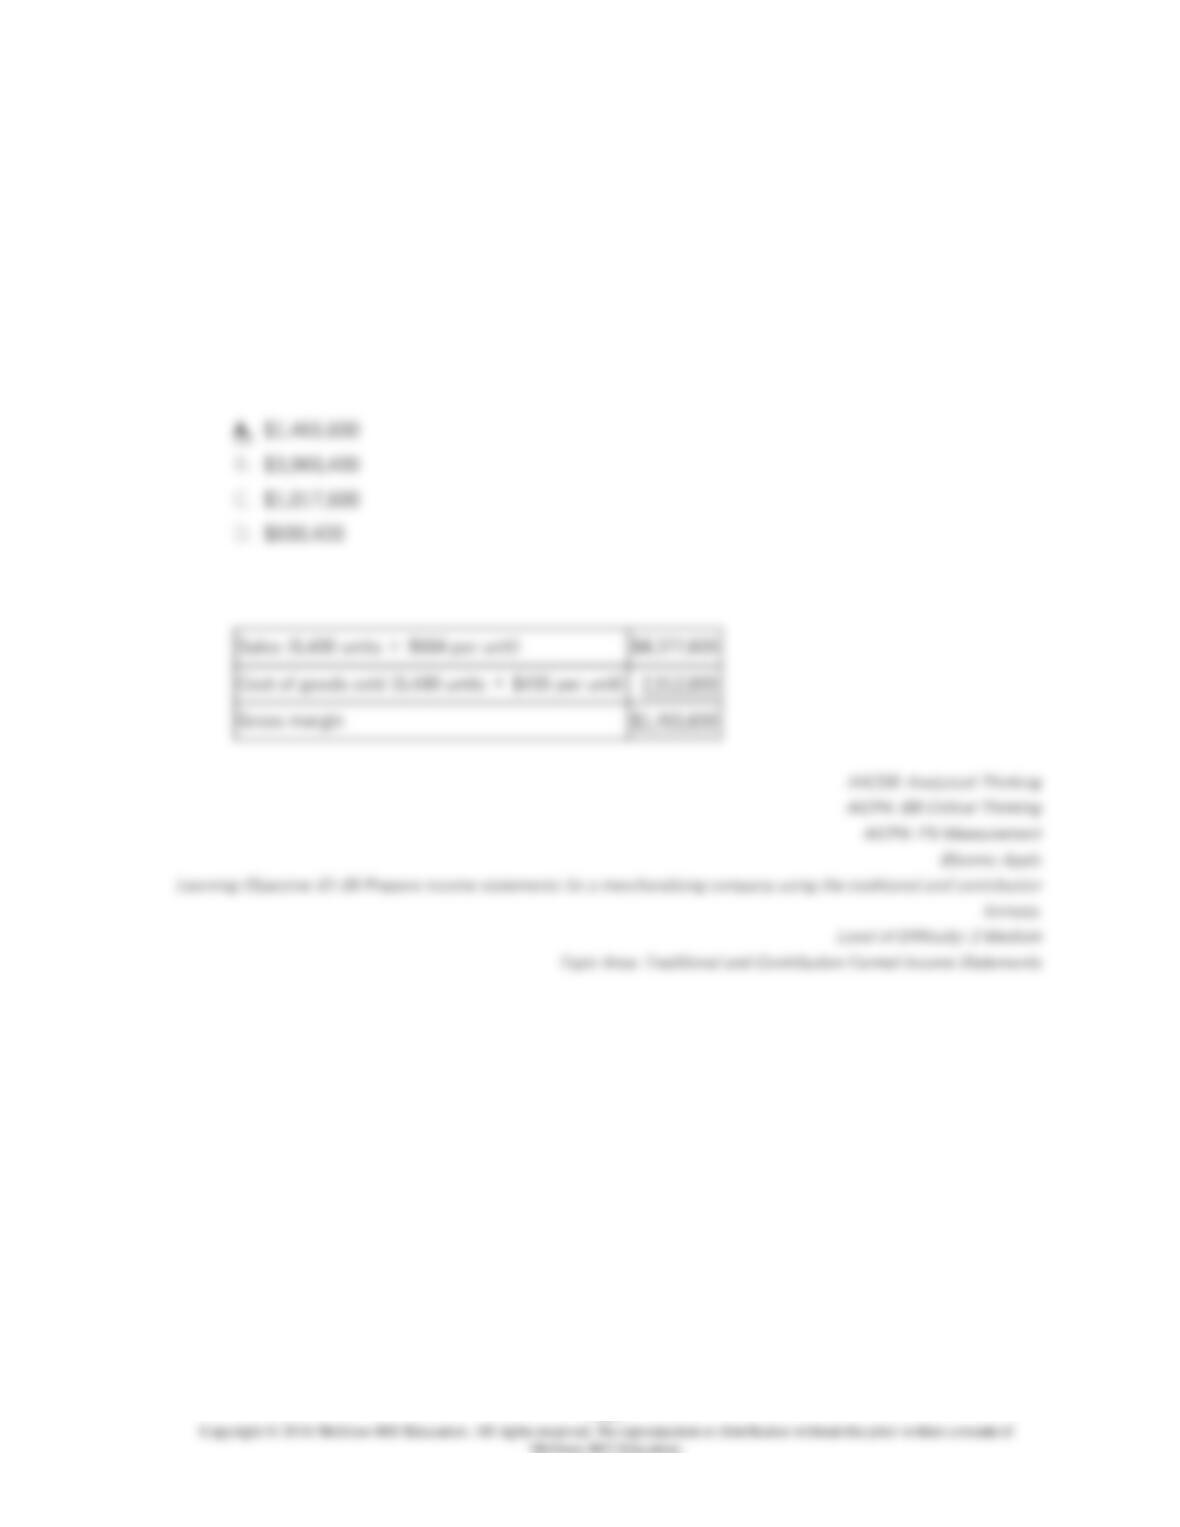
170.
Ence Sales, Inc., a merchandising company, reported sales of 6,400 units in April at a
selling price of $684 per unit. Cost of goods sold, which is a variable cost, was $455 per
unit. Variable selling expenses were $30 per unit and variable administrative expenses
were $40 per unit. The total fixed selling expenses were $156,800 and the total
administrative expenses were $260,400.
The gross margin for April was:
1-258
171.
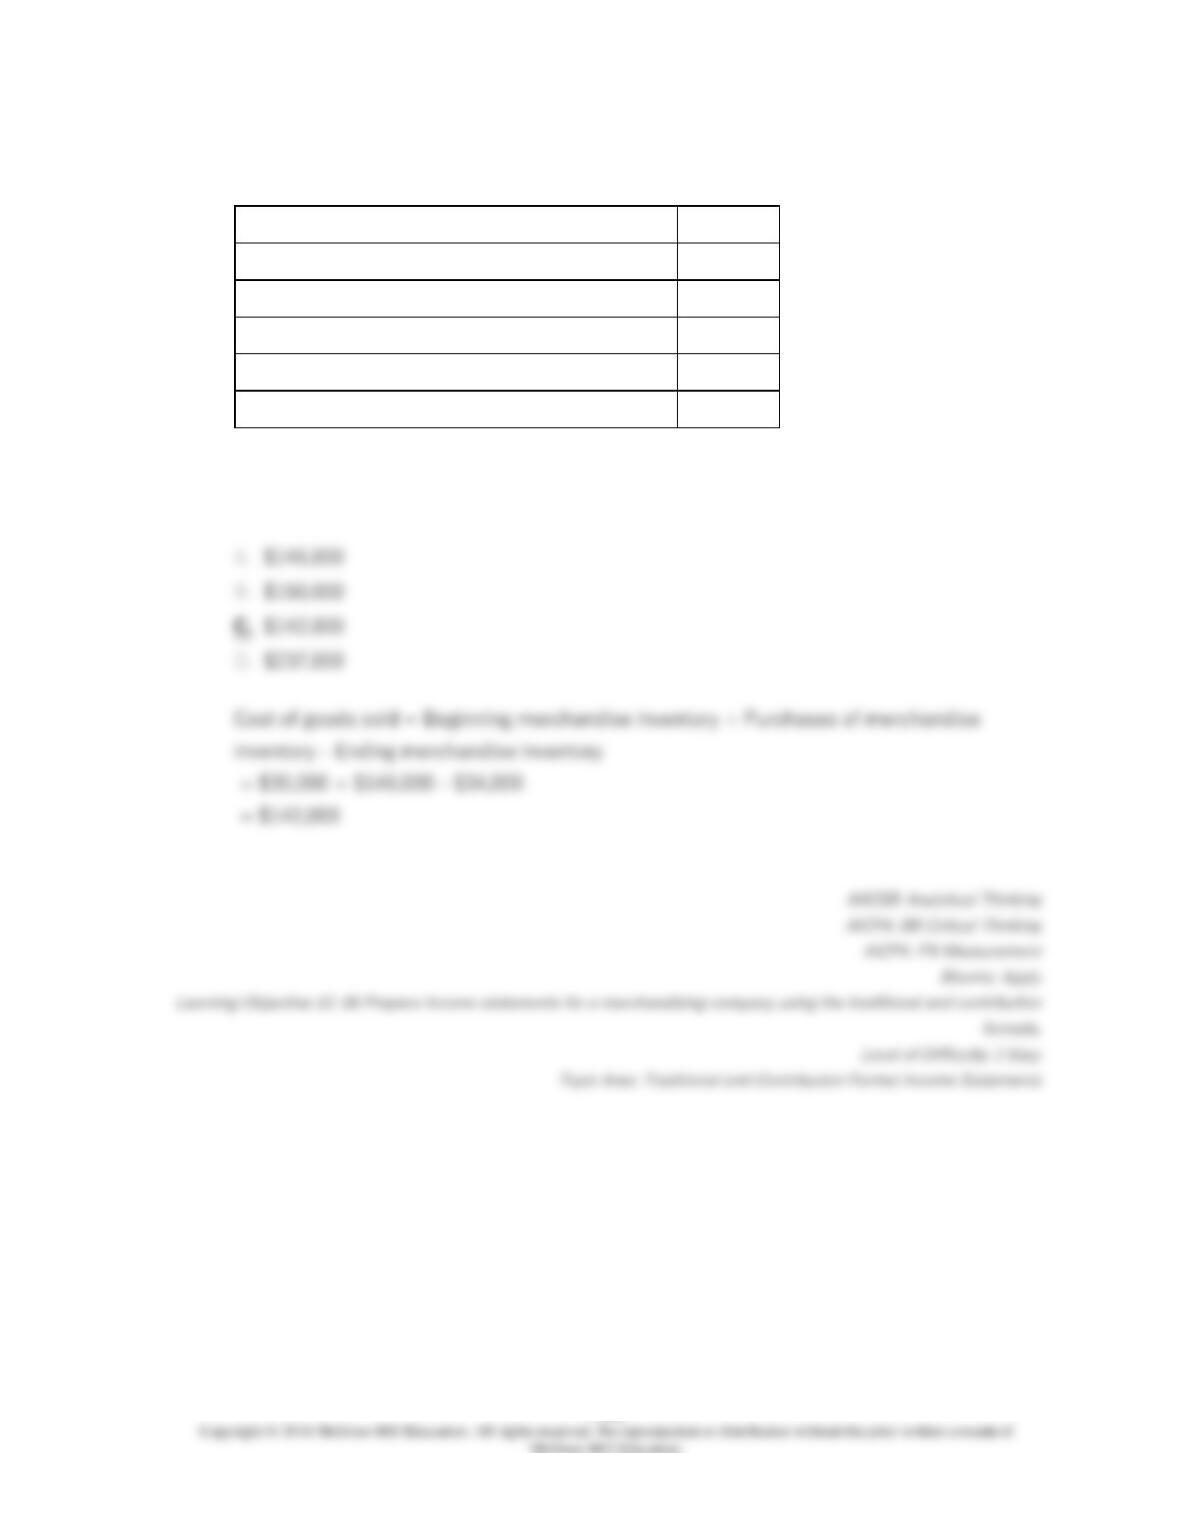
Nieman Inc., a local retailer, has provided the following data for the month of March:
Merchandise inventory, beginning balance
$30,000
Merchandise inventory, ending balance
$34,000
Sales
$280,000
Purchases of merchandise inventory
$146,000
Selling expense
$27,000
Administrative expense
$64,000
The cost of goods sold for March was:
1-259
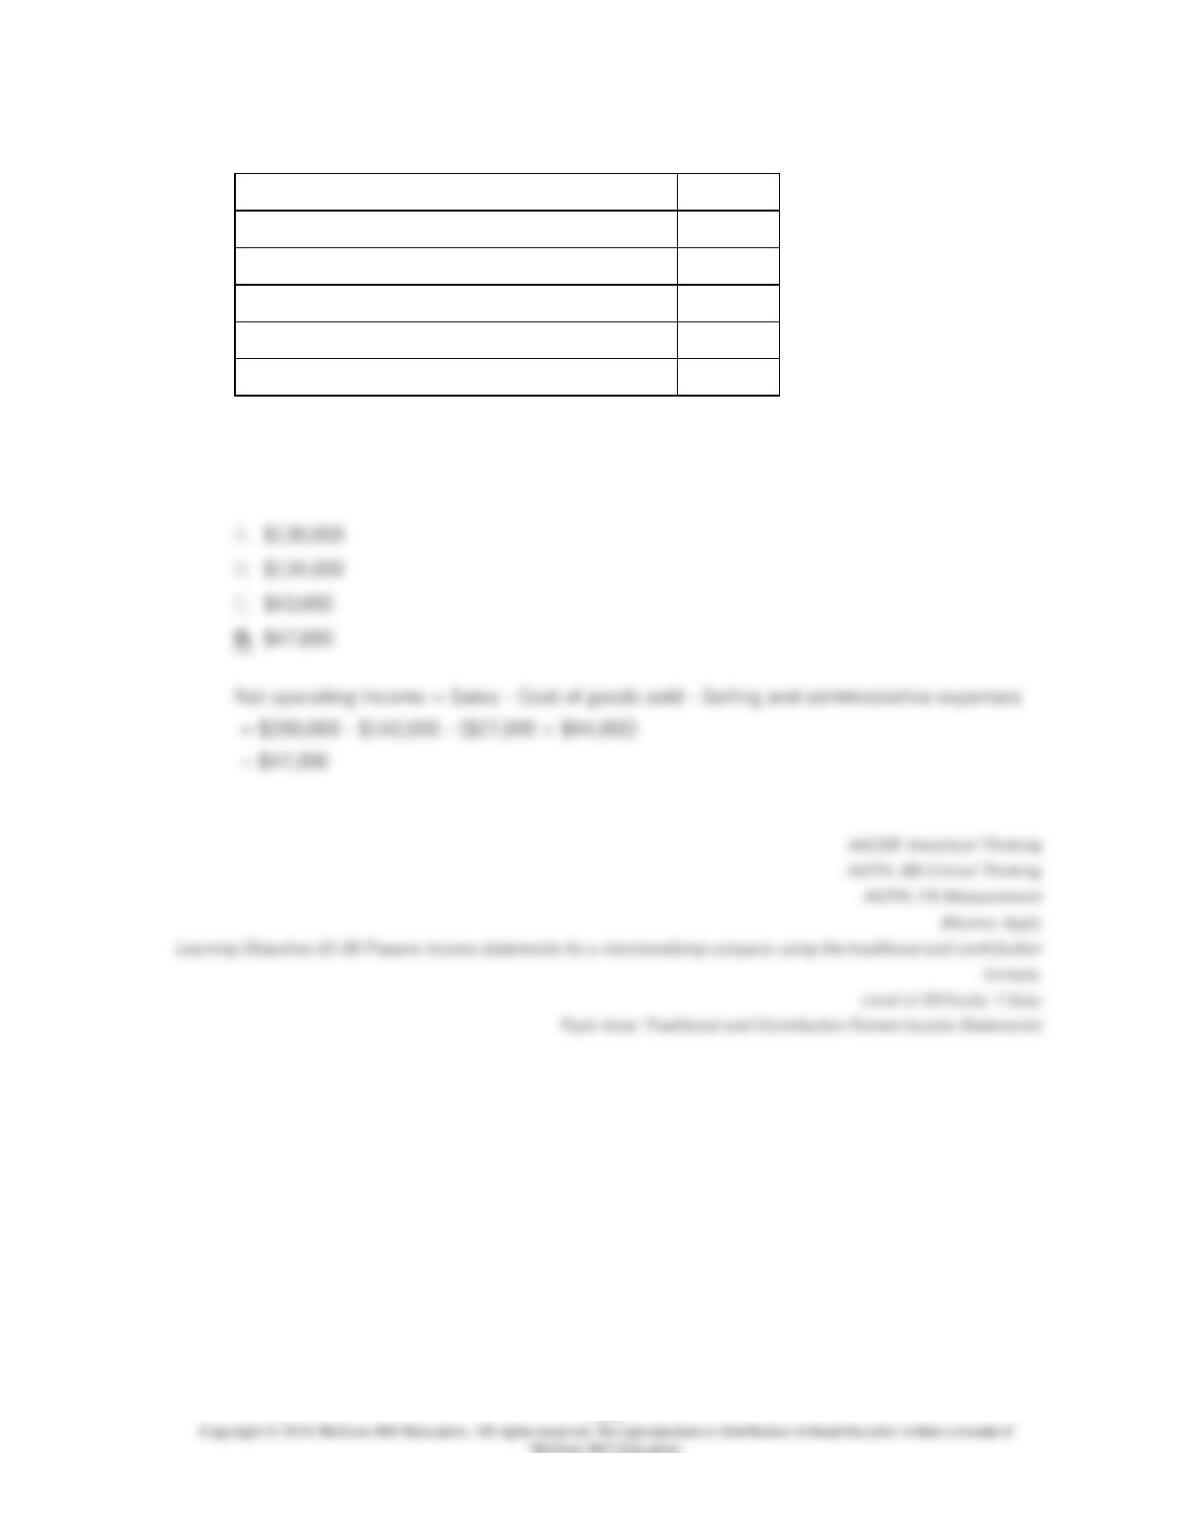
172.
Nieman Inc., a local retailer, has provided the following data for the month of March:
Merchandise inventory, beginning balance
$30,000
Merchandise inventory, ending balance
$34,000
Sales
$280,000
Purchases of merchandise inventory
$146,000
Selling expense
$27,000
Administrative expense
$64,000
The net operating income for March was: