1-200
131.
Kodama Corporation staffs a helpline to answer questions from customers. The costs of
operating the helpline are variable with respect to the number of calls in a month. At a
volume of 30,000 calls in a month, the costs of operating the helpline total $369,000.
To the nearest whole cent, what should be the average cost of operating the helpline per
call at a volume of 31,300 calls in a month? (Assume that this call volume is within the
relevant range.)
1-201
132.
Erkkila Inc. reports that at an activity level of 6,400 machine-hours in a month, its total
variable inspection cost is $423,680 and its total fixed inspection cost is $154,368.
What would be the average fixed inspection cost per unit at an activity level of 6,700
machine-hours in a month? Assume that this level of activity is within the relevant range.
1-202
133.
Erkkila Inc. reports that at an activity level of 6,400 machine-hours in a month, its total
variable inspection cost is $423,680 and its total fixed inspection cost is $154,368.
What would be the total variable inspection cost at an activity level of 6,700 machine-
hours in a month? Assume that this level of activity is within the relevant range.
1-203
134.
Comparative income statements for Tudor Retailing Company for the last two months are
presented below:
September
October
Sales in units
5,000
7,000
Sales revenue
$100,000
$140,000
Cost of goods sold
40,000
56,000
Gross margin
60,000
84,000
Selling and administrative expenses:
Shipping expense
7,500
10,500
Clerical expense
10,000
12,000
Maintenance expense
17,000
17,000
Total selling and administrative expense
34,500
39,500
Net operating income
$25,500
$44,500
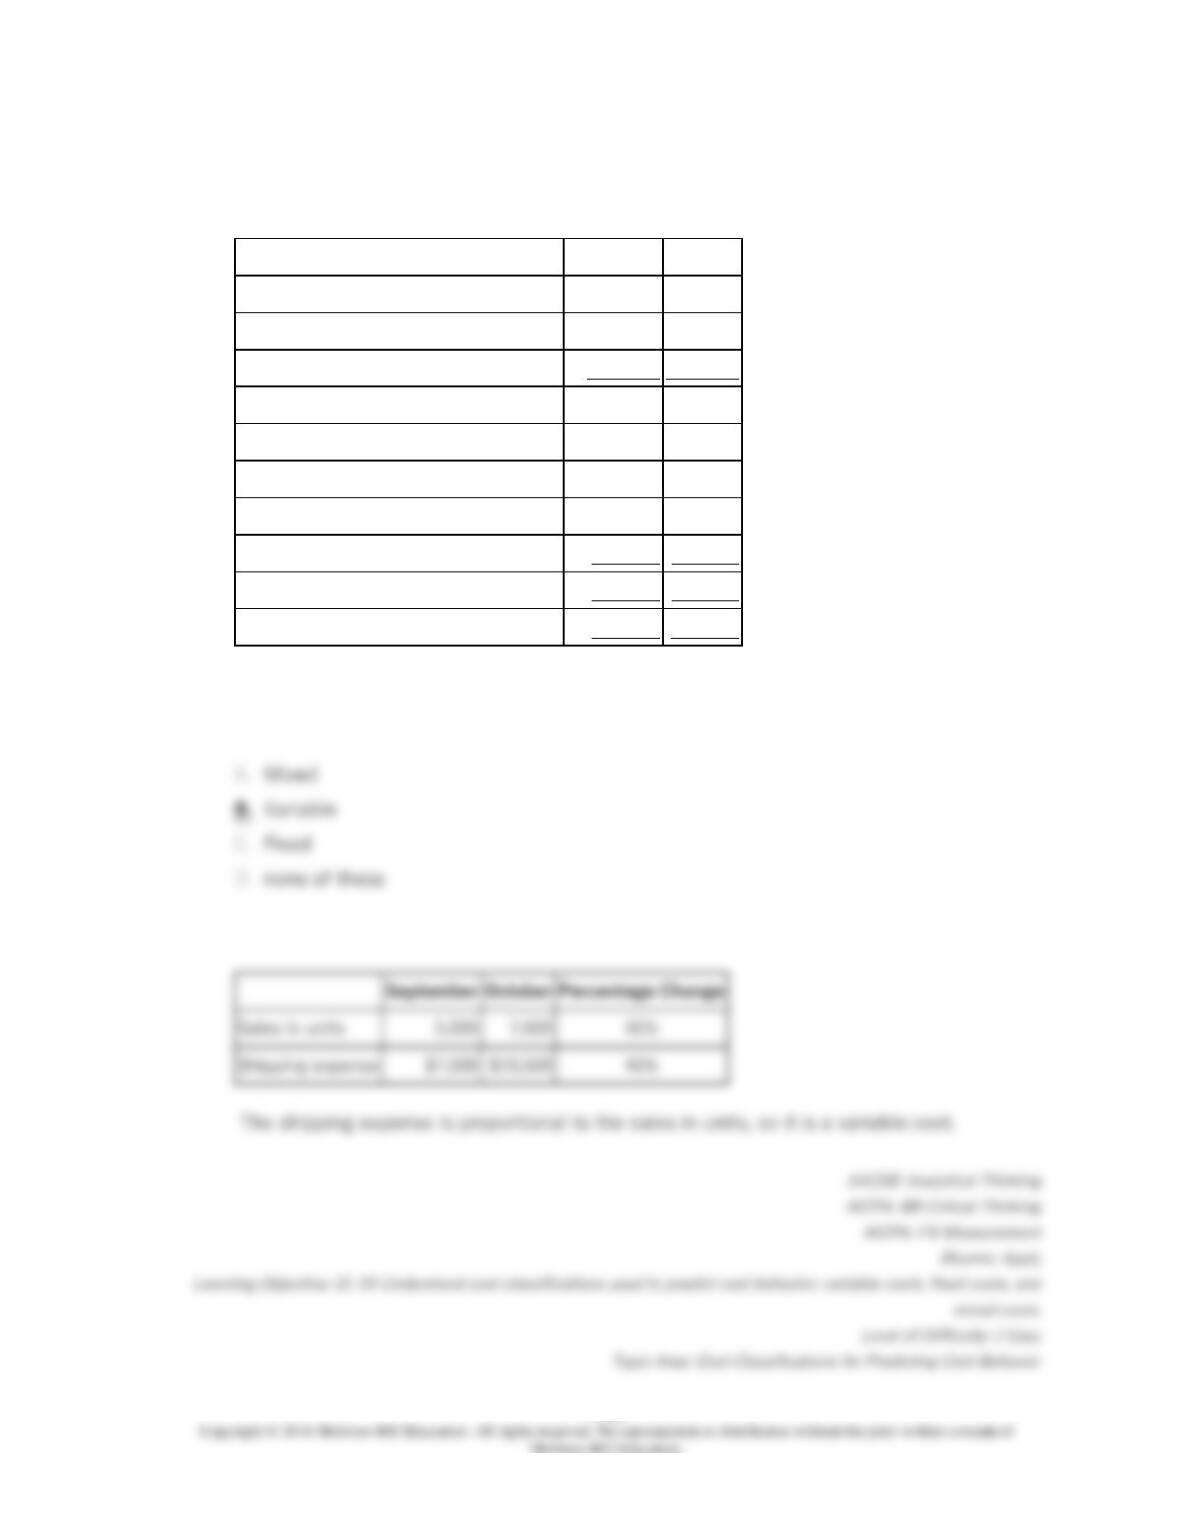
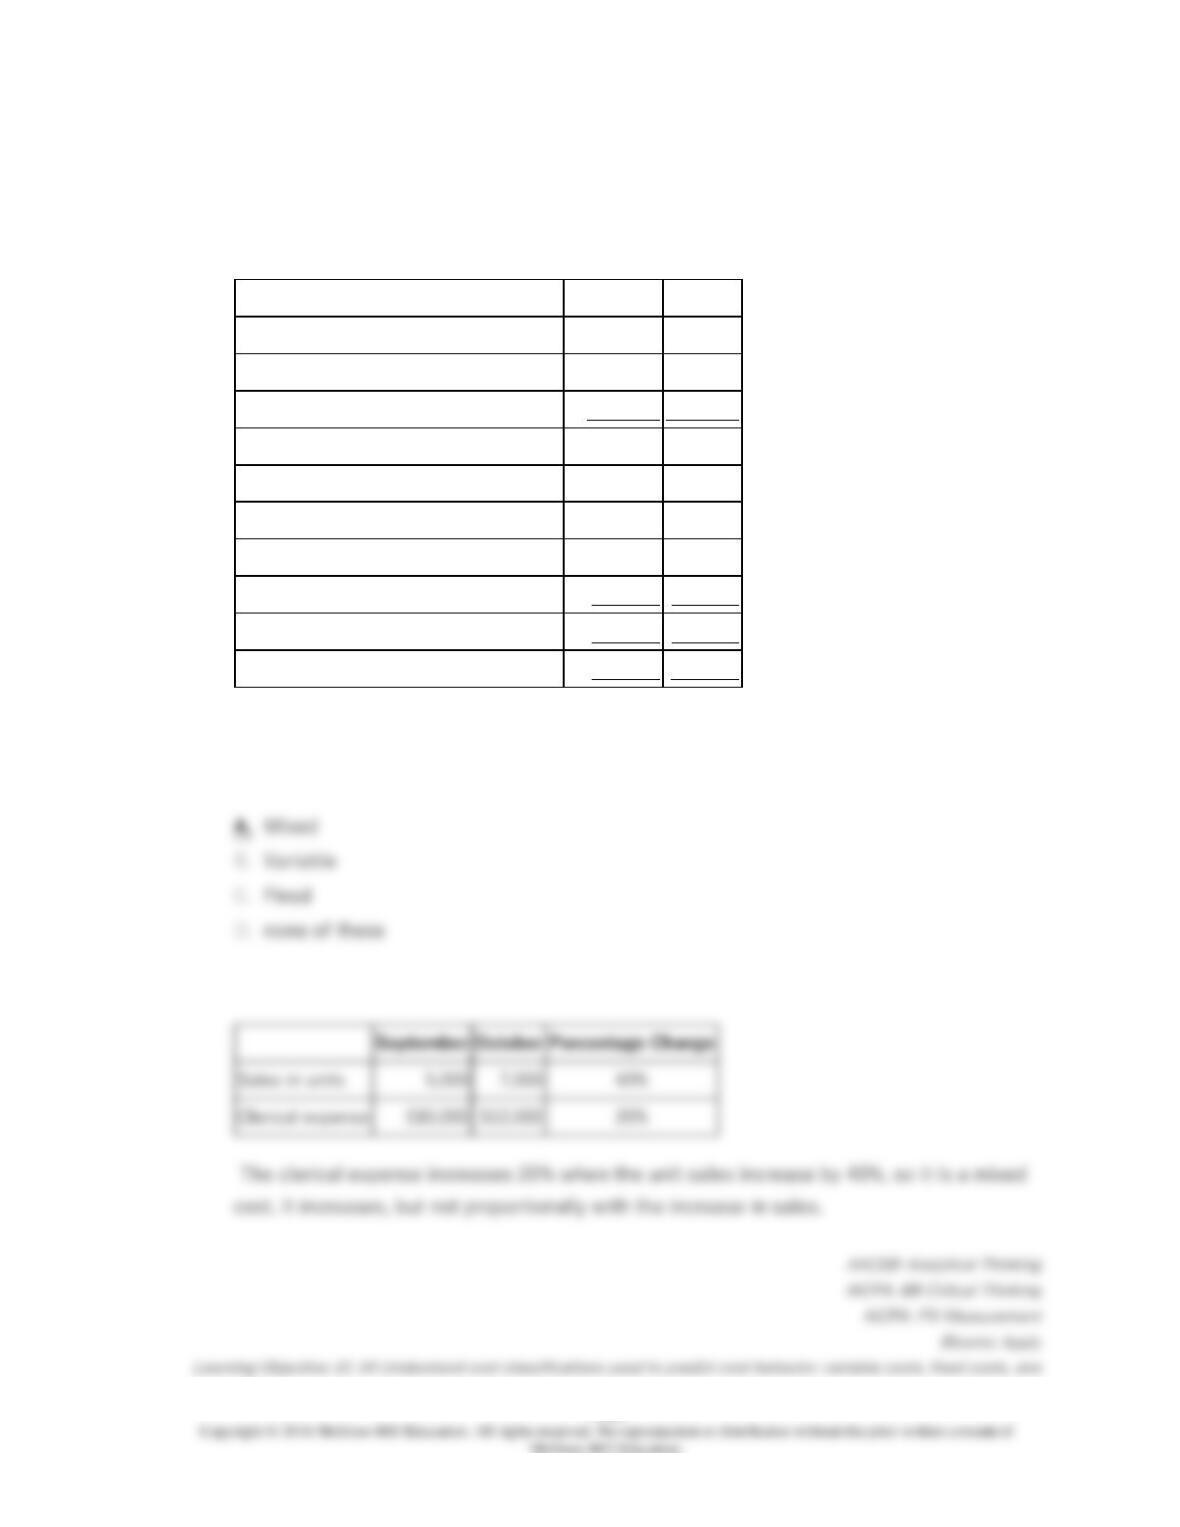
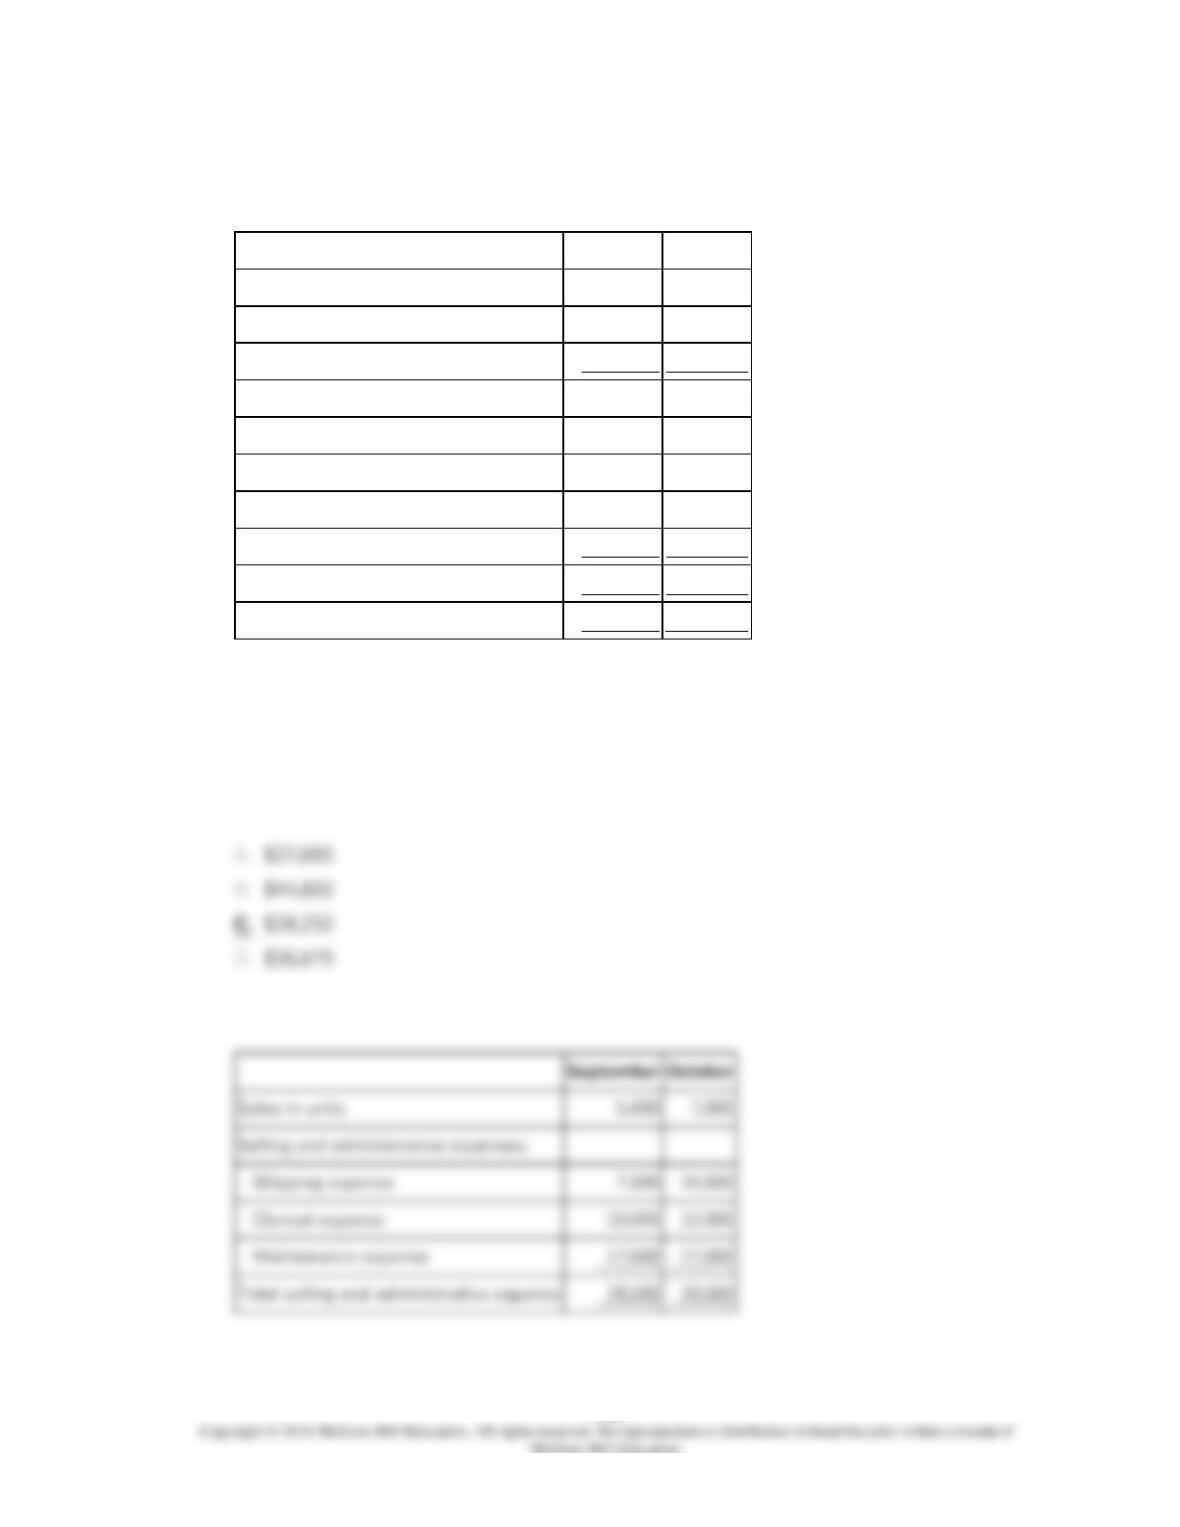
Which of the following classifications best describes the behavior of shipping expense?
Sales in units
5,000
Shipping expense
$7,500
1-204
135.
Comparative income statements for Tudor Retailing Company for the last two months are
presented below:
September
October
Sales in units
5,000
7,000
Sales revenue
$100,000
$140,000
Cost of goods sold
40,000
56,000
Gross margin
60,000
84,000
Selling and administrative expenses:
Shipping expense
7,500
10,500
Clerical expense
10,000
12,000
Maintenance expense
17,000
17,000
Total selling and administrative expense
34,500
39,500
Net operating income
$25,500
$44,500
Which of the following classifications best describes the behavior of clerical expense?
September
October
Sales in units
5,000
Clerical expense
$10,000
1-205
1-206
136.
Comparative income statements for Tudor Retailing Company for the last two months are
presented below:
September
October
Sales in units
5,000
7,000
Sales revenue
$100,000
$140,000
Cost of goods sold
40,000
56,000
Gross margin
60,000
84,000
Selling and administrative expenses:
Shipping expense
7,500
10,500
Clerical expense
10,000
12,000
Maintenance expense
17,000
17,000
Total selling and administrative expense
34,500
39,500
Net operating income
$25,500
$44,500
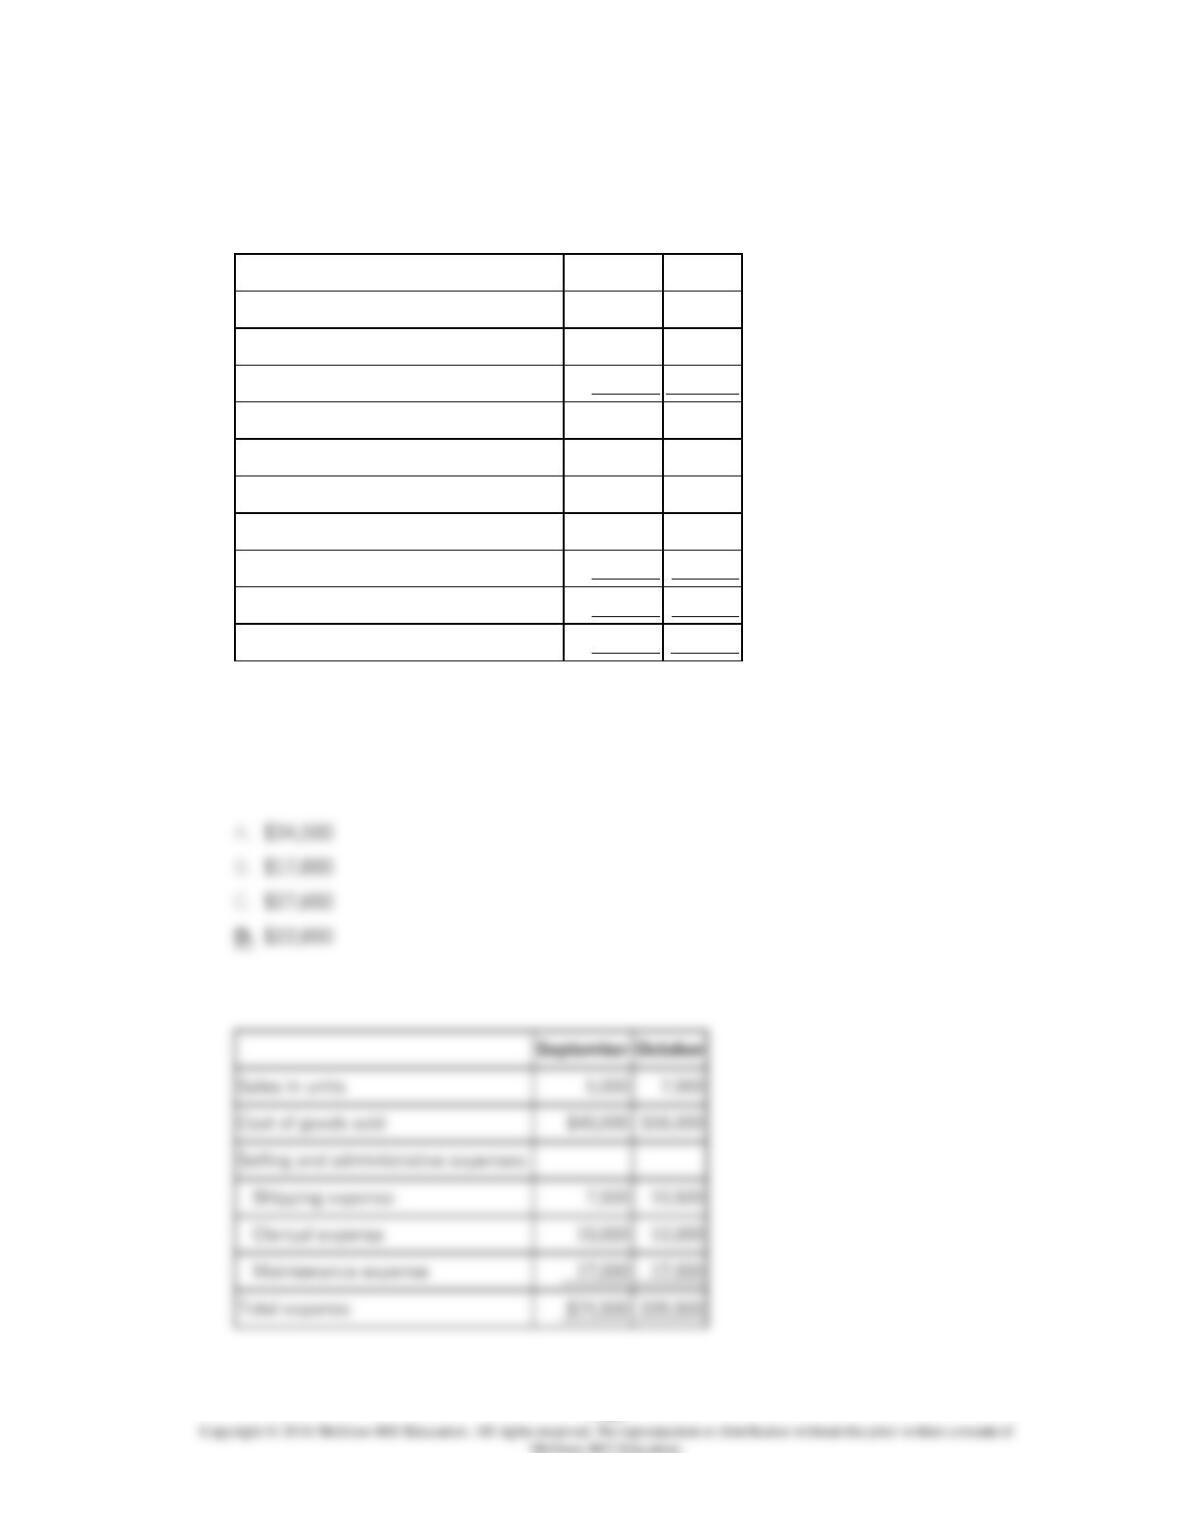
September
October
Sales in units
5,000
Cost of goods sold
$40,000
Selling and administrative expenses:
Shipping expense
7,500
Clerical expense
10,000
Maintenance expense
17,000
17,000
Total expense
$74,500
$95,500
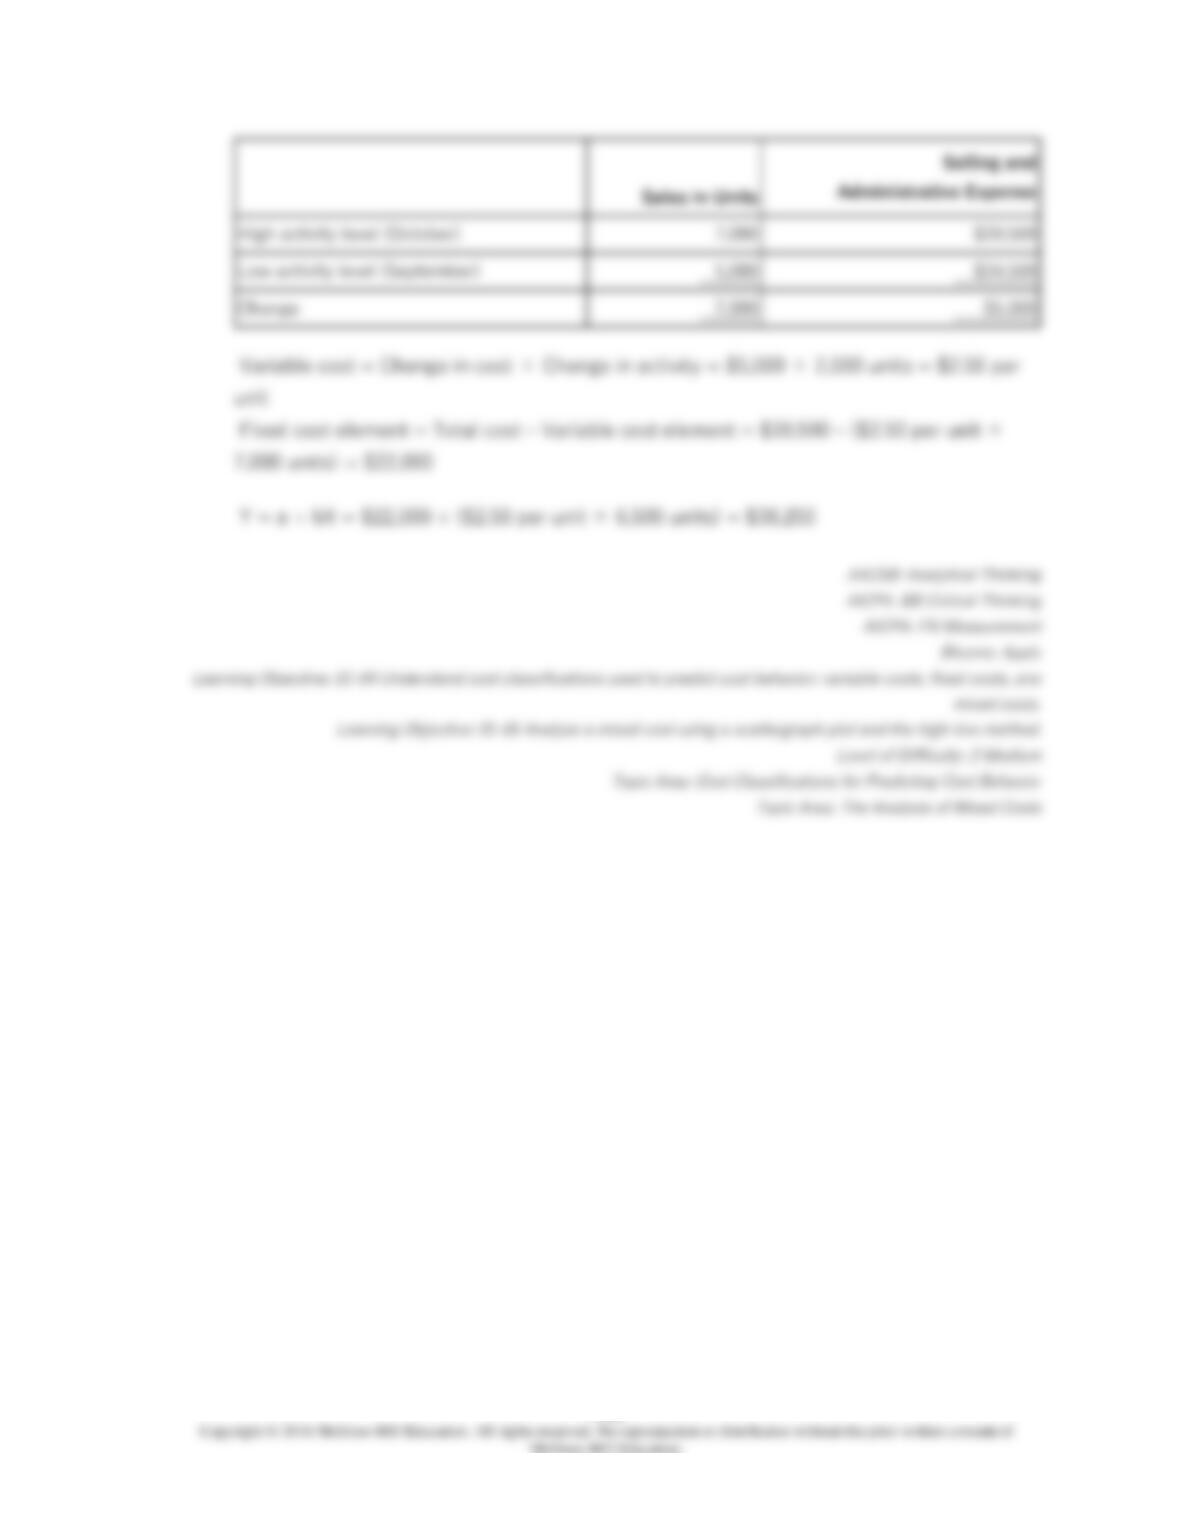
If the Tudor Retailing Company uses the high-low method of analysis, the total monthly
fixed cost for Tudor Retailing Company would be estimated to be:
1-207
1-208
137.
Comparative income statements for Tudor Retailing Company for the last two months are
presented below:
September
October
Sales in units
5,000
7,000
Sales revenue
$100,000
$140,000
Cost of goods sold
40,000
56,000
Gross margin
60,000
84,000
Selling and administrative expenses:
Shipping expense
7,500
10,500
Clerical expense
10,000
12,000
Maintenance expense
17,000
17,000
Total selling and administrative expense
34,500
39,500
Net operating income
$25,500
$44,500
September
October
Sales in units
5,000
Selling and administrative expenses:
Shipping expense
7,500
Clerical expense
10,000
Maintenance expense
Total selling and administrative expense
If the Tudor Retailing Company uses the high-low method of analysis, the total selling and
administrative expense if Tudor Retailing Company sells 6,500 units during a month would
be estimated to be:
1-209
138.
Comco, Inc. has accumulated the following data for the cost of maintenance on its
machinery for the last four months:
Machine Hours
Maintenance Cost
September
21,000
$26,020
October
18,500
$24,600
November
15,000
$22,300
December
19,000
$25,100
Assume that the relevant range includes all of the activity levels mentioned in this
problem.
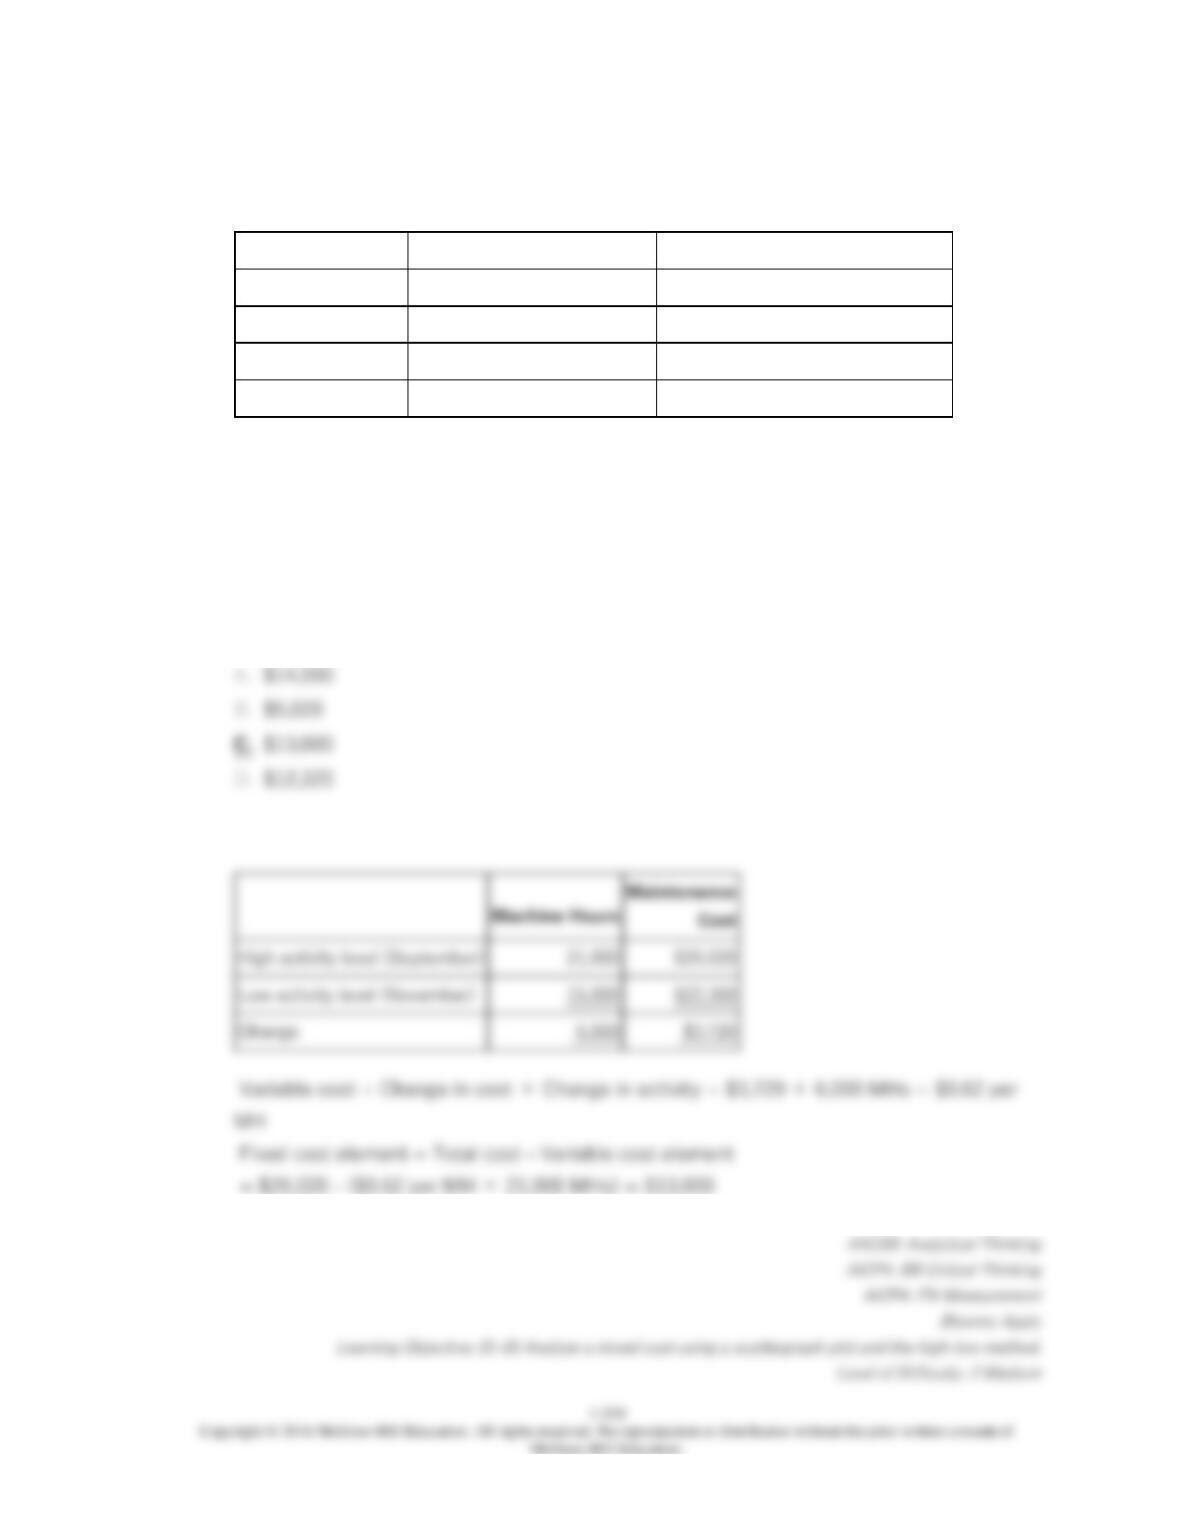
Assuming Comco uses the high-low method of analysis, the fixed cost of maintenance
would be estimated to be:
Change
139.
Comco, Inc. has accumulated the following data for the cost of maintenance on its
machinery for the last four months:
Machine Hours
Maintenance Cost
September
21,000
$26,020
October
18,500
$24,600
November
15,000
$22,300
December
19,000
$25,100
Assume that the relevant range includes all of the activity levels mentioned in this
problem.
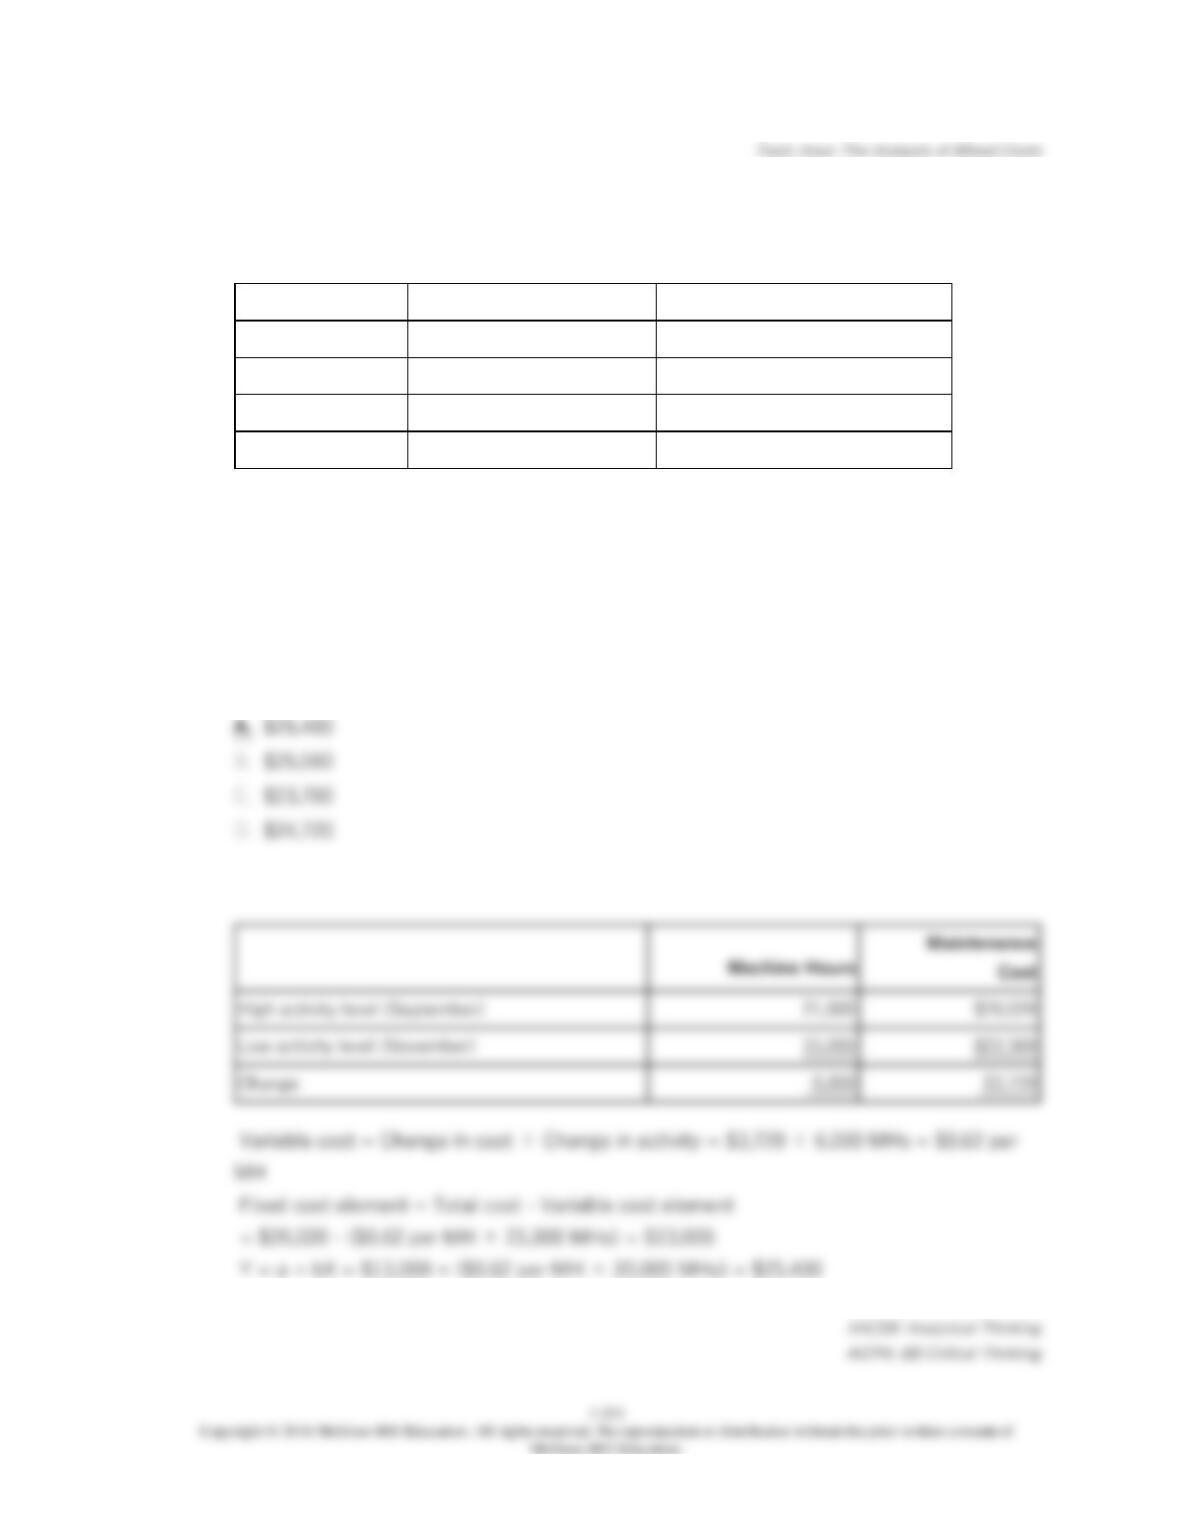
Assuming Comco uses the high-low method of analysis, if machine hours are budgeted to
be 20,000 hours then the budgeted total maintenance cost would be expected to be:
Change
1-212
1-213
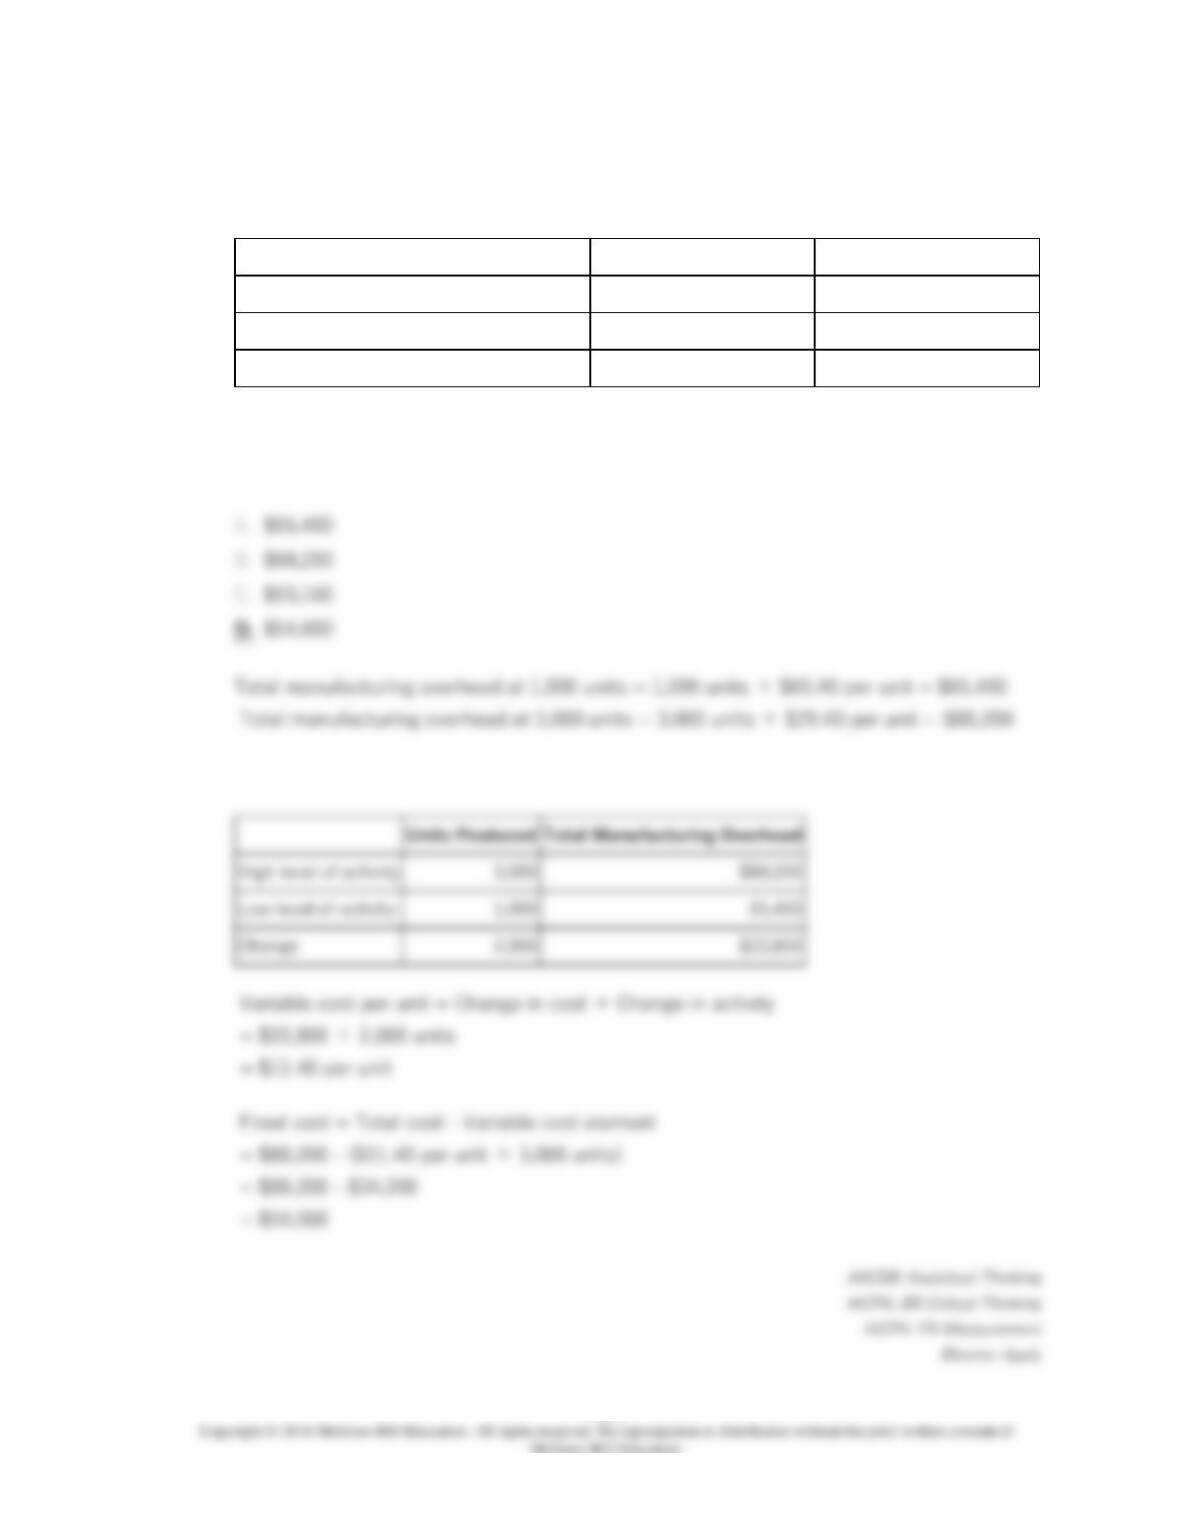
140.
The following production and average cost data for two levels of monthly production
volume have been supplied by a company that produces a single product:
Production volume
1,000 units
3,000 units
Direct materials
$13.20 per unit
$13.20 per unit
Direct labor
$14.50 per unit
$14.50 per unit
Manufacturing overhead
$65.40 per unit
$29.40 per unit
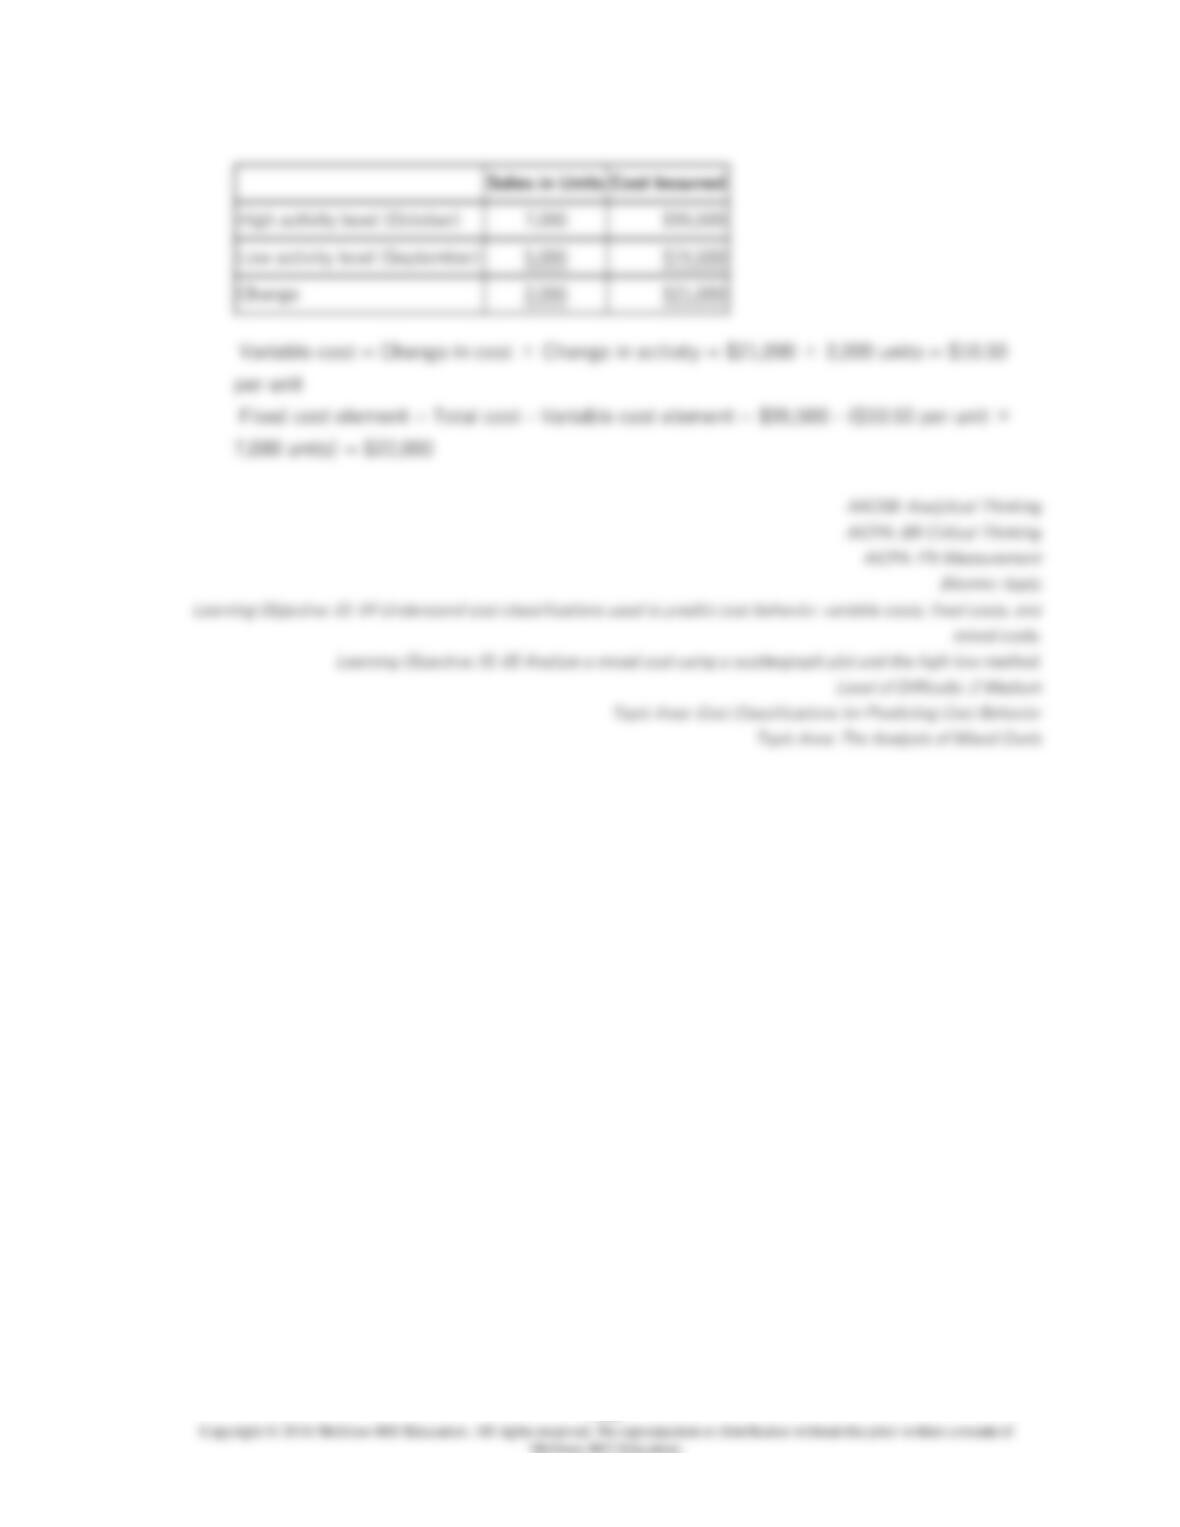
High level of activity
Low level of activity
The best estimate of the total monthly fixed manufacturing cost is:
1-214
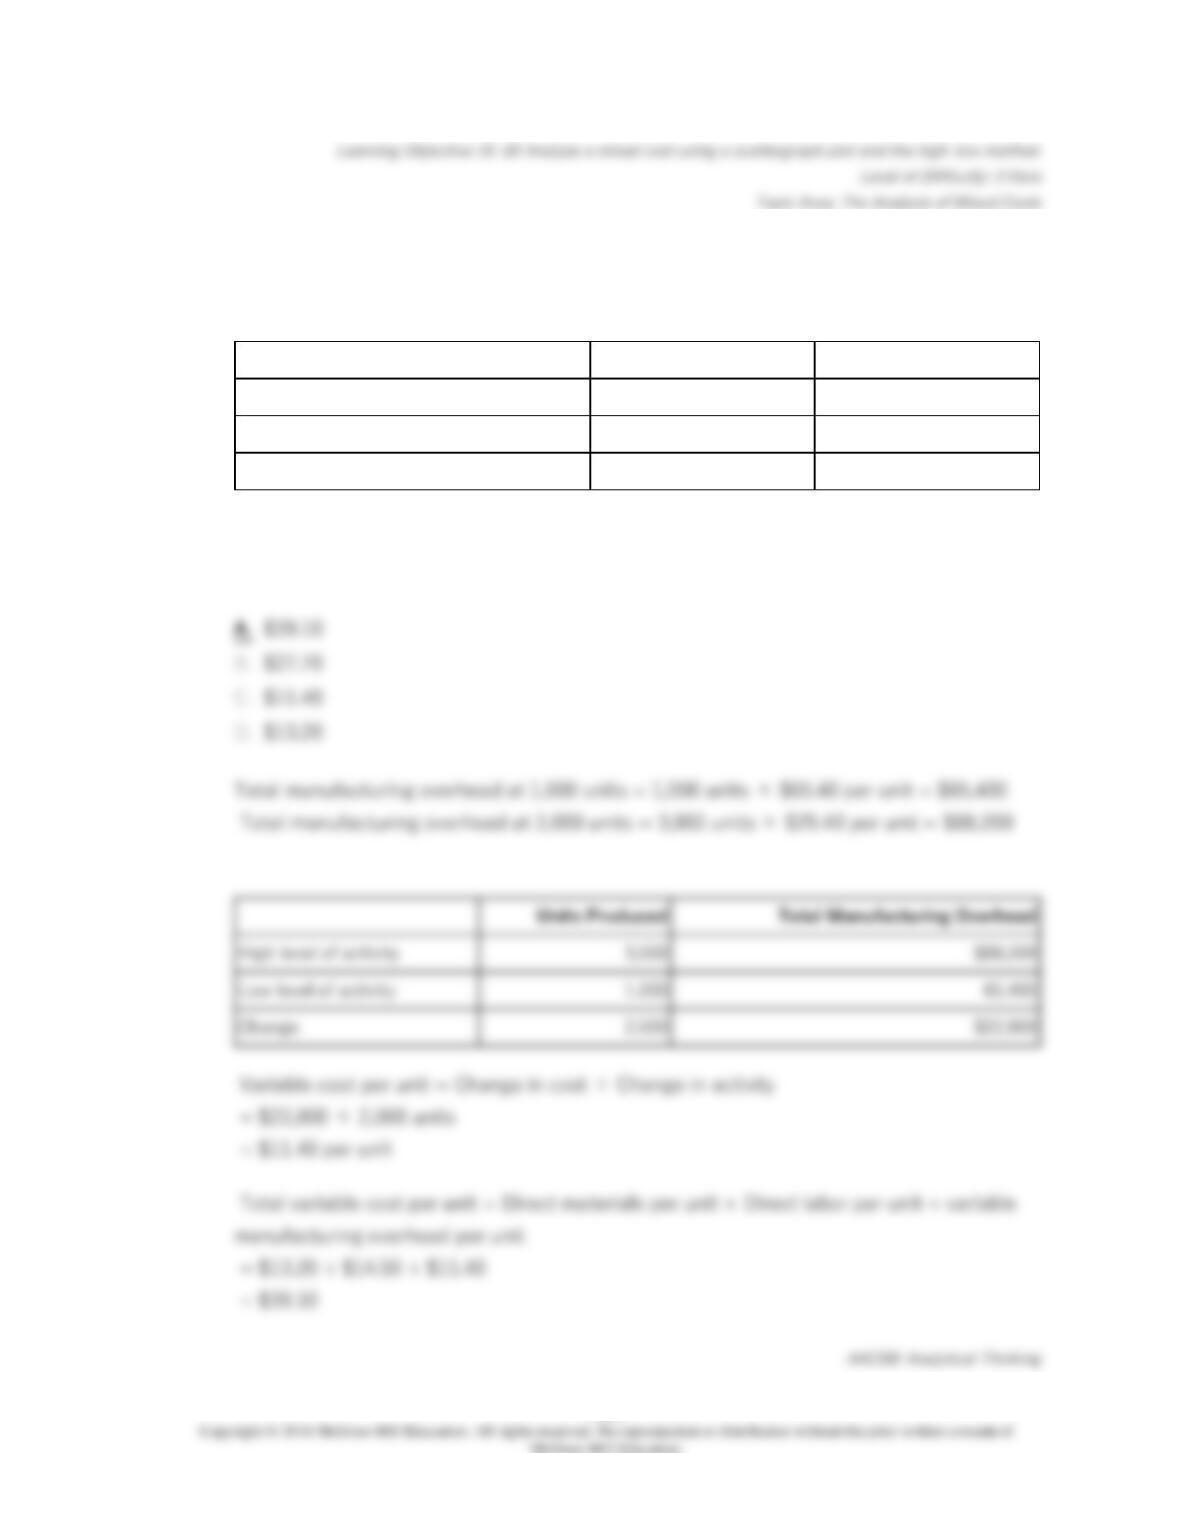
141.
The following production and average cost data for two levels of monthly production
volume have been supplied by a company that produces a single product:
Production volume
1,000 units
3,000 units
Direct materials
$13.20 per unit
$13.20 per unit
Direct labor
$14.50 per unit
$14.50 per unit
Manufacturing overhead
$65.40 per unit
$29.40 per unit
High level of activity
Low level of activity
The best estimate of the total variable manufacturing cost per unit is:
1-215
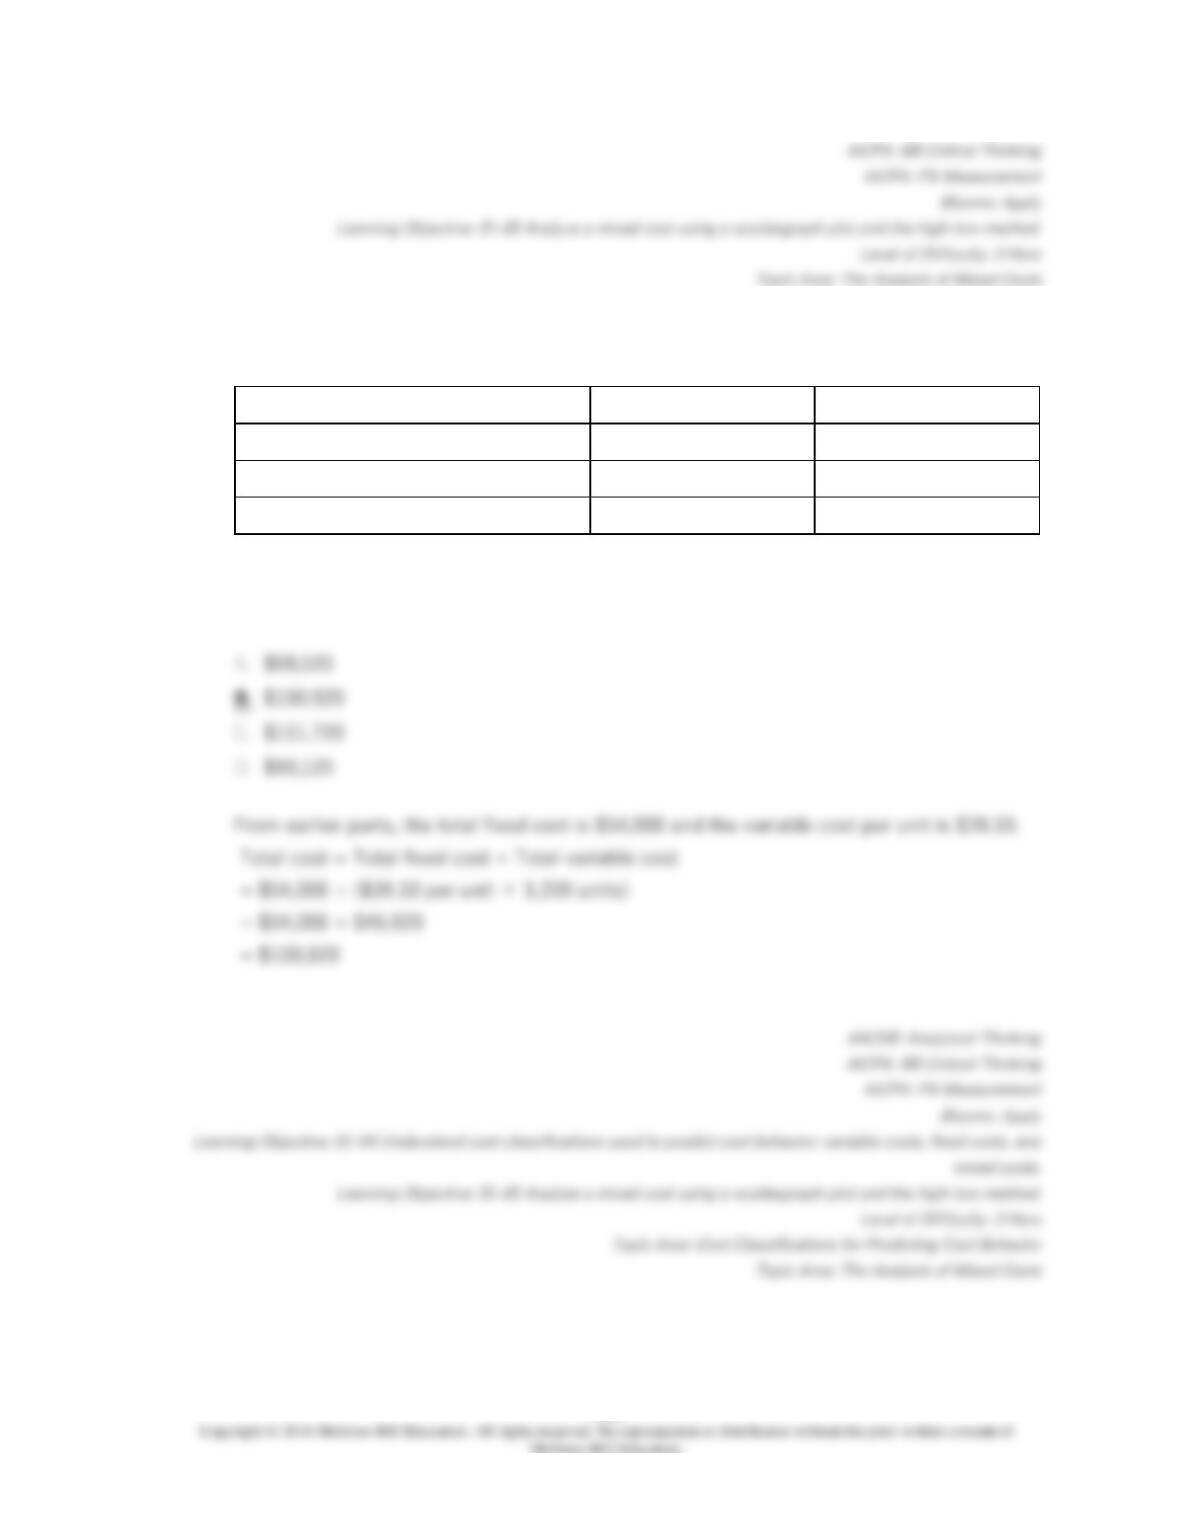
142.
The following production and average cost data for two levels of monthly production
volume have been supplied by a company that produces a single product:
Production volume
1,000 units
3,000 units
Direct materials
$13.20 per unit
$13.20 per unit
Direct labor
$14.50 per unit
$14.50 per unit
Manufacturing overhead
$65.40 per unit
$29.40 per unit
The best estimate of the total cost to manufacture 1,200 units is closest to:
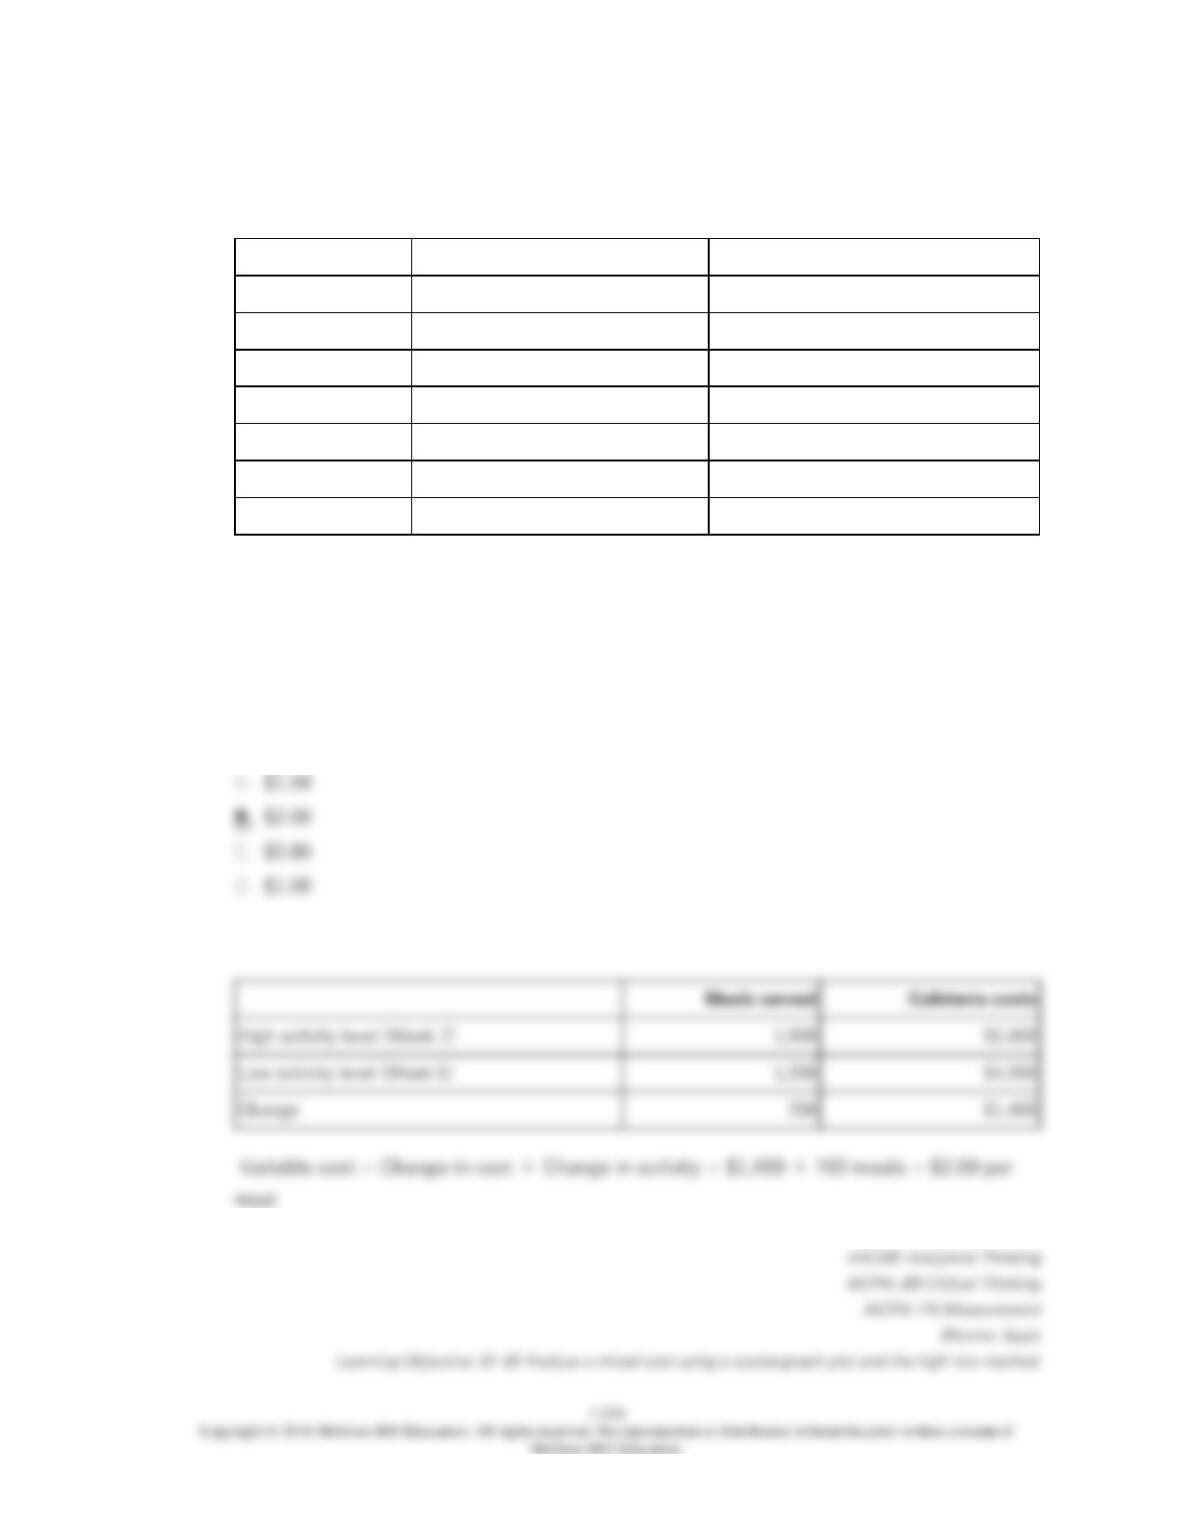
143.
Frank Company operates a cafeteria for its employees. The number of meals served each
week over the last seven weeks, along with the total costs of operating the cafeteria are
given below:
Meals served
Cafeteria costs
Week 1
1,500
$4,800
Week 2
1,600
$5,080
Week 3
1,800
$5,280
Week 4
1,450
$4,900
Week 5
1,200
$4,000
Week 6
1,650
$5,100
Week 7
1,900
$5,400
Assume that the relevant range includes all of the activity levels mentioned in this
problem.
Using the high-low method of analysis, the variable cost per meal served in the cafeteria
would be estimated to be:
High activity level (Week 7)
Low activity level (Week 5)
1-217
1-218
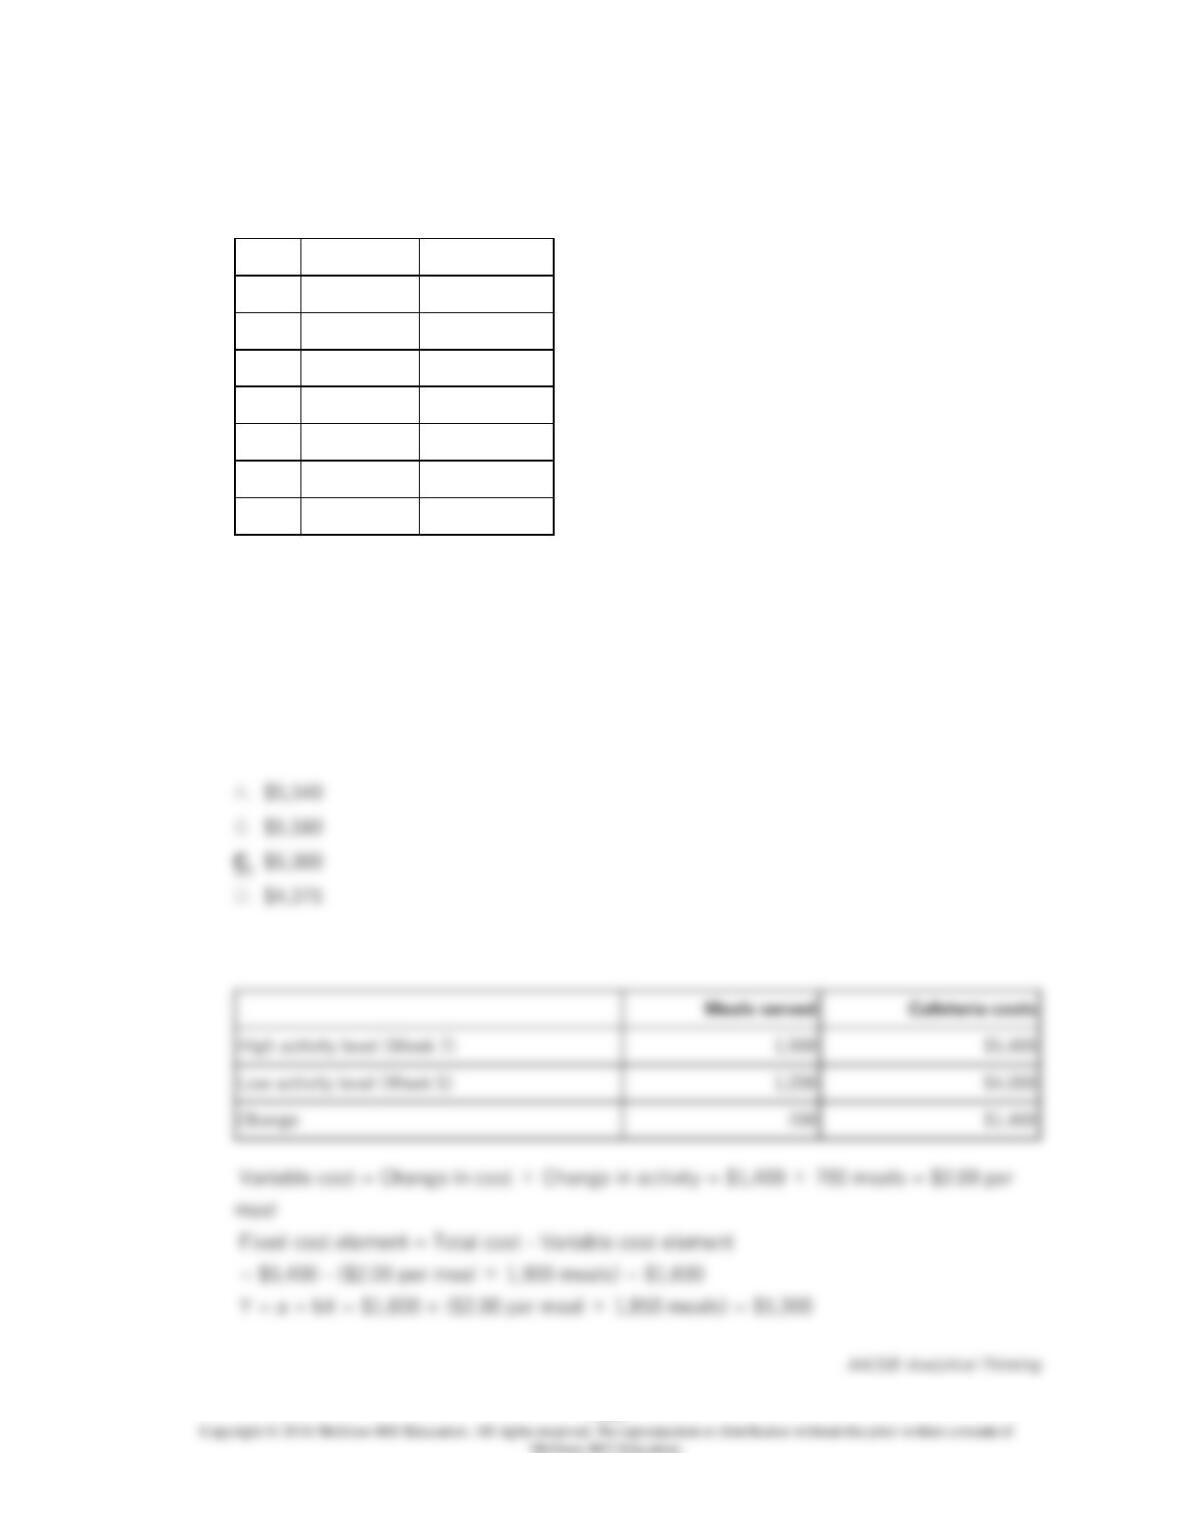
144.
Frank Company operates a cafeteria for its employees. The number of meals served each
week over the last seven weeks, along with the total costs of operating the cafeteria are
given below:
Meals served
Cafeteria costs
Week 1
1,500
$4,800
Week 2
1,600
$5,080
Week 3
1,800
$5,280
Week 4
1,450
$4,900
Week 5
1,200
$4,000
Week 6
1,650
$5,100
Week 7
1,900
$5,400
High activity level (Week 7)
Low activity level (Week 5)
Assume that the relevant range includes all of the activity levels mentioned in this
problem.
Assume that the cafeteria expects to serve 1,850 meals during Week 8. Using the high-
low method, the expected total cost of the cafeteria would be:
1-219