In the past, of all the students enrolled in Basic Business Statistics, 10 percent earned an
A, 20 percent earned a B, 30 percent earned a C, 20 percent earned a D, and the rest
either failed or withdrew from the course. Dr. Johnson is a new professor teaching
Basic Business Statistics for the first time this semester. At the conclusion of the
semester, of his 60 students, 10 had earned an A, 20 a B, 20 a C, 5 a D, and 5 either a W
or an F. Assume that the class constitutes a random sample. Dr. Johnson wants to know
if there is sufficient evidence to conclude that the grade distribution of his class is
different from the historical grade distribution. If we assume at α = .05 that the null
hypothesis is rejected, make a one-sentence managerial conclusion.
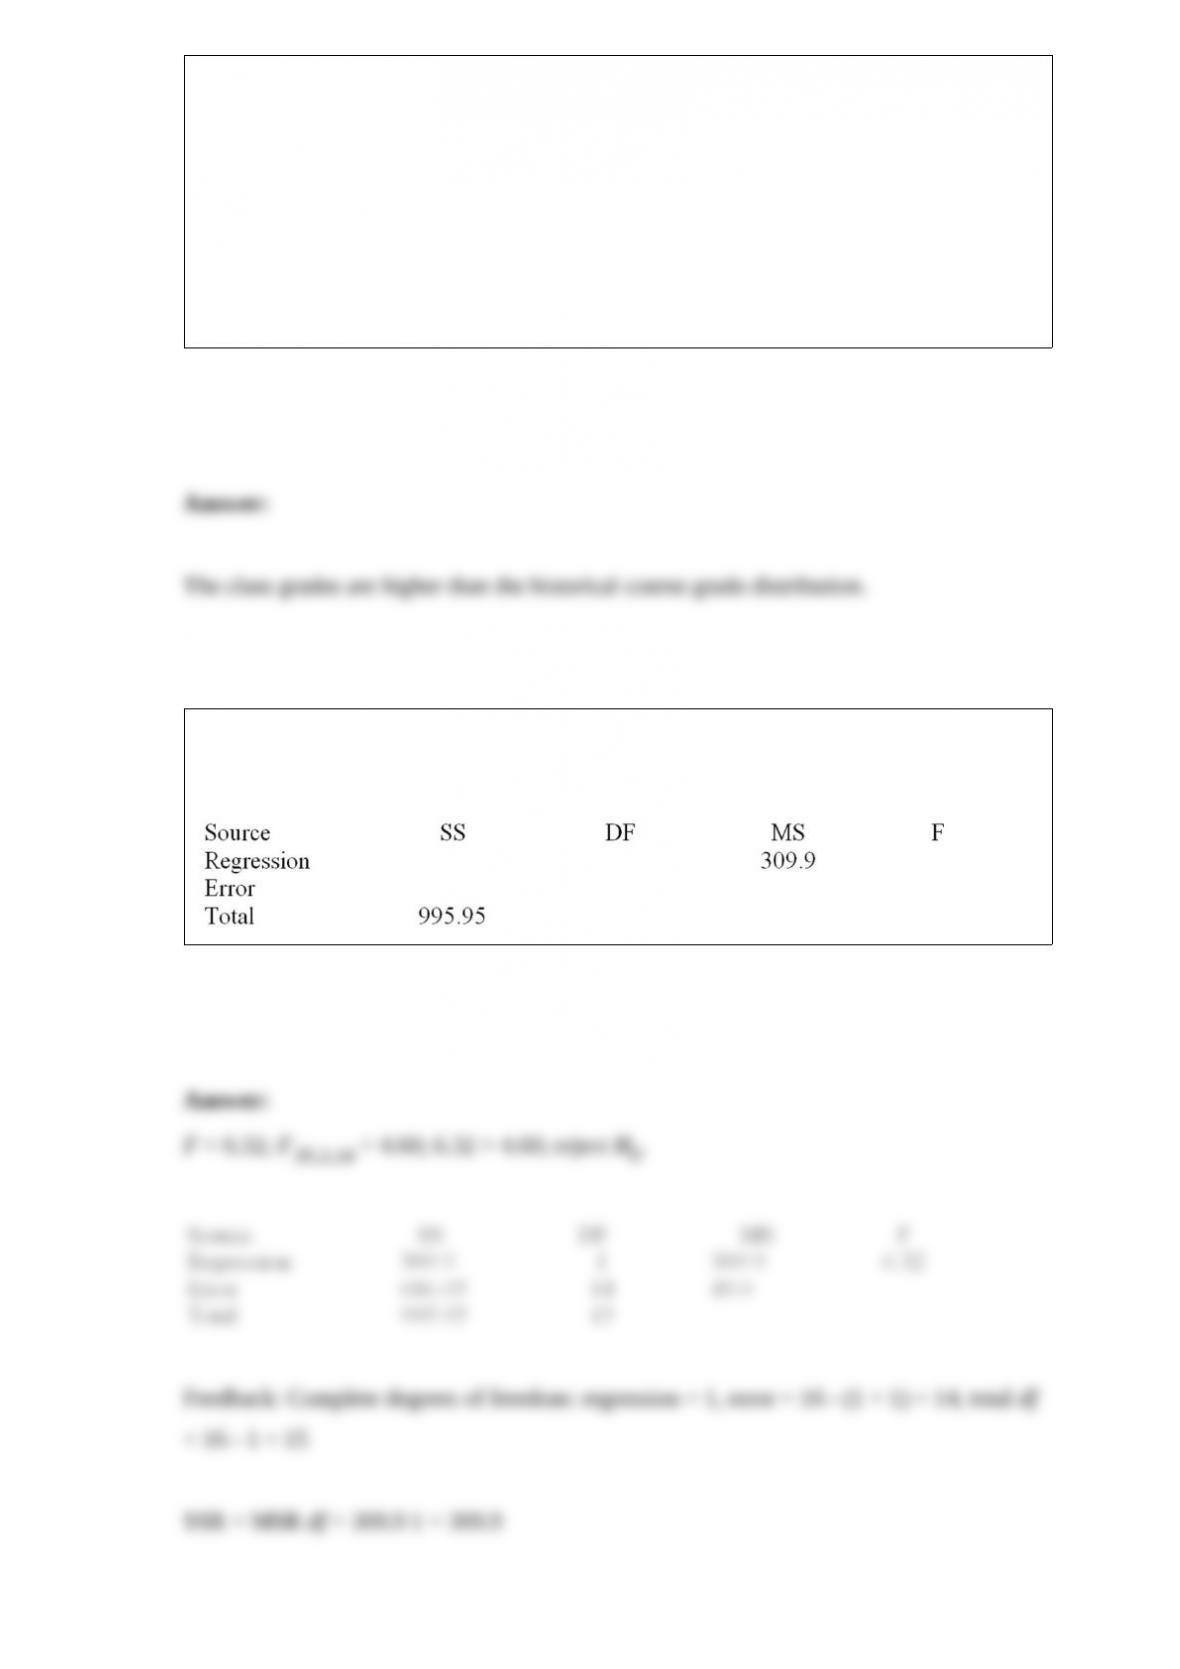
Complete the following partial ANOVA table from a simple linear regression analysis
with a sample size of 16 observations. Find the F statistic to test the significance of the
model.
A researcher has used a one-way analysis of variance model to test whether the average
starting salaries differ among recent graduates from the nursing, engineering, business,
and education disciplines. She has randomly selected four graduates from each of the
four areas.
Determine the degrees of freedom treatment, degrees of freedom error, and degrees of
freedom total, and state the critical value of the F statistic at α = .05.
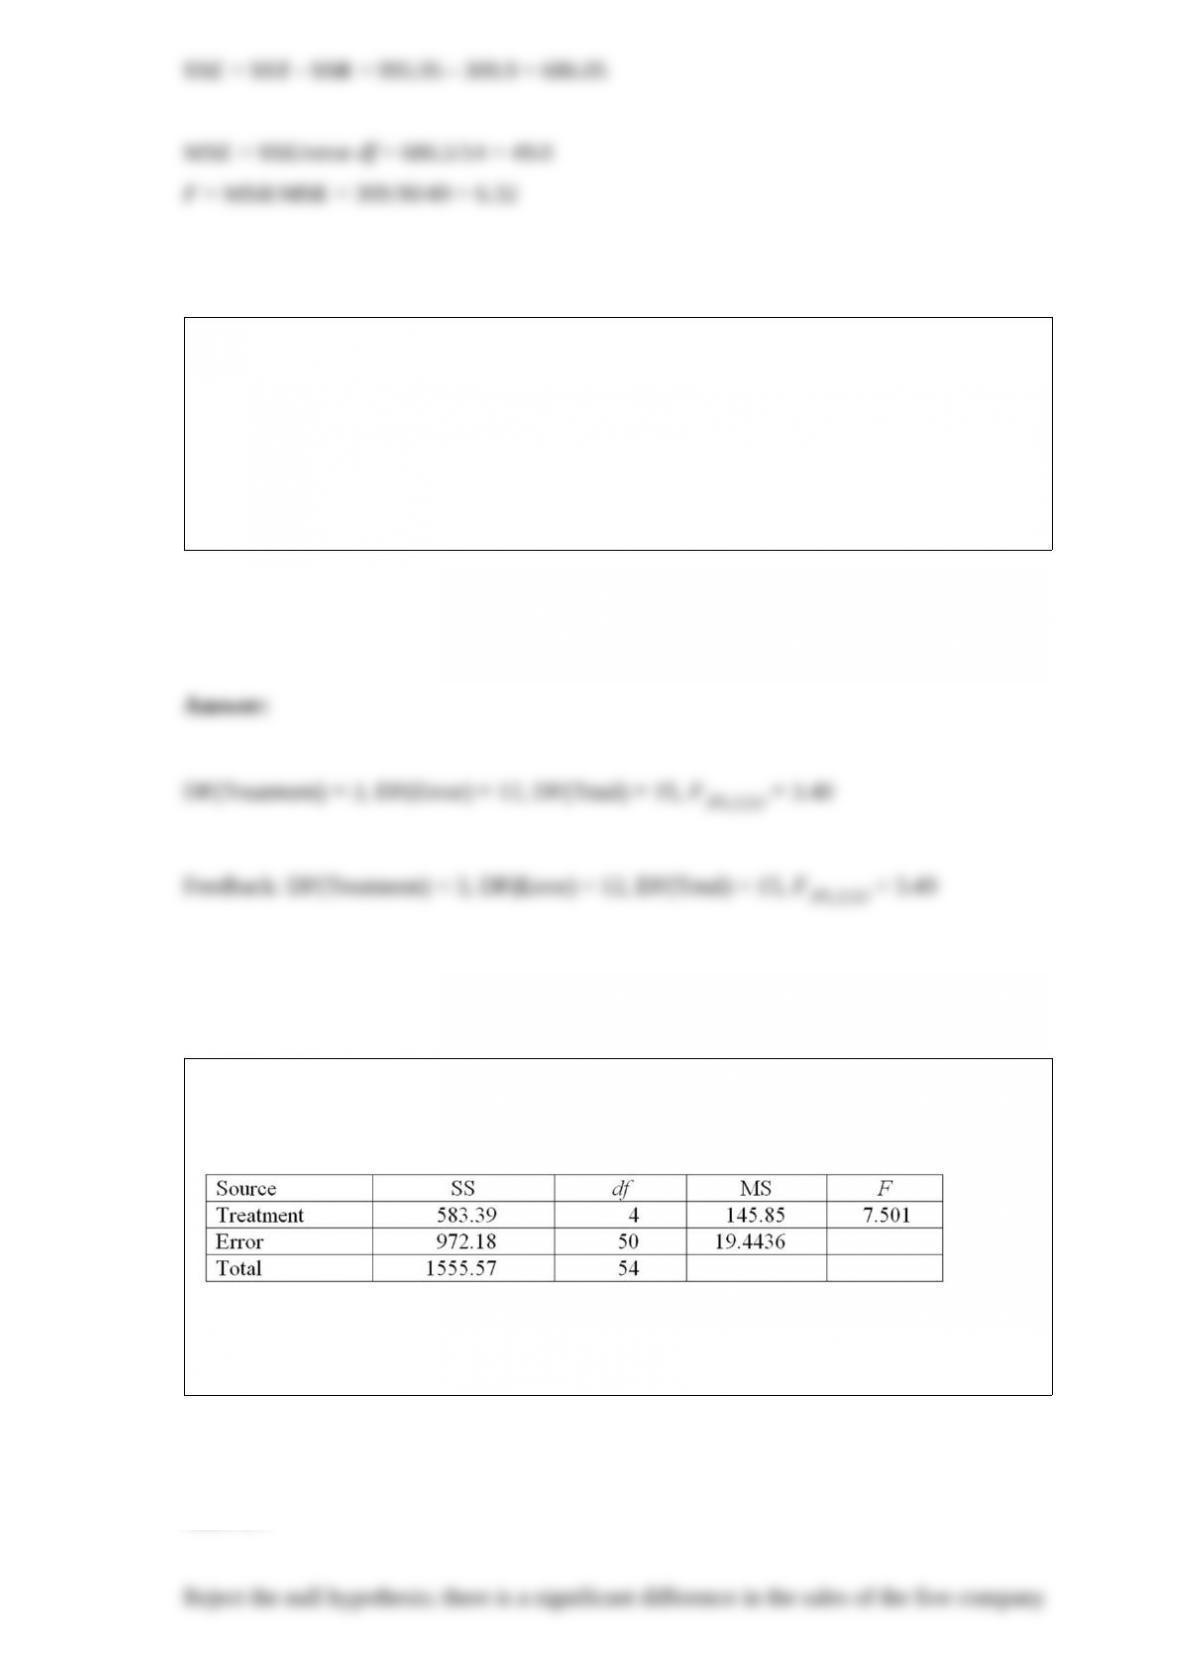
Suppose you are a researcher investigating the annual sales differences among five
categories of businesses. The study looks at a total of 55 companies equally divided
among categories groups A, B, C, D, and E.
Is there a significant difference in the annual sales of the five company categories at α =
.05? Do you reject H0?
Consider the following partial computer output from a simple linear regression analysis.
Analysis of Variance
What is the explained variance?
In the past, of all the students enrolled in Basic Business Statistics, 10 percent earned an
A, 20 percent earned a B, 30 percent earned a C, 20 percent earned a D, and the rest
either failed or withdrew from the course. Dr. Johnson is a new professor teaching
Basic Business Statistics for the first time this semester. At the conclusion of the
semester, of his 60 students, 10 had earned an A, 20 a B, 20 a C, 5 a D, and 5 either a W
or an F. Assume that the class constitutes a random sample. Dr. Johnson wants to know
if there is sufficient evidence to conclude that the grade distribution of his class is
different from the historical grade distribution. Calculate the expected values for an A
and for a D.
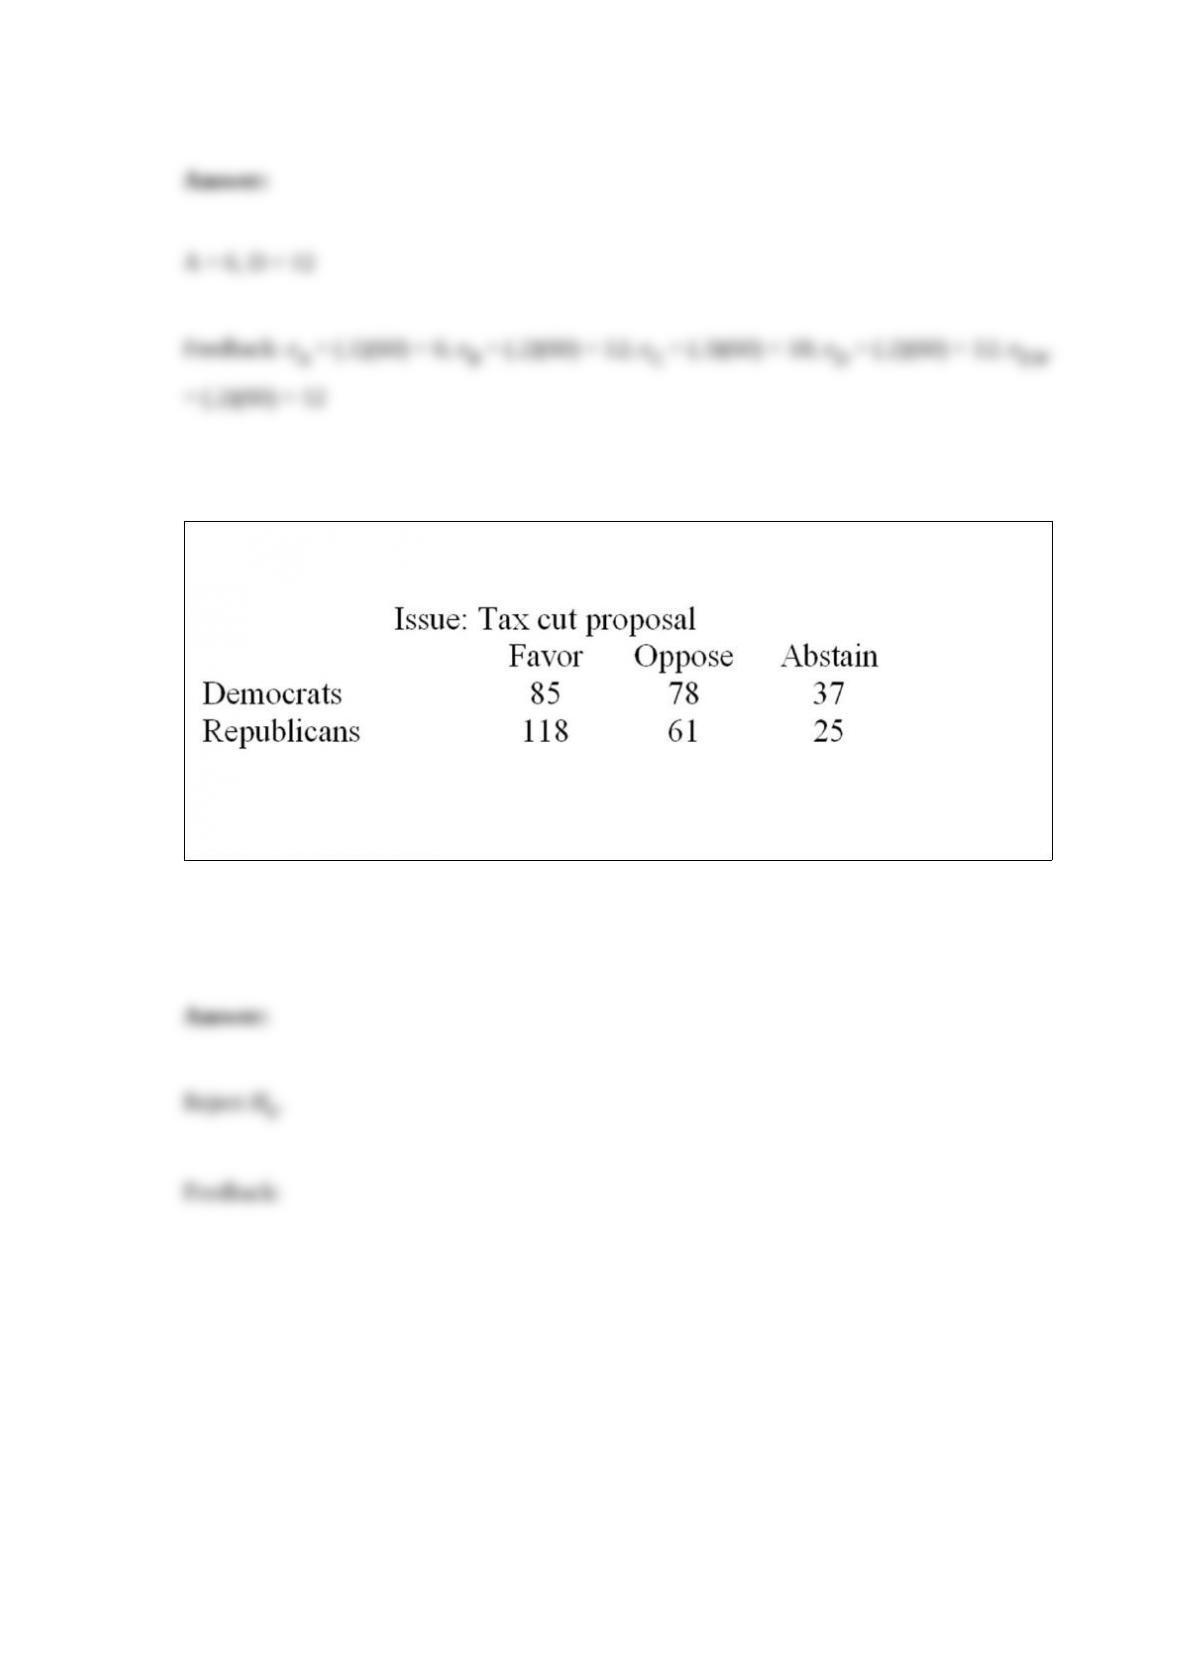
On the most recent tax cut proposal, a random sample of Democrats and Republicans in
the Congress cast their votes as follows:
Use a significance level of .01 and determine whether the opinions on the tax cut
proposal and the party affiliation are independent.
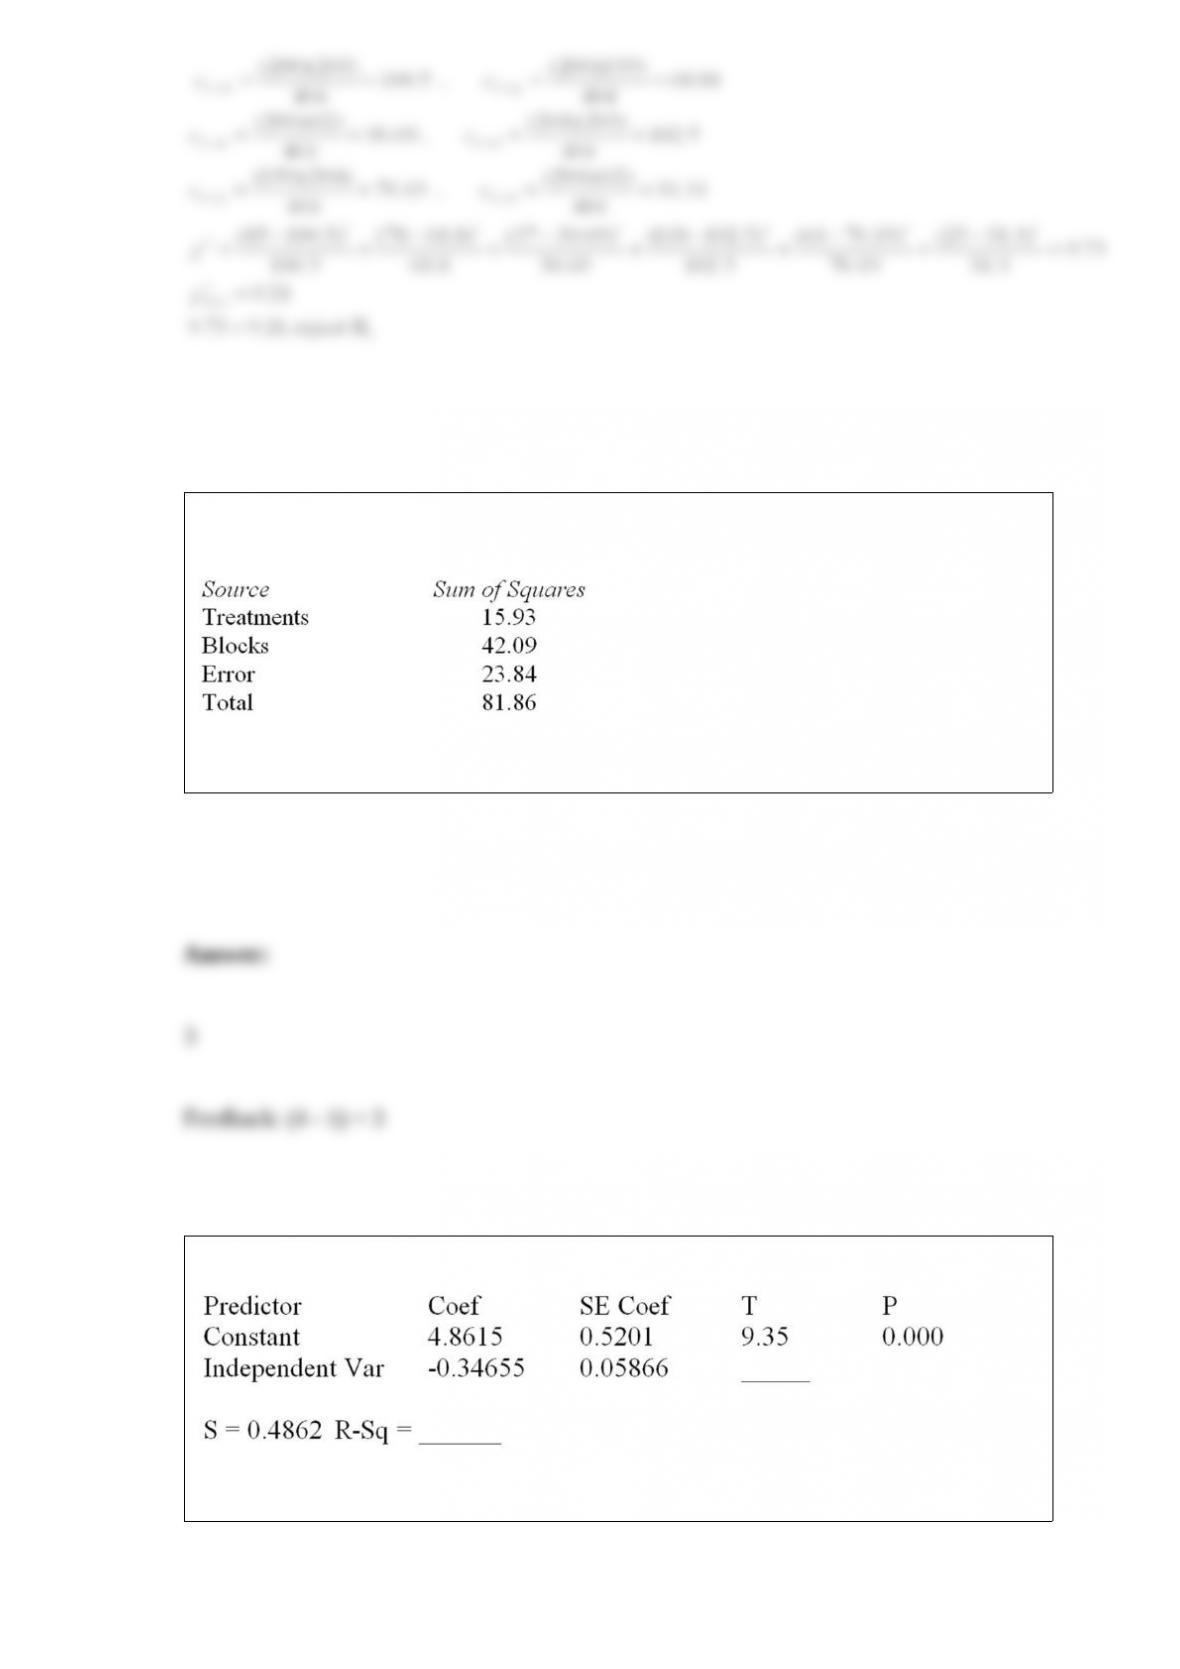
Consider the following partial analysis of variance table from a randomized block
design with 6 blocks and 4 treatments.
Determine the degrees of freedom for treatments.
Consider the following partial computer output from a simple linear regression analysis.
Analysis of Variance
Calculate the SSE.
The multiple coefficient of determination that relates x3 to all the other independent
variables R2(x3) = .8. Calculate the variance inflation factor for x3. Should the analyst
be concerned about multicollinearity? Why or why not?
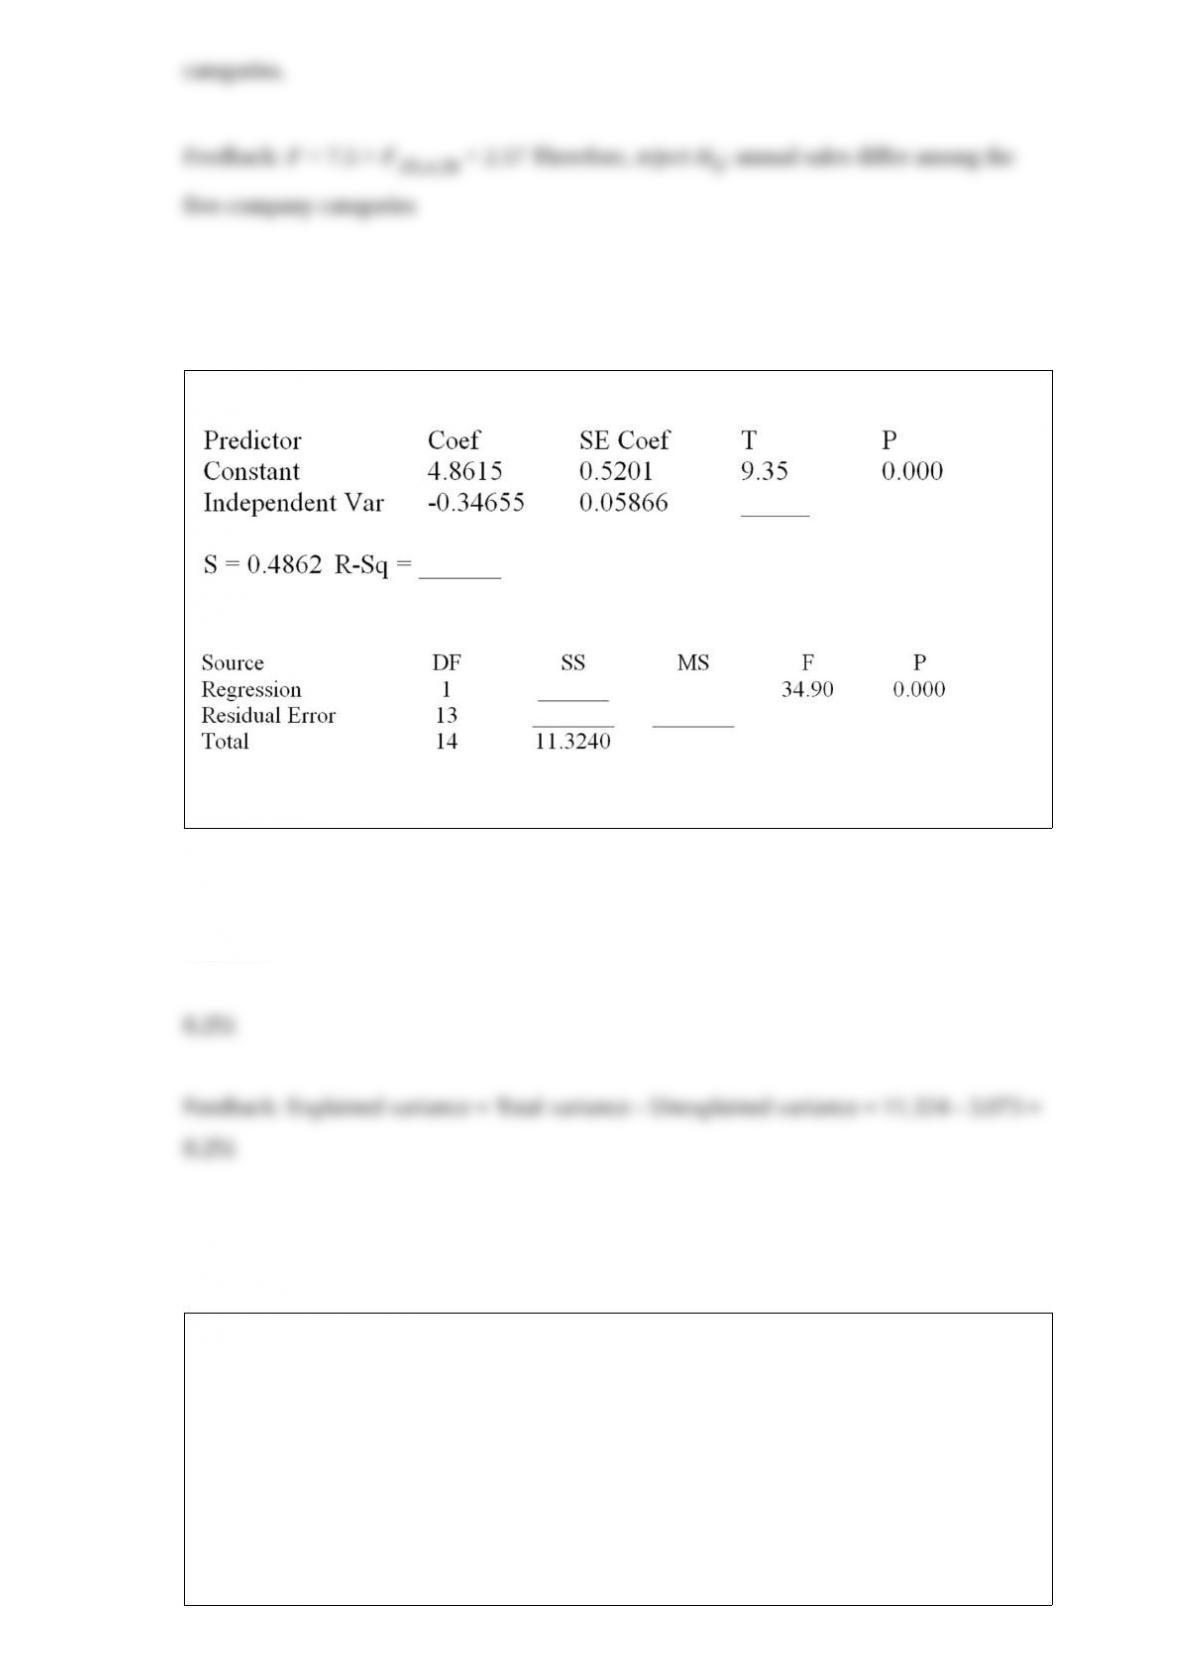
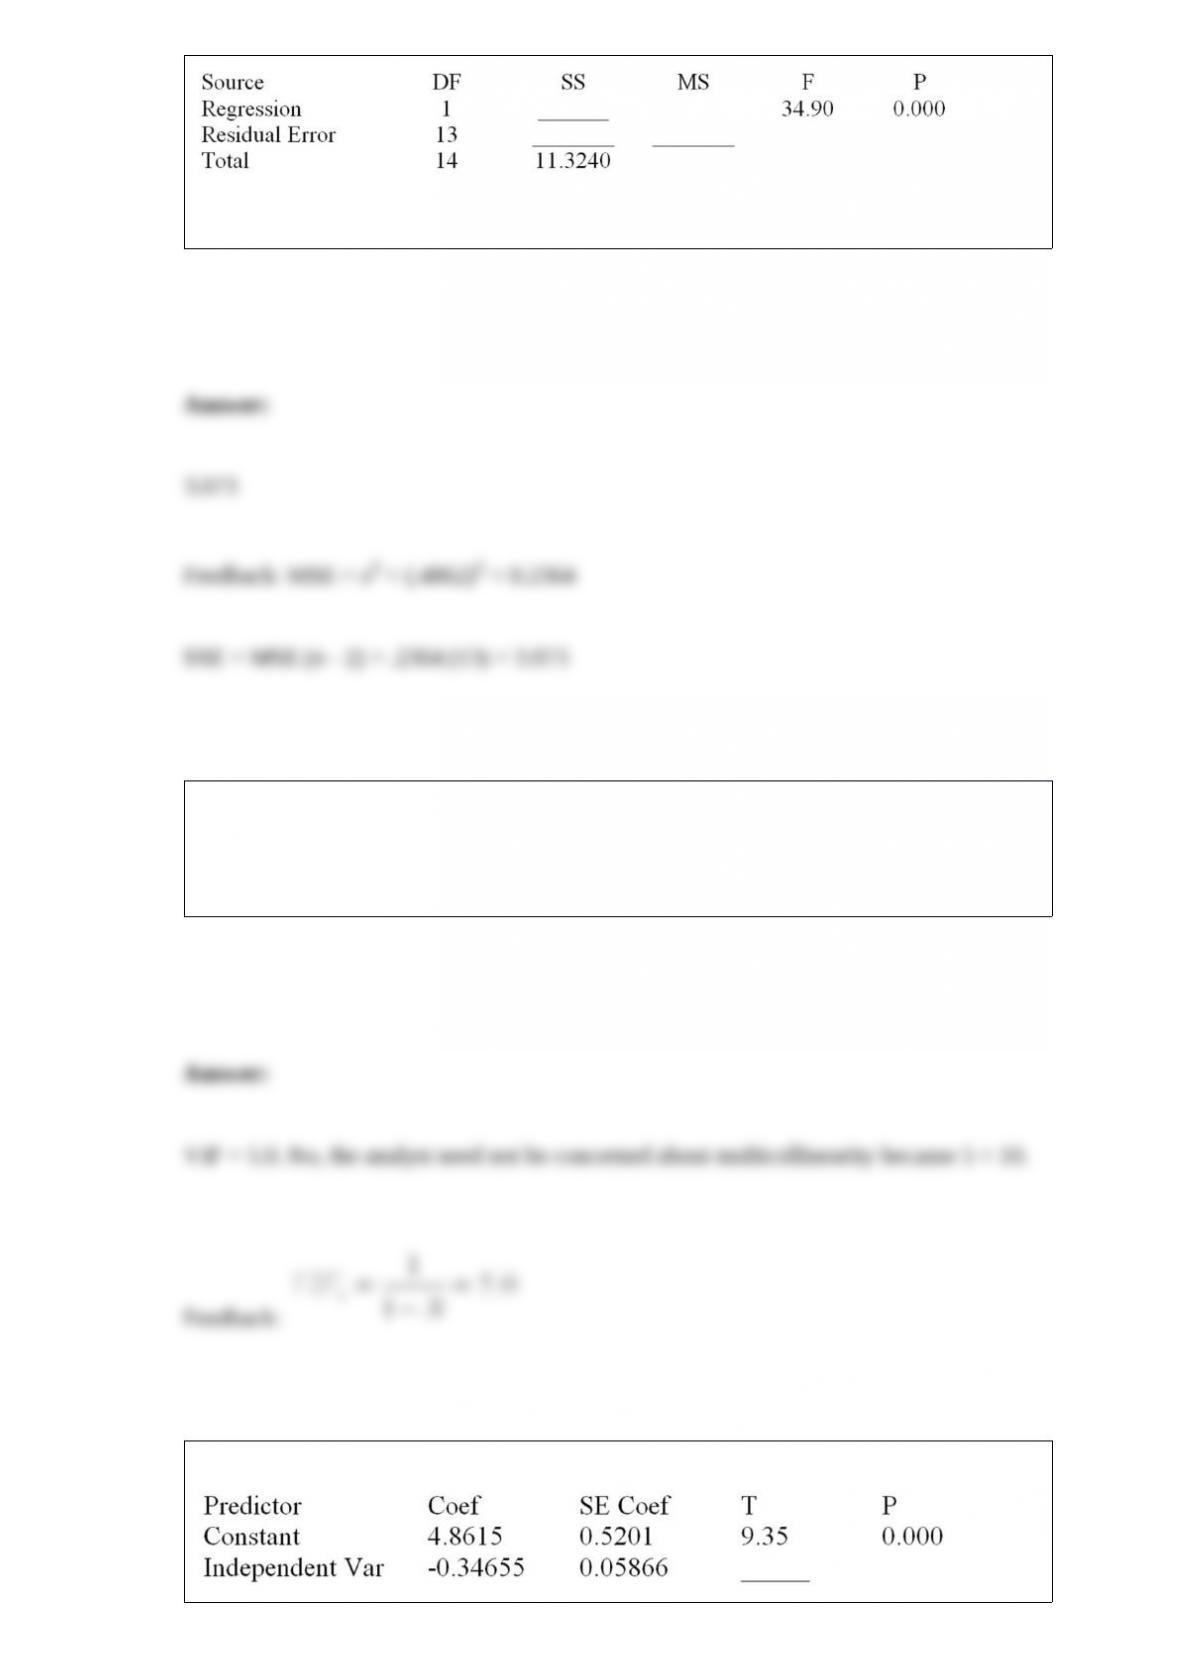
Consider the following partial computer output from a simple linear regression analysis.
S = 0.4862 R-Sq = 0.7286
Analysis of Variance
What is the correlation coefficient?
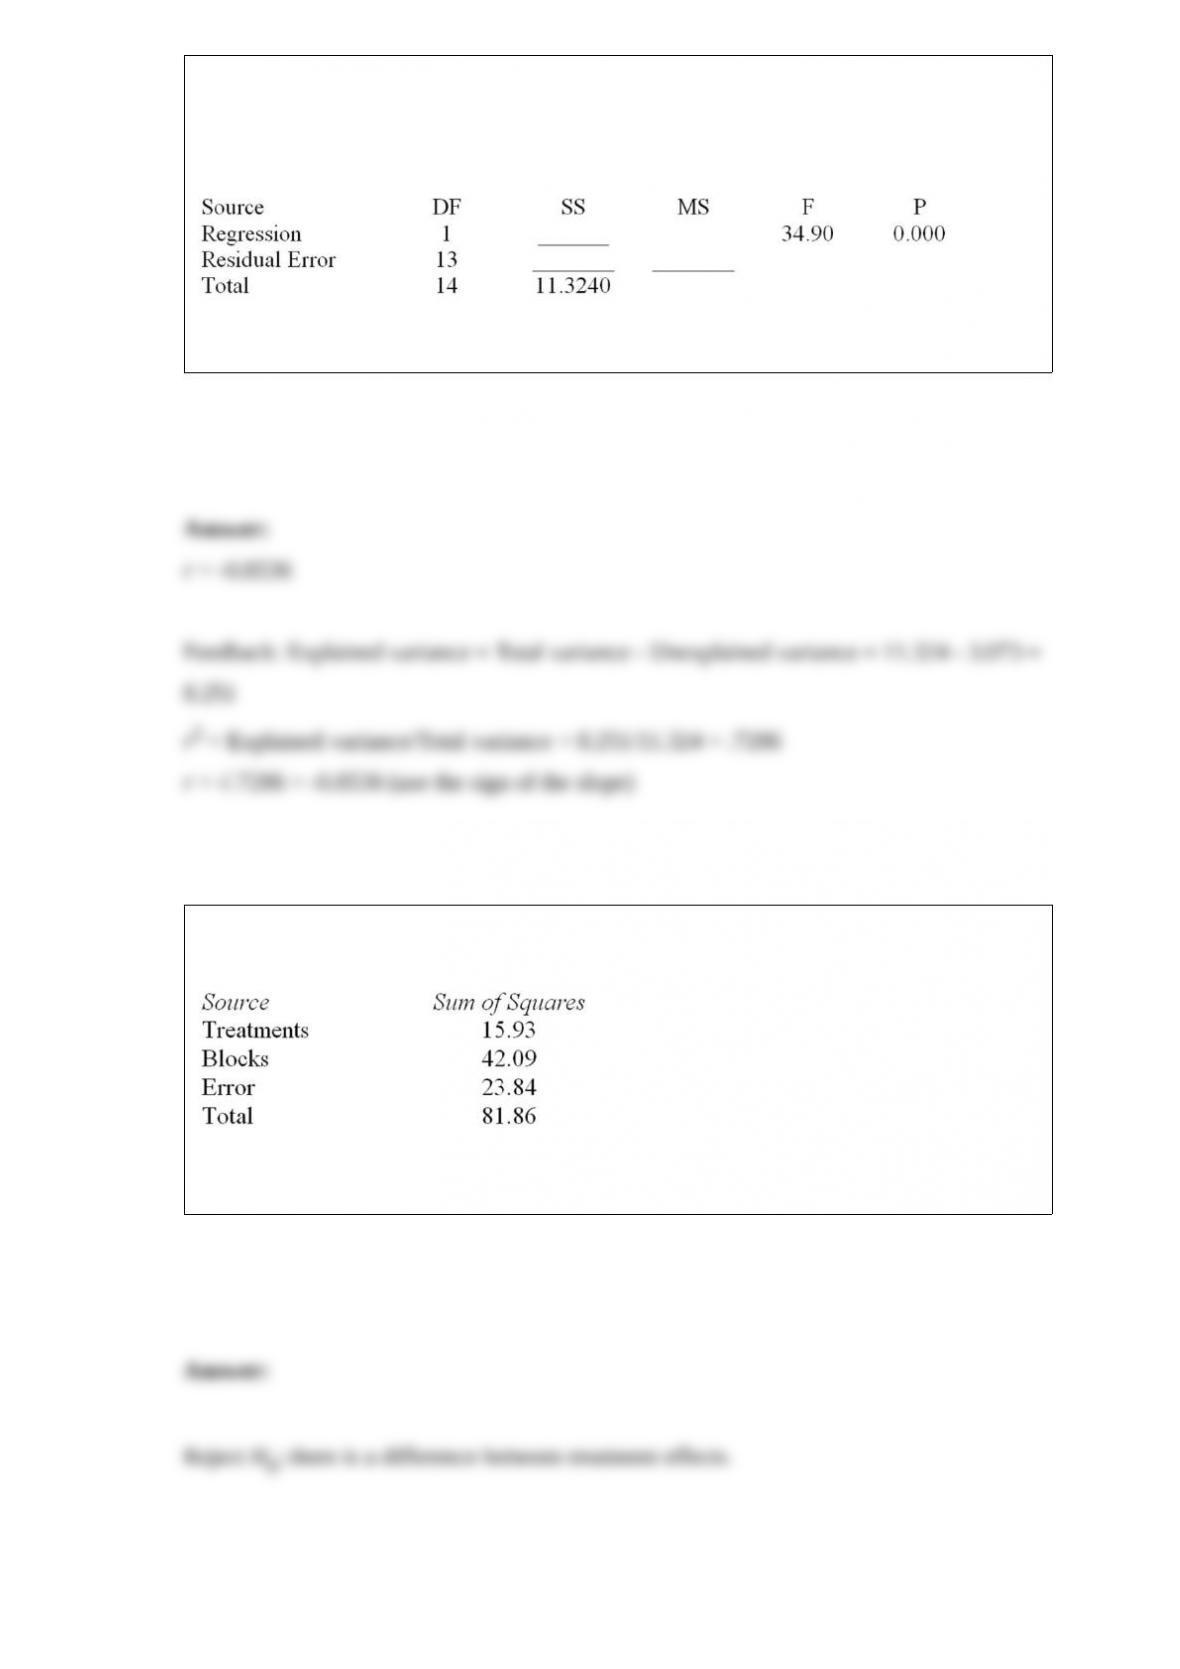
Consider the following partial analysis of variance table from a randomized block
design with 6 blocks and 4 treatments.
Test H0: There is no difference between treatment effects at α = .05.
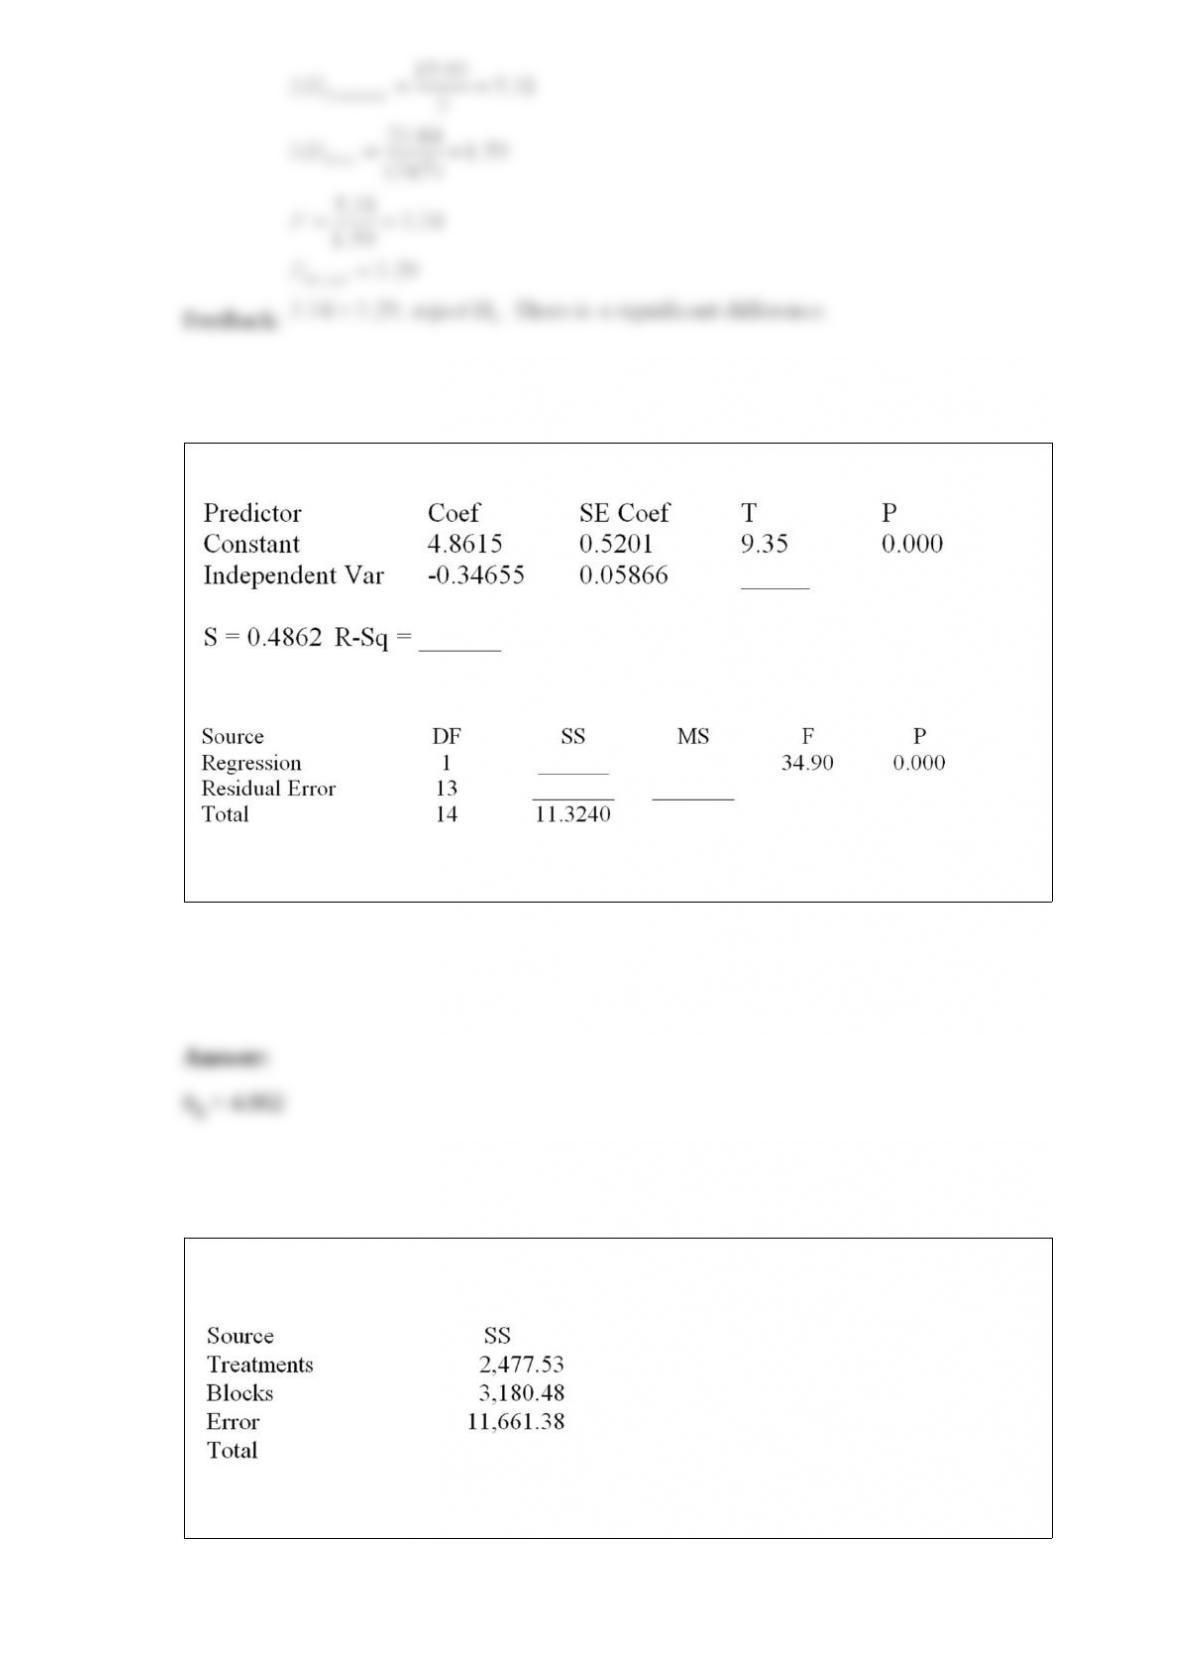
Consider the following partial computer output from a simple linear regression analysis.
Analysis of Variance
What is the estimated y-intercept?
Consider the following partial analysis of variance table from a randomized block
design with 10 blocks and 6 treatments.
Determine the degrees of freedom for treatments.
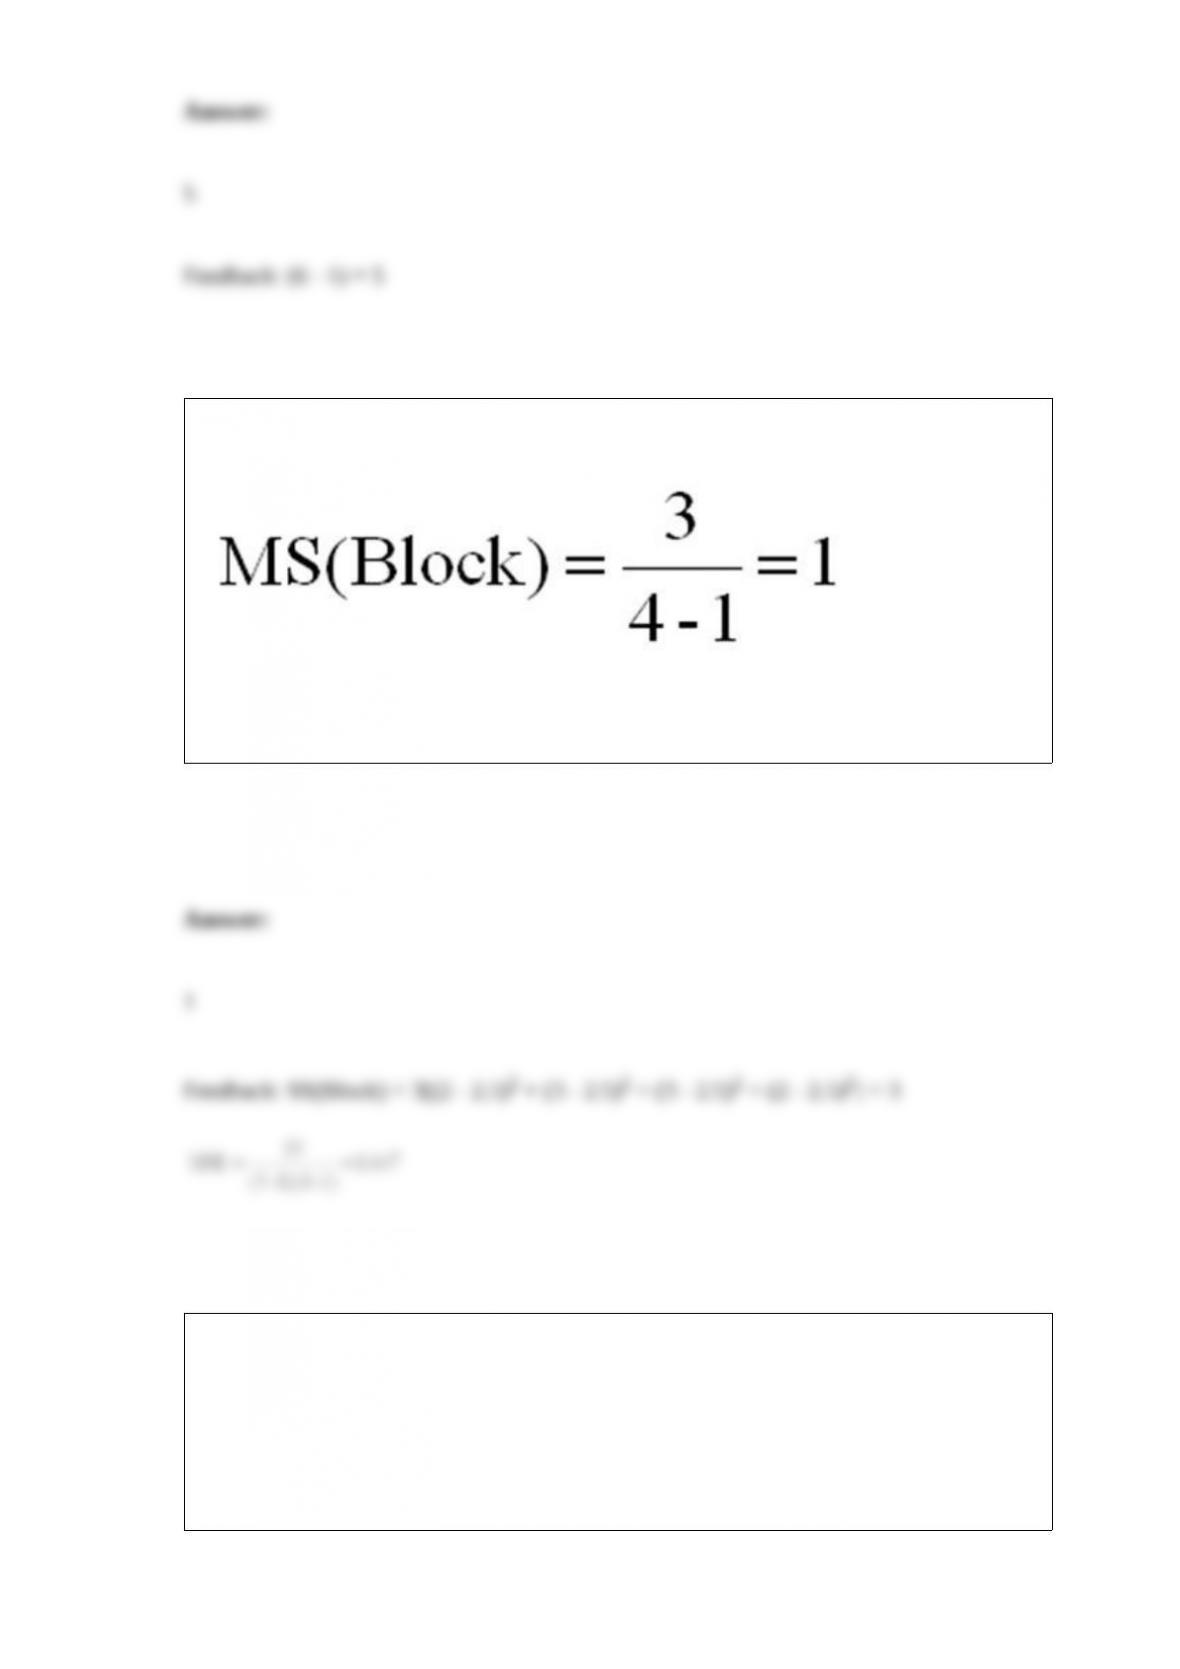
Consider the randomized block design with 4 blocks and 3 treatments given above.
What is the block mean square?
The following results were obtained from a simple regression analysis:
Ŷ = 37.2895 – 1.2024X
r2 = .6744 sb = .2934
When X (independent variable) is equal to zero, what is the estimated value of Y
(dependent variable)?
The management of a professional baseball team is in the process of determining the
budget for next year. A major component of future revenue is attendance at the home
games. In order to predict attendance at home games, the team statistician has used a
multiple regression model with dummy variables. The model is of the form y = β0 +
β1x1 + β2x2 + β3x3 + ε, where:
y = attendance at a home game.
x1 = current power rating of the team on a scale from 0 to 100 before the game.
x2 and x3 are dummy variables, and they are defined below.
x2 = 1, if weekend,
x2 = 0, otherwise.
x3 = 1, if weather is favorable,
x3 = 0, otherwise.
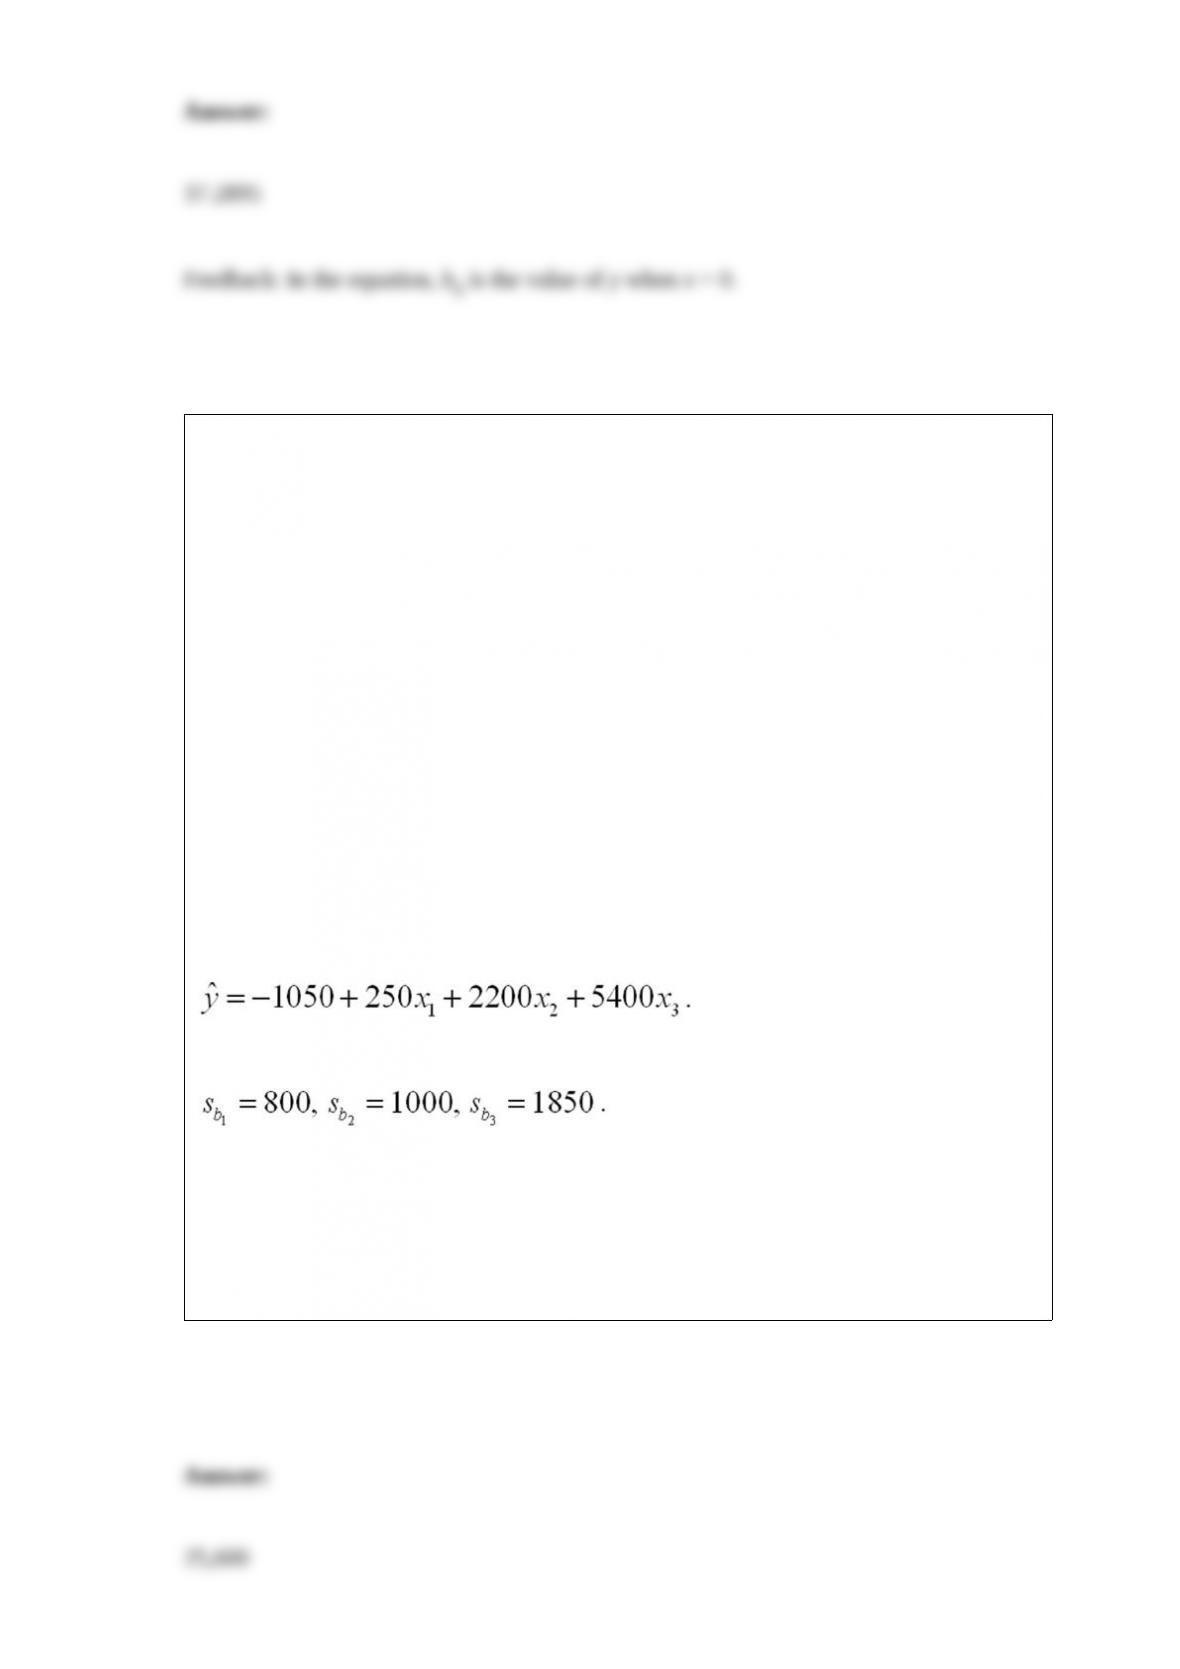
After collecting the data, based on 30 games from last year, and implementing the
above stated multiple regression model, the team statistician obtained the following
least squares multiple regression equation:
The multiple regression computer output also indicated the following:
Assume that the overall model is useful in predicting the game attendance. Assume
today is Wednesday morning and the weather forecast indicates sunny, excellent
weather conditions for the rest of the day. Later today, there is a home baseball game for
this team. Assume that the current power rating of the team is 85, and predict the
attendance for today’s game.
A local tire dealer wants to predict the number of tires sold each month. He believes
that the number of tires sold is a linear function of the amount of money invested in
advertising. He randomly selects 6 months of data consisting of monthly tire sales (in
thousands of tires) and monthly advertising expenditures (in thousands of dollars). The
simple linear regression equation is ŷ = 3 + 1x, and the sample correlation coefficient
(r2) = .6364. Test to determine if there is a significant correlation between the monthly
tire sales and monthly advertising expenditures. Use H0: ρ = 0 vs. HA: ρ ≠ 0 at α = .05.
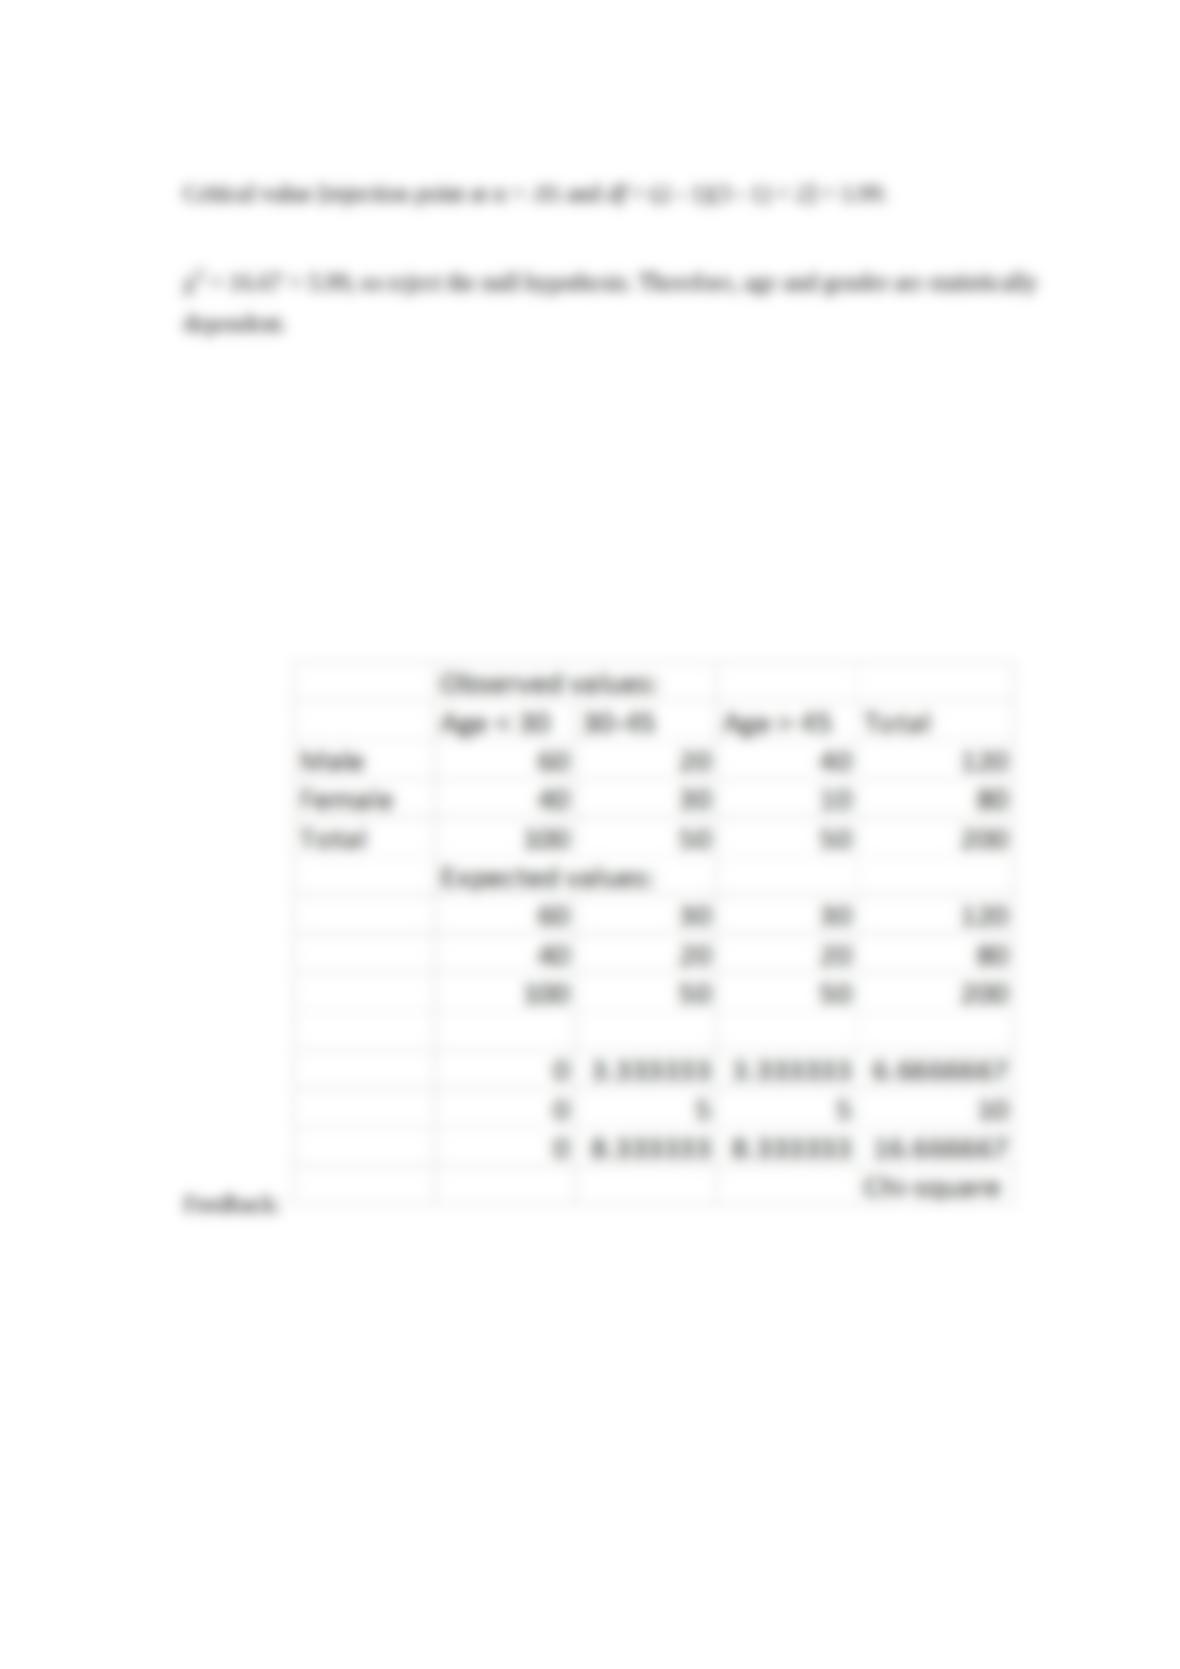
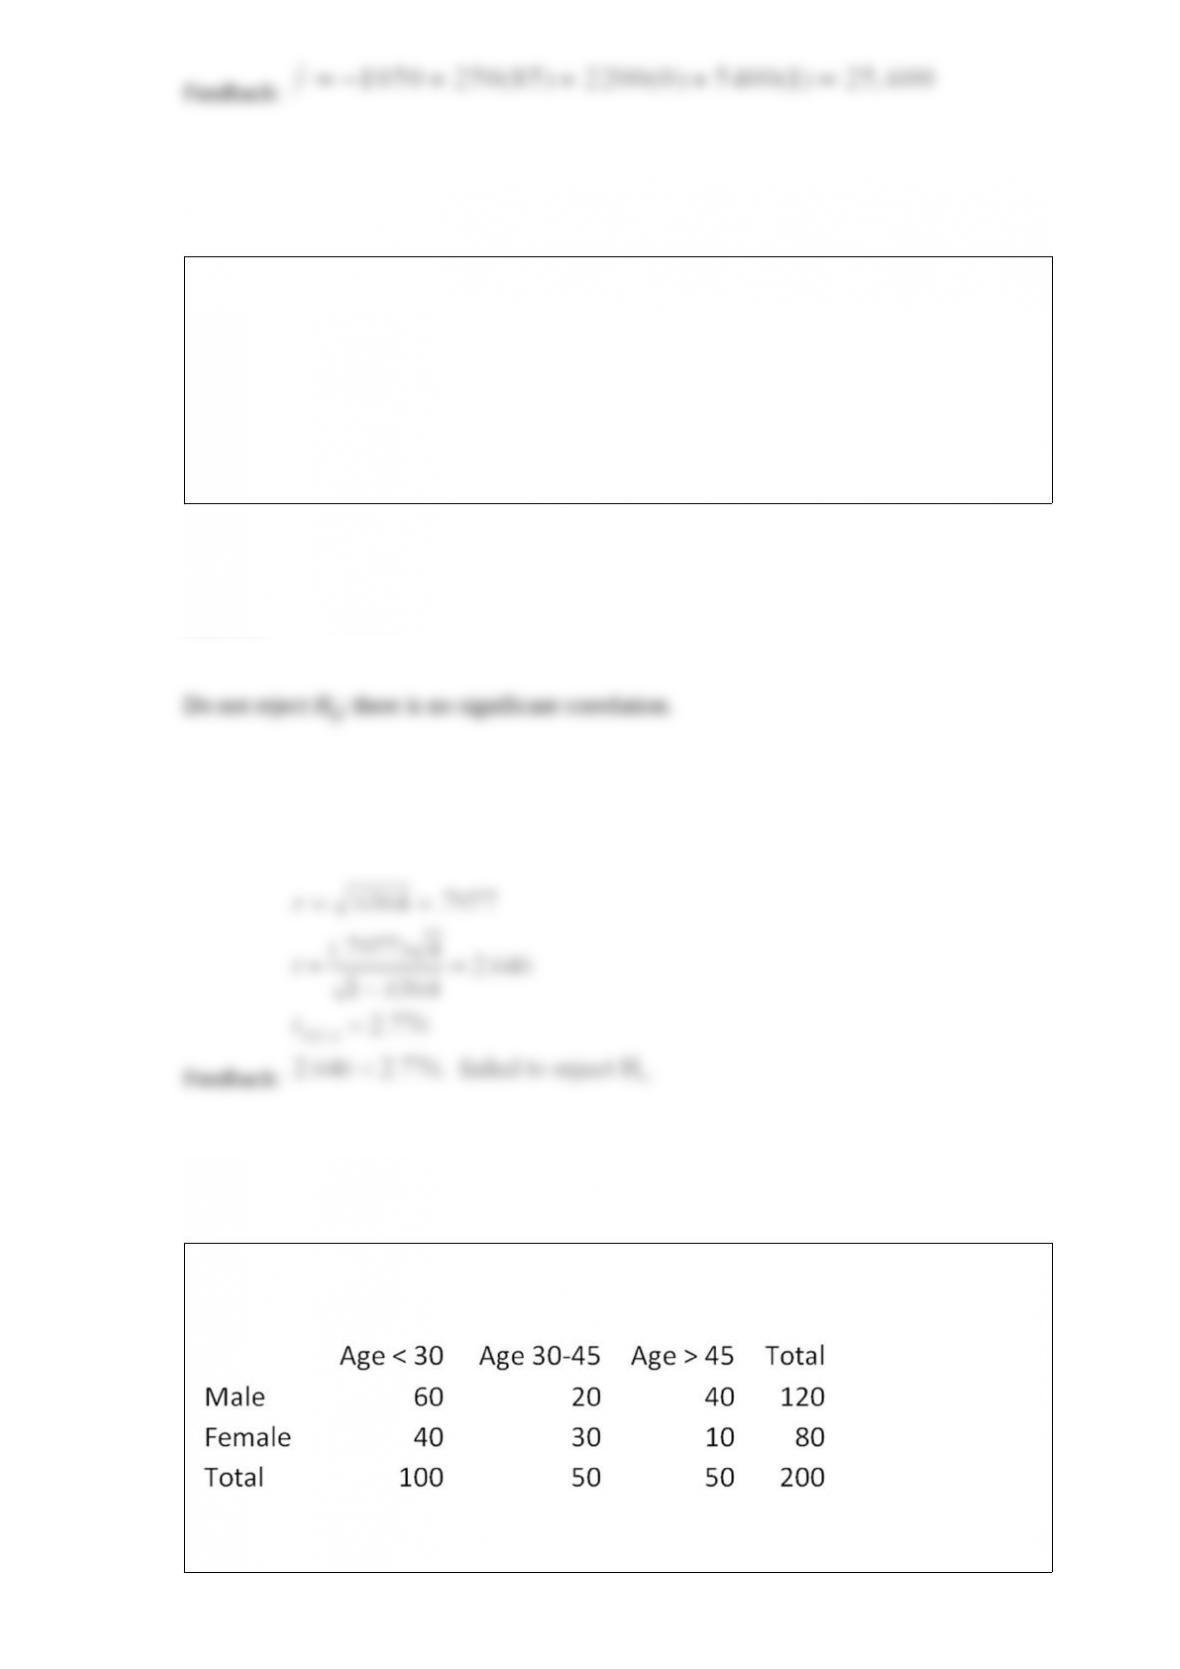
A survey was conducted on the age and gender of the purchasers of a specific
automotive model. The results are below:
Test the null hypothesis that age is independent of gender at α = .05.