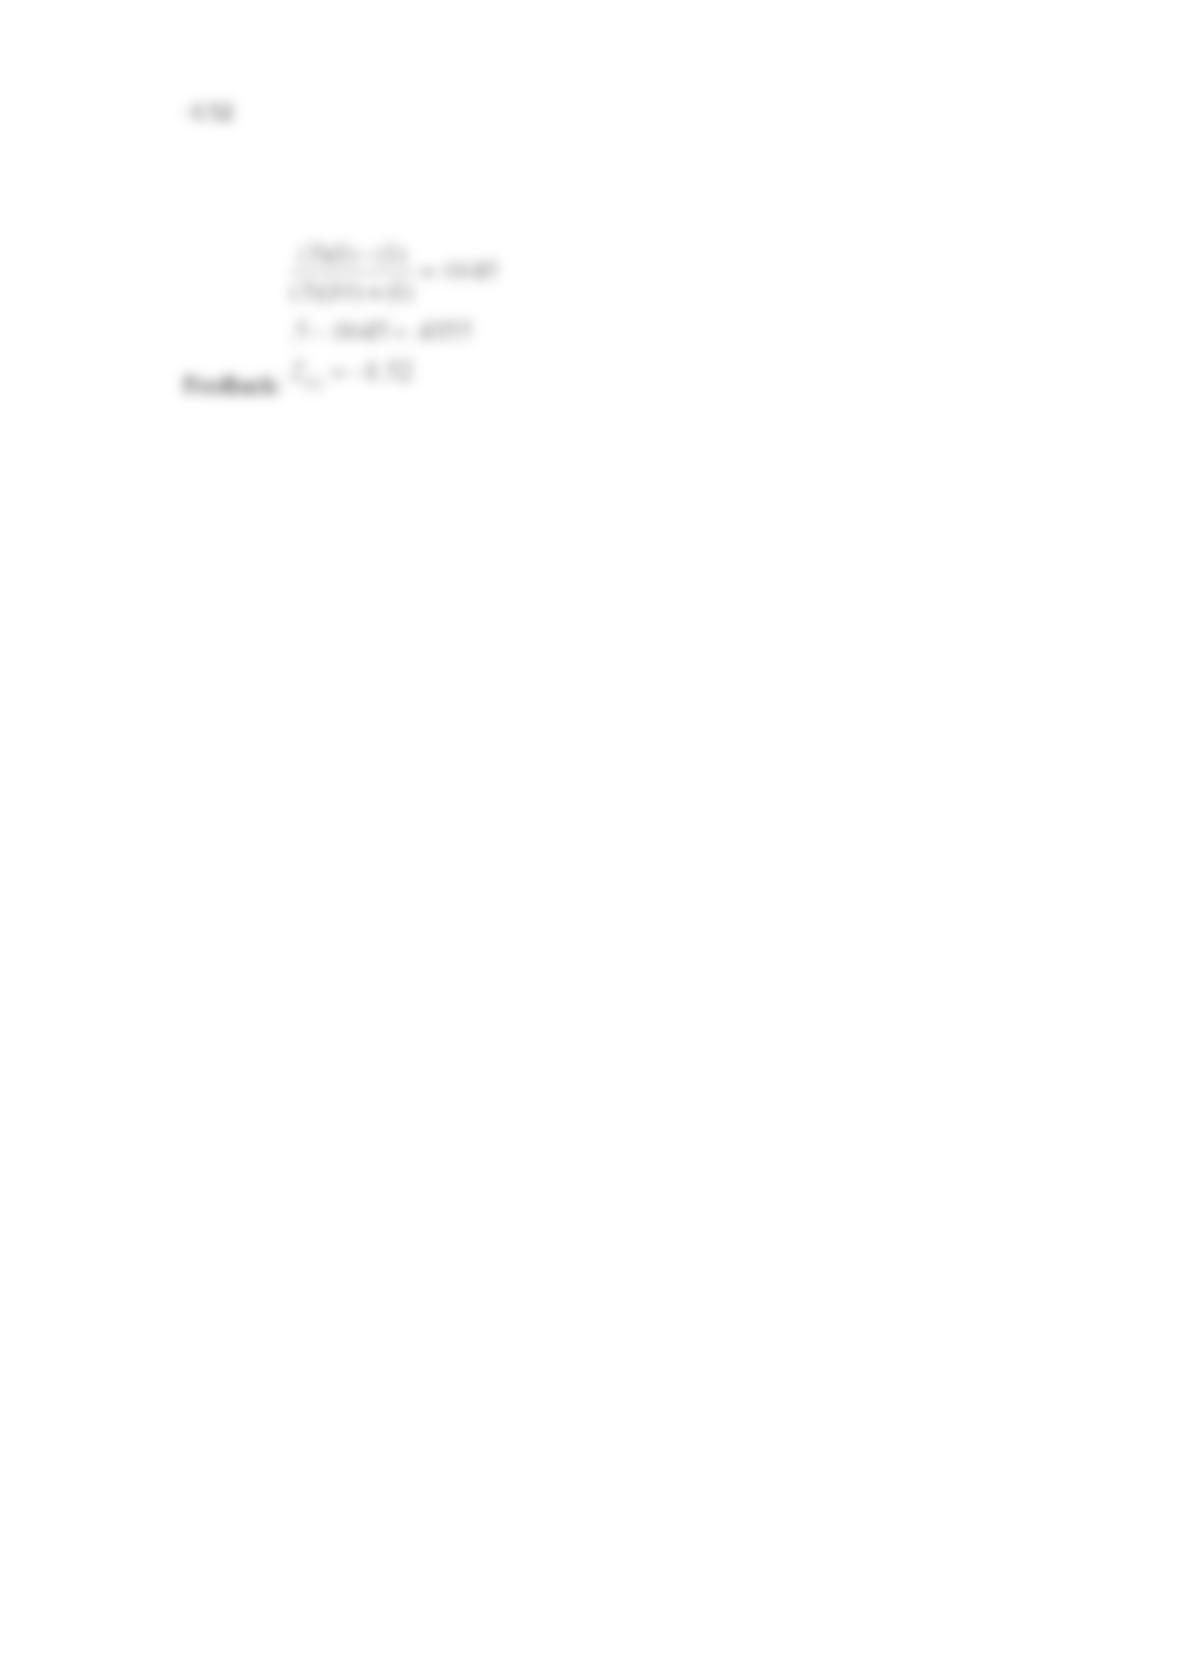
Consider the one-way ANOVA table.
How many groups (treatment levels) are included in the study?
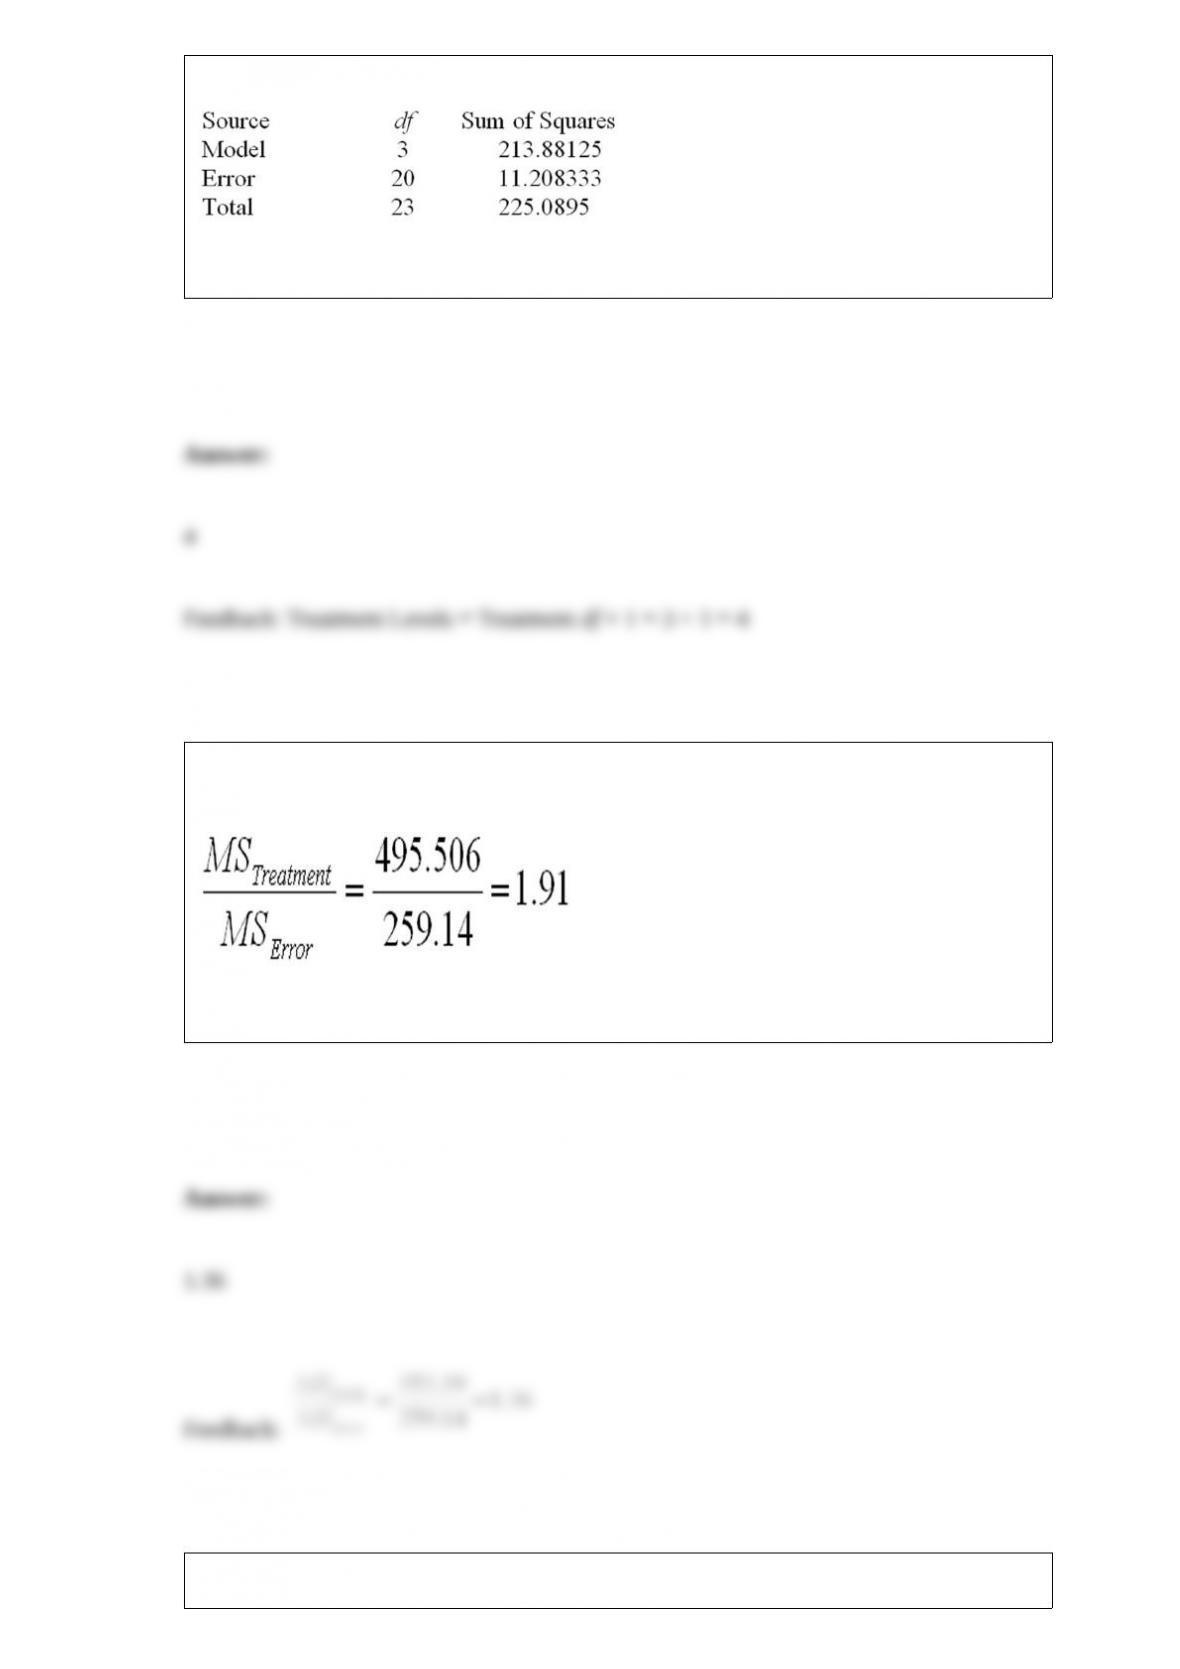
Consider the following partial analysis of variance table from a randomized block
design with 10 blocks and 6 treatments.
What is the calculated F statistic for blocks?
Consider a set of 50 measurements with mean 50.2 and standard deviation 18.7 and
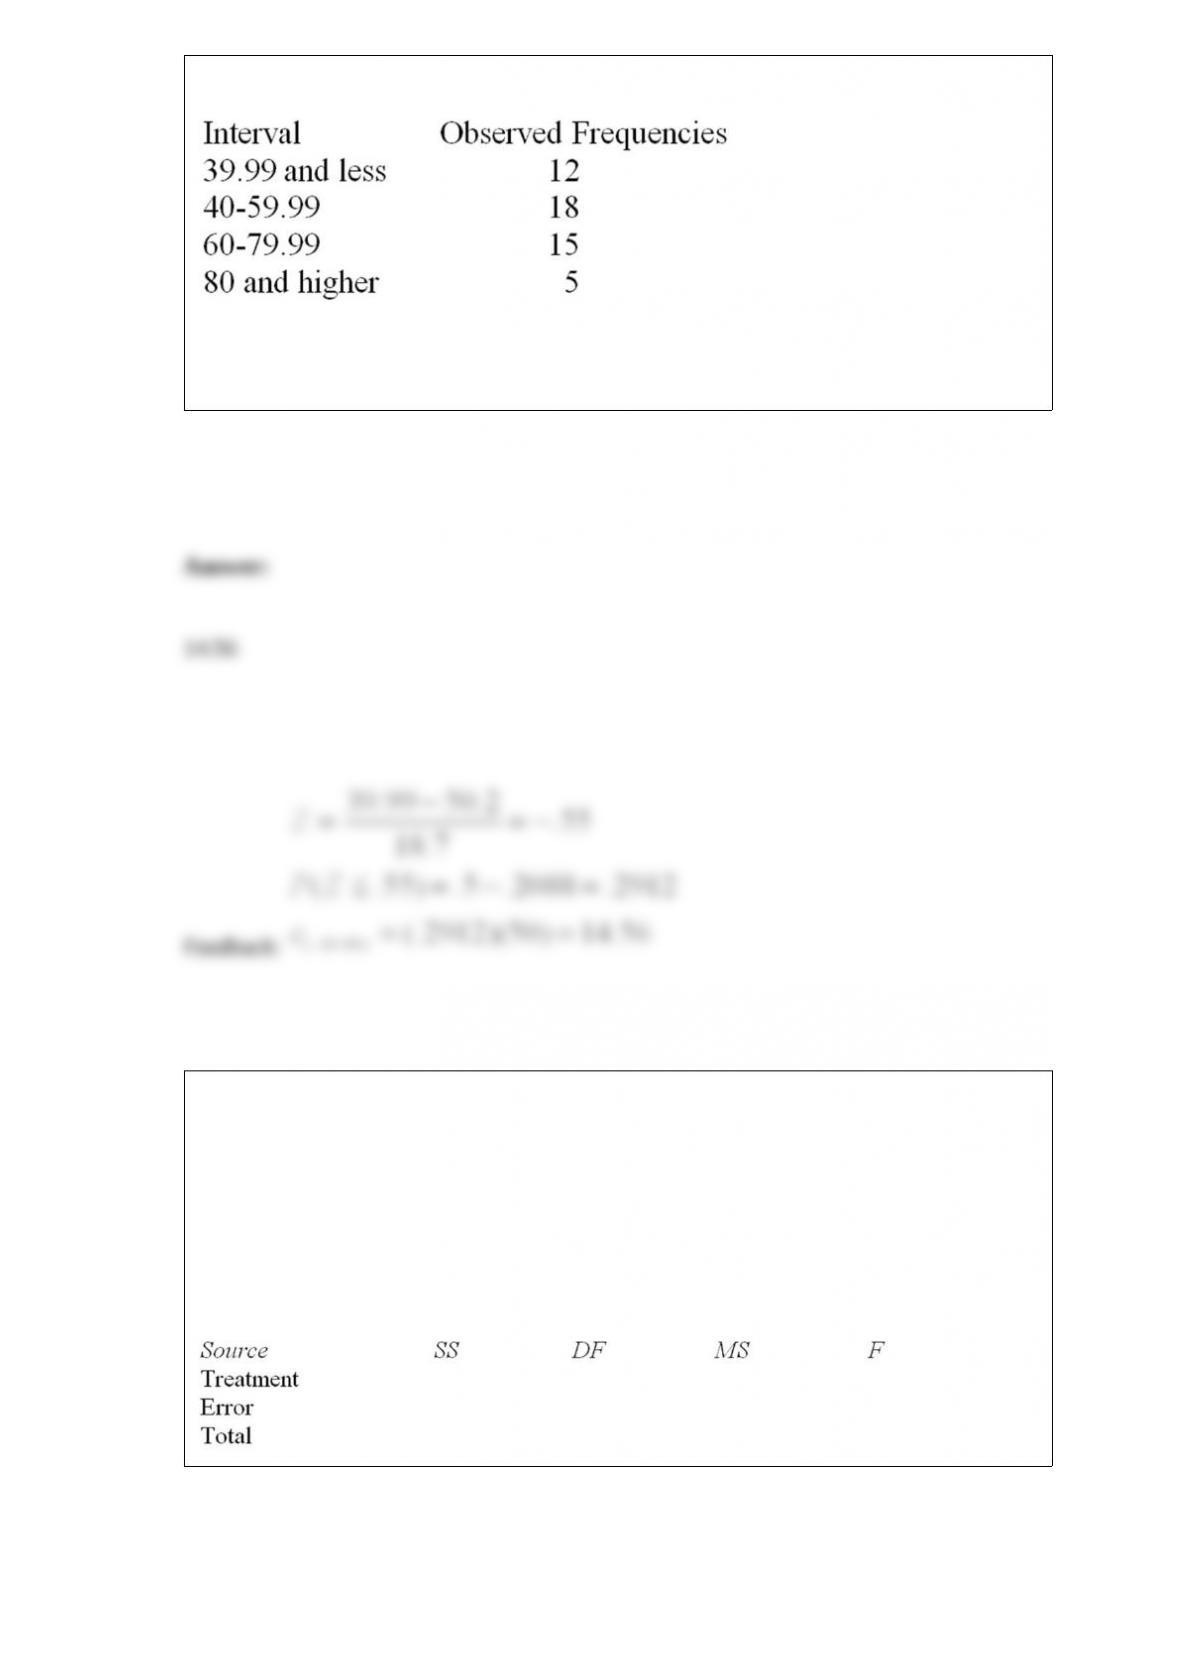
with the following observed frequencies.
It is desired to test whether these measurements came from a normal population.
Calculate the expected frequency for the interval 0-39.99.
A researcher has used a one-way analysis of variance model to test whether the average
starting salaries differ among recent graduates from the nursing, engineering, business,
and education disciplines. She has randomly selected four graduates from each of the
four areas.
If MSE = 4, and SSTO = 120, complete the following ANOVA table. Is there a
significant difference in the starting salaries among the four disciplines? (H0: No
difference)
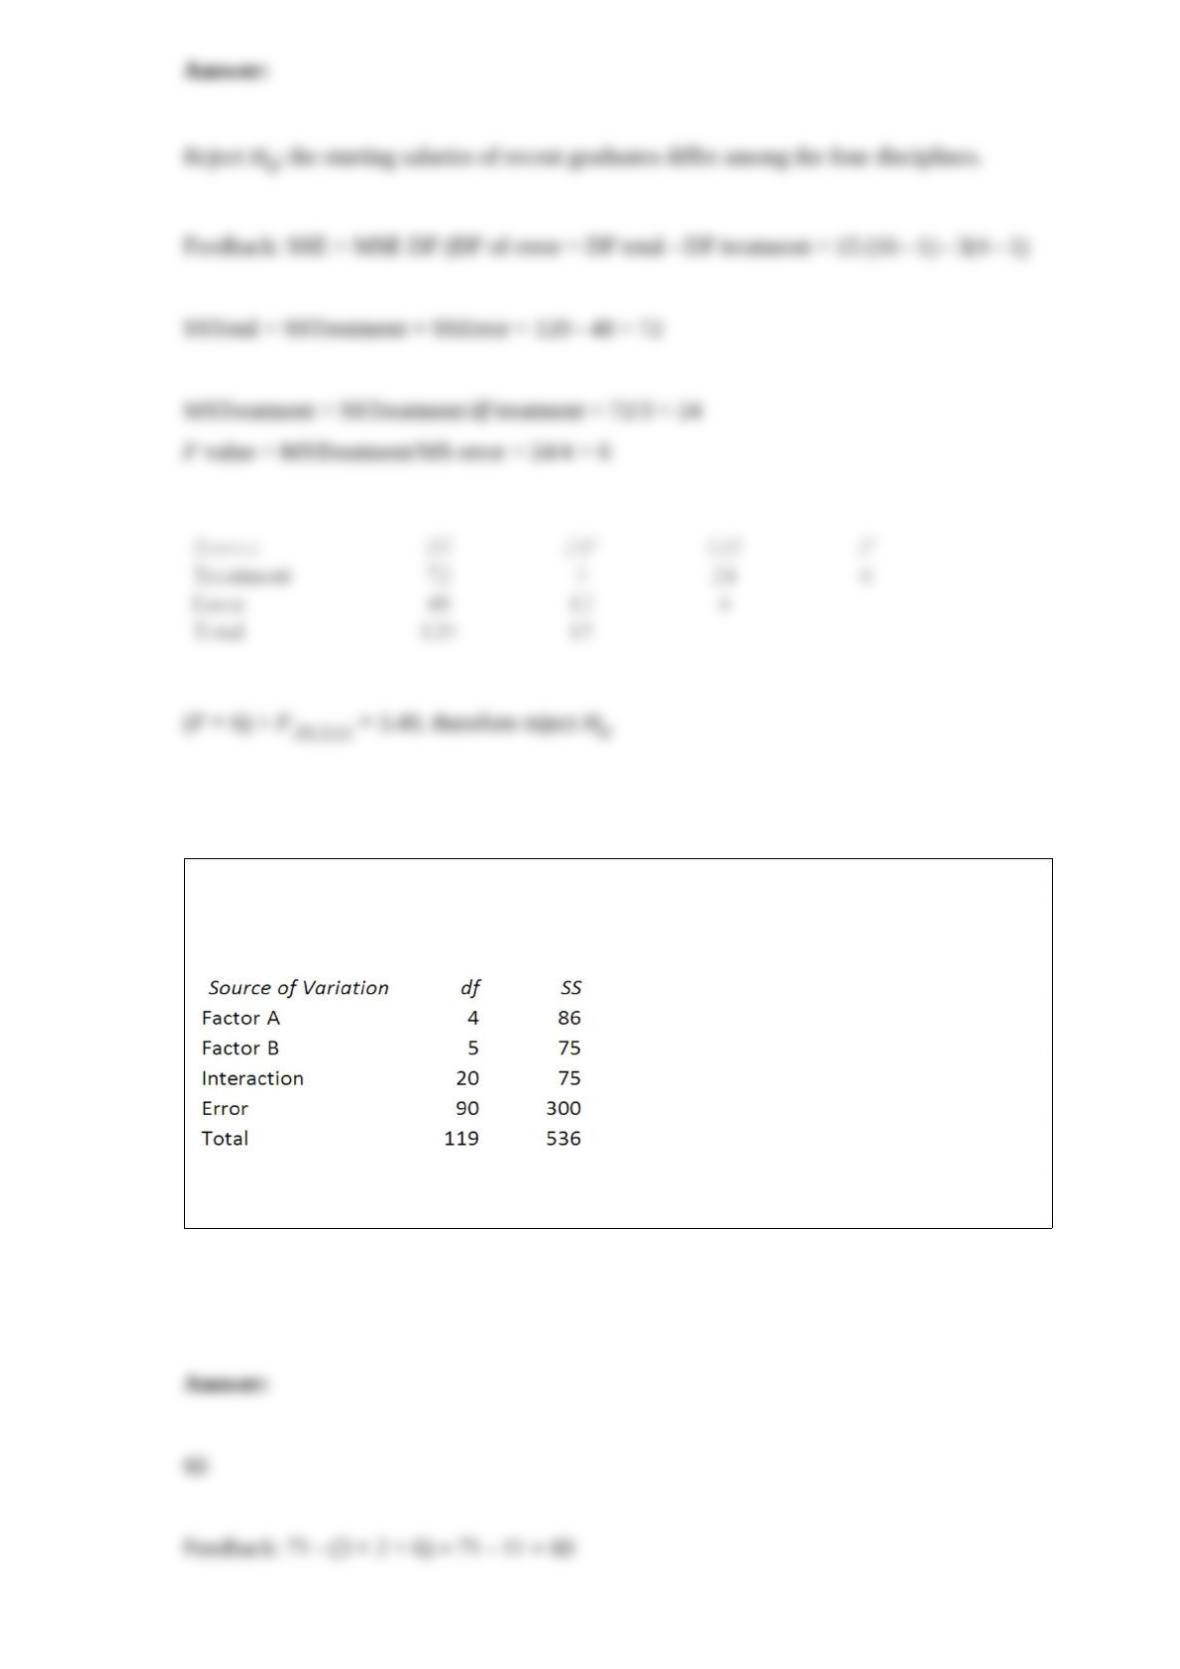
Consider a two-way analysis of variance experiment with treatment factors A and B,
with factor A having four levels and factor B having three levels. The results are
summarized below.
Calculate the degrees of freedom for the error term.
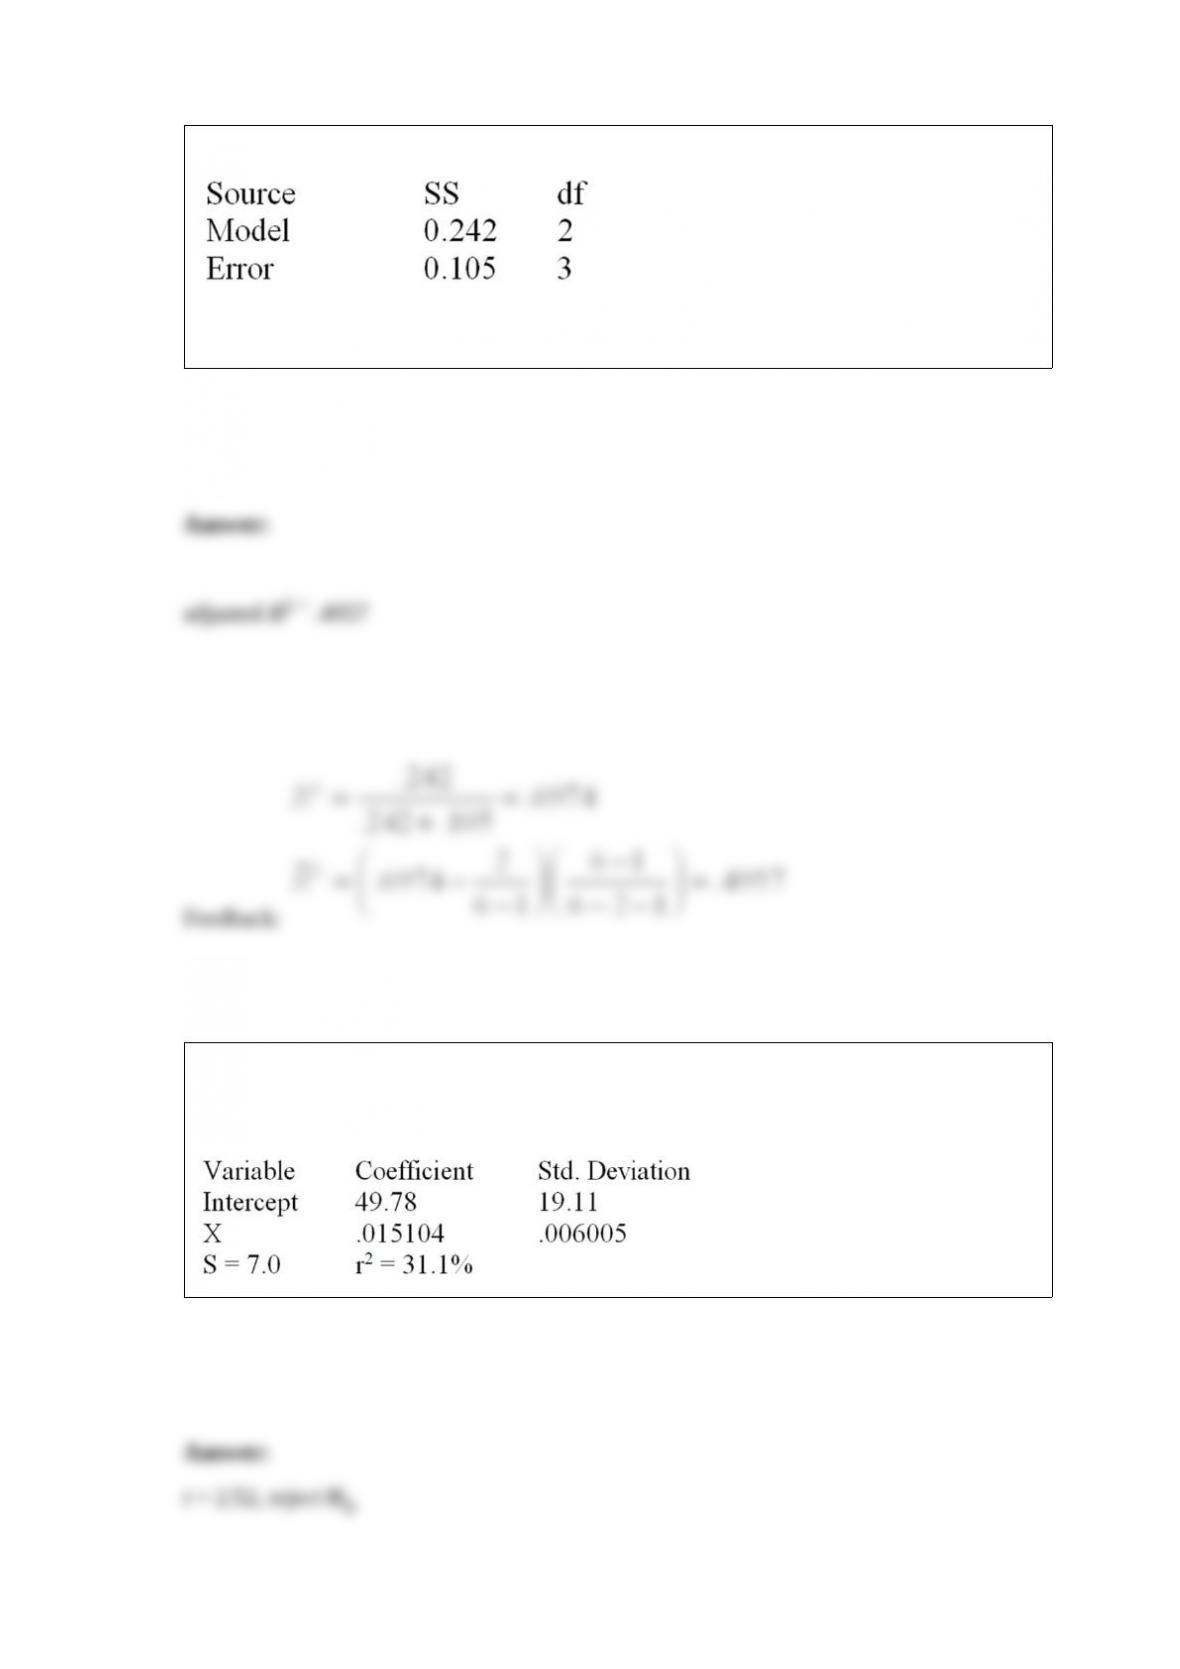
Below is a partial multiple regression ANOVA table.
Calculate the adjusted R2.
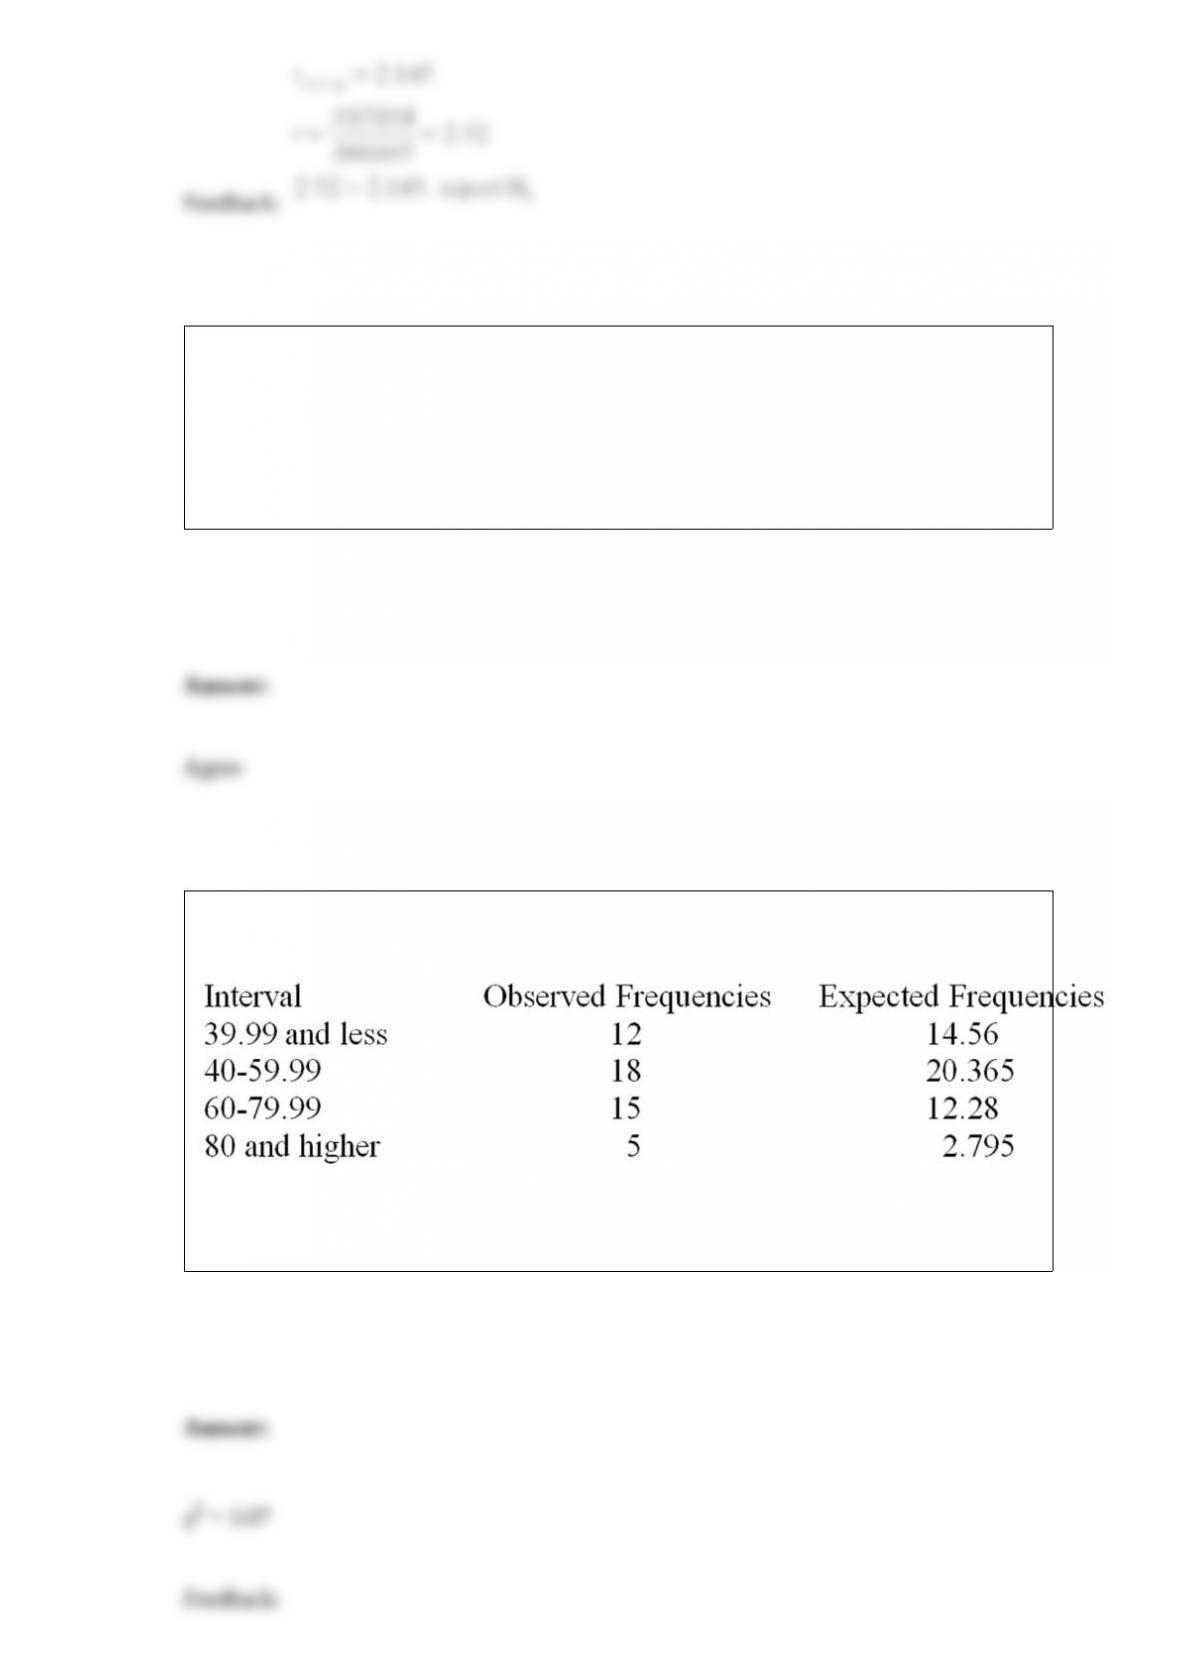
Consider the following partial computer output from a simple linear regression analysis
with a sample size of 16 observations. Find the t test to test the significance of the
model.
An experiment was performed on a certain metal to determine if the strength is a
function of heating time. The 95 percent confidence interval for the average strength of
a metal sheet when the average heating time is 4 minutes is from 4.325 to 5.675.
Therefore, we are confident at α = .05 that the average strength of this metal heated for
four minutes is between 4.325 and 5.675 pounds per square inch. Do you agree or
disagree with this statement?
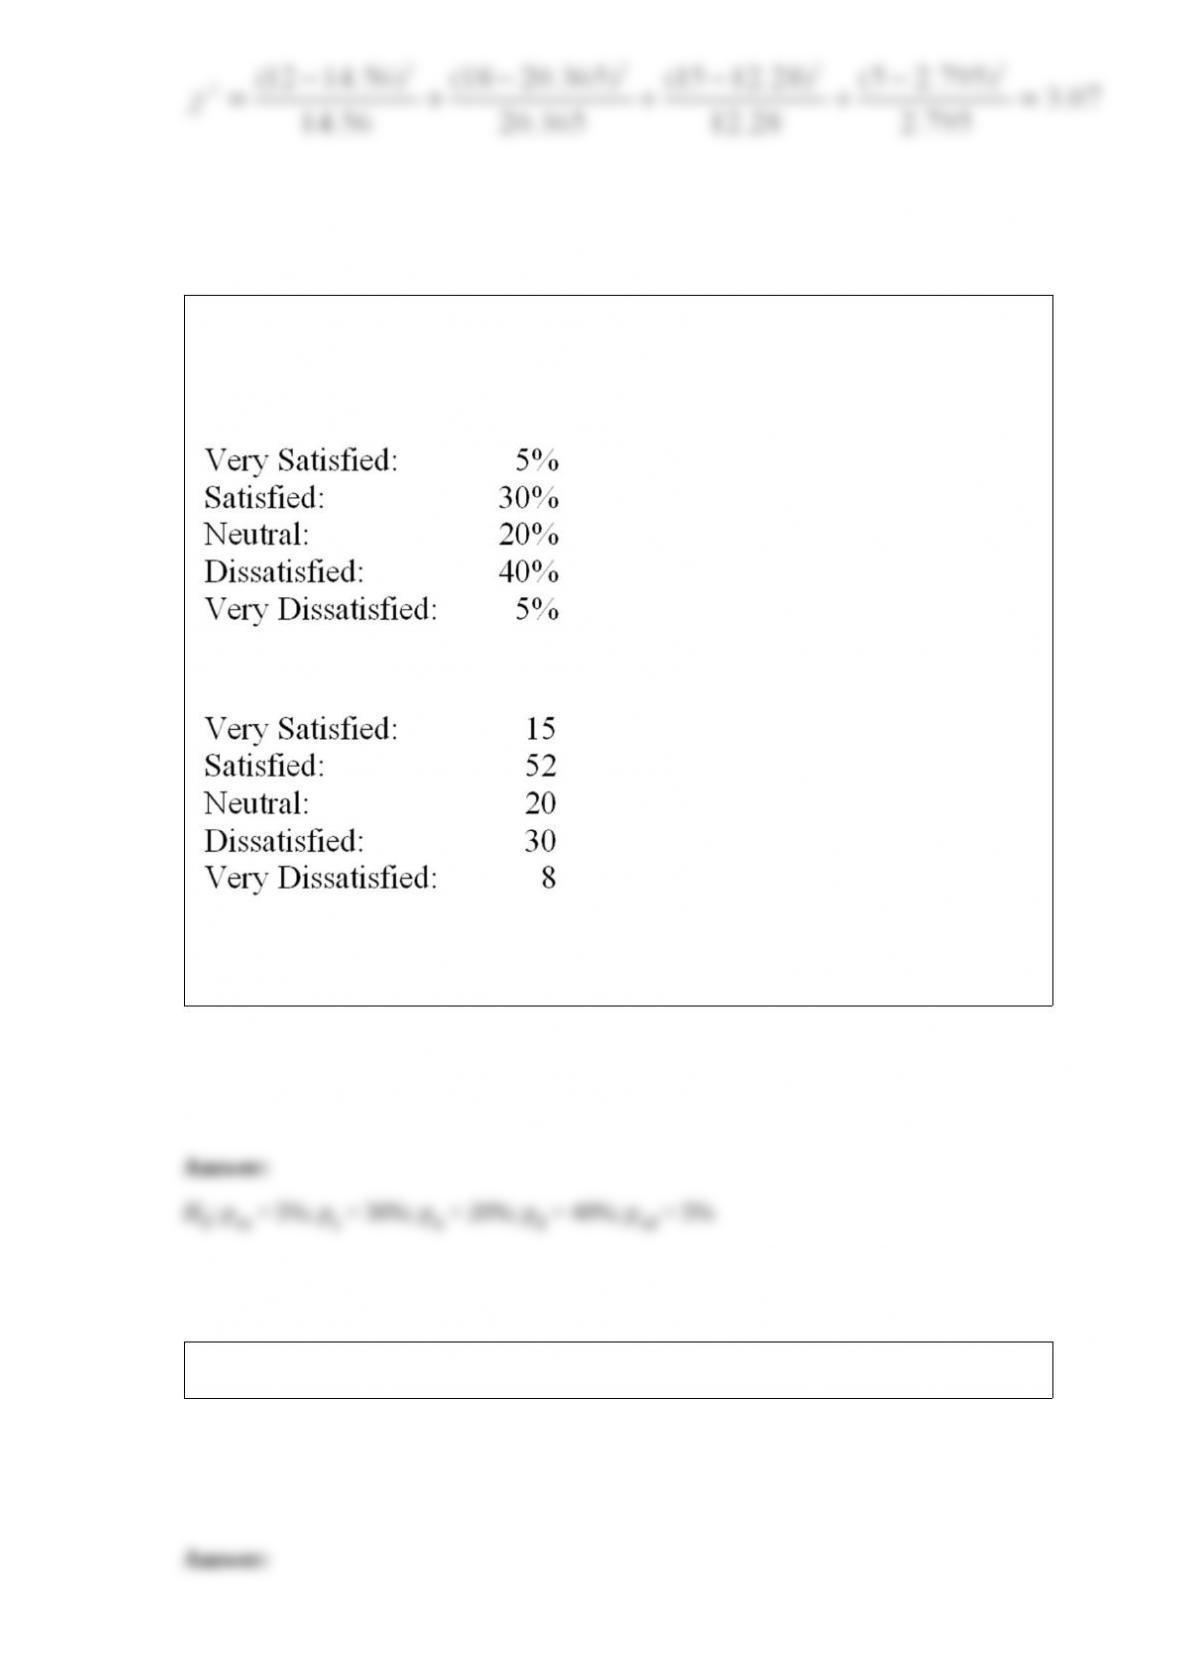
Consider a set of 50 measurements with mean 50.2 and standard deviation 18.7 and
with the following observed and expected frequencies.
It is desired to test whether these measurements came from a normal population.
Calculate the value of the chi-square test statistic.
The AAA Co. is interested in the level of satisfaction of their employees with the
benefit package that they offer compared to their major competitors. A consultant hired
to conduct the satisfaction survey told AAA Co. that the distribution of level of
satisfaction at other companies is displayed below:
A survey was conducted of 125 AAA employees with the following results:
What is the null hypothesis to test if the distribution of satisfaction is the same at AAA
as at their competitors?
Calculate the odds ratio for an event when its probability is 0.50.
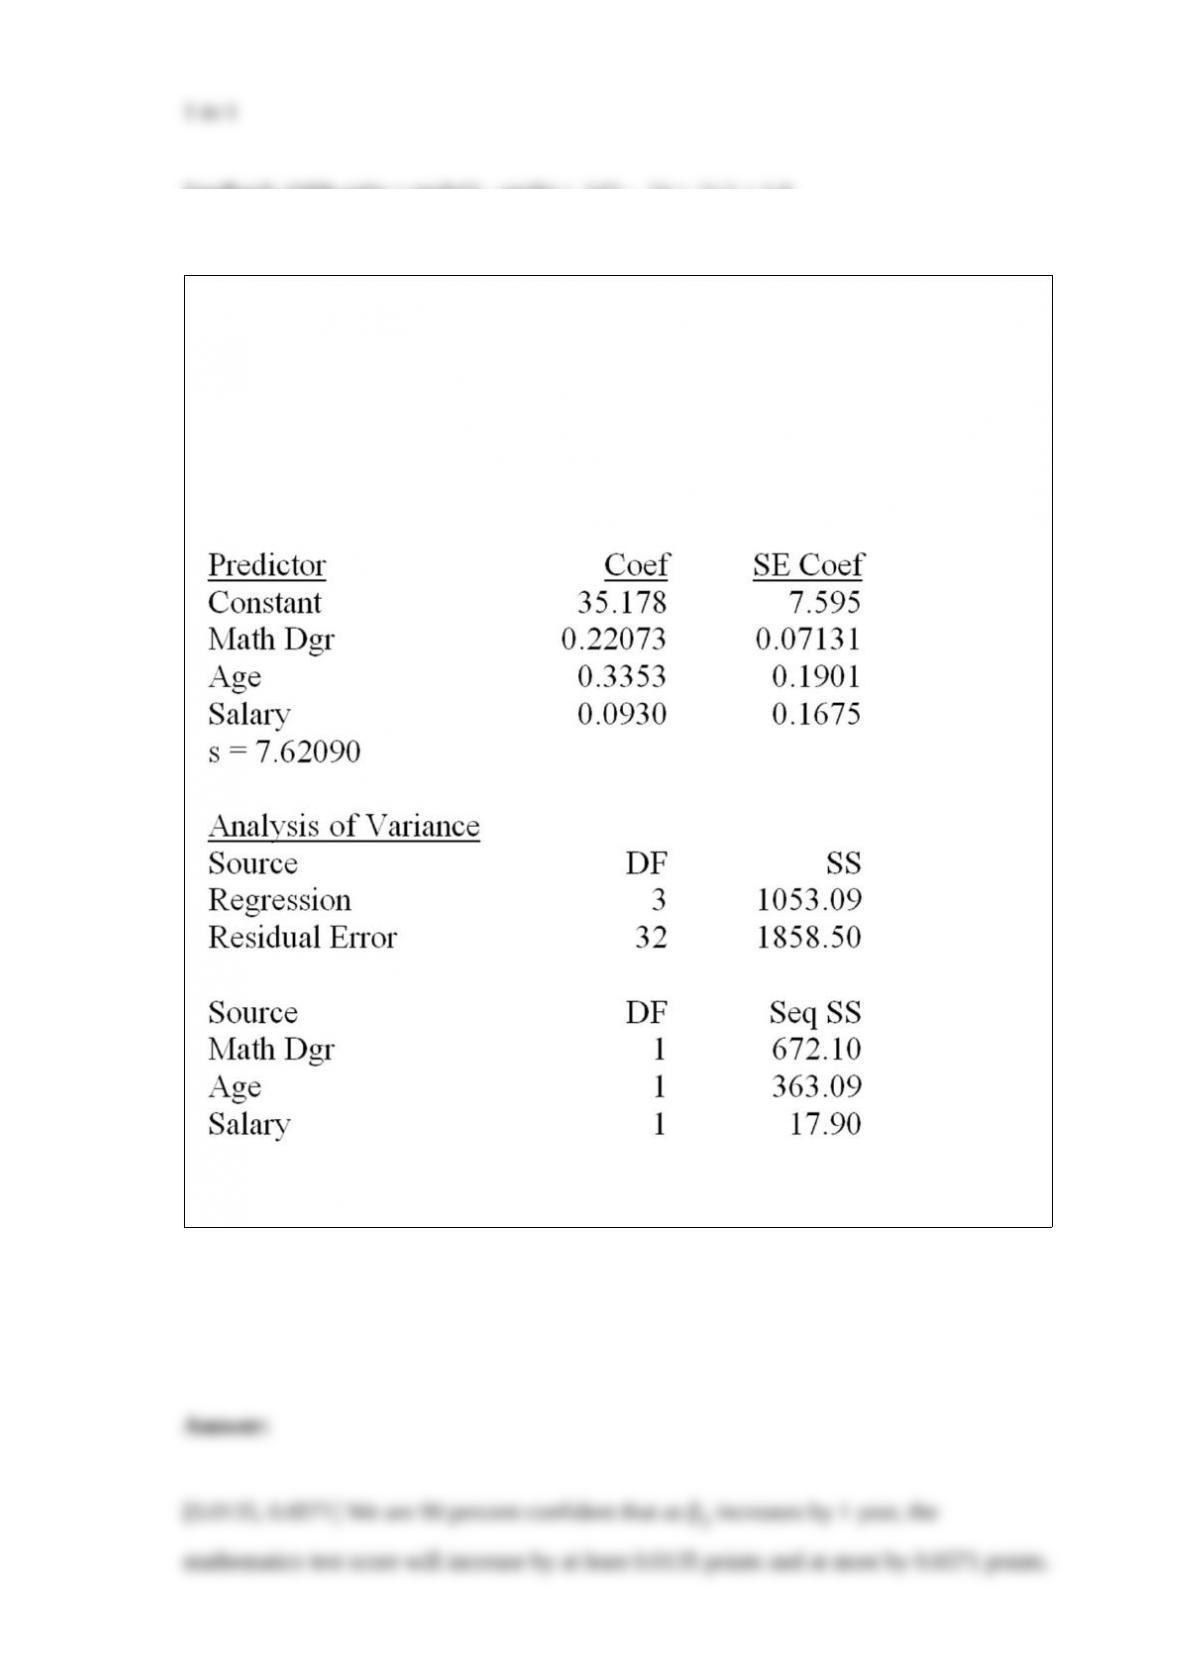
A member of the state legislature has expressed concern about the differences in the
mathematics test scores of high school freshmen across the state. She asks her research
assistant to conduct a study to investigate what factors could account for the
differences. The research assistant looks at a random sample of school districts across
the state and uses the factors of percentage of mathematics teachers in each district with
a degree in mathematics, the average age of mathematics teachers, and the average
salary of mathematics teachers.
Determine the 90 percent interval for β2 and interpret its meaning.
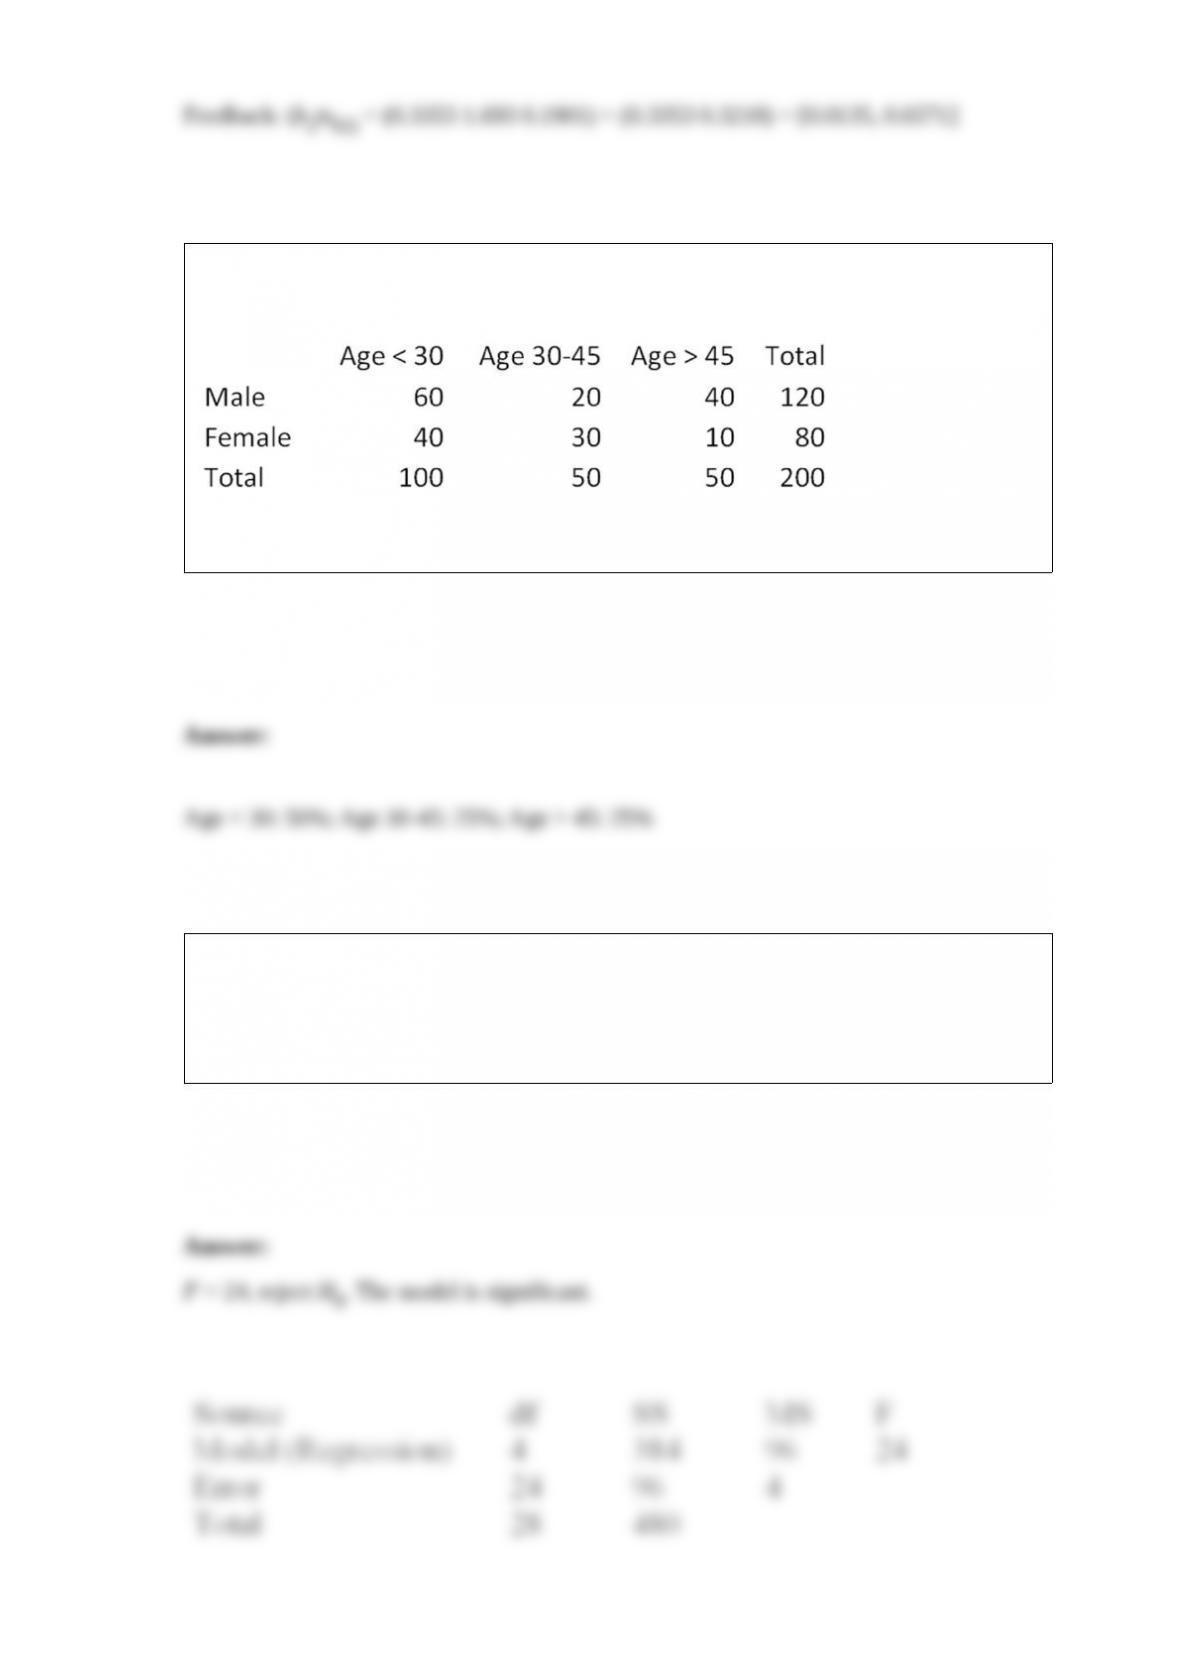
A survey was conducted on the age and gender of the purchasers of a specific
automotive model. The results are below:
For each column total, calculate the corresponding percentage.
A multiple regression model with four independent variables consists of 29
observations. The multiple coefficient of determination R2 = .80, and the standard error
s = 2.0. Complete the analysis of variance table for this model, and test the overall
model for significance.
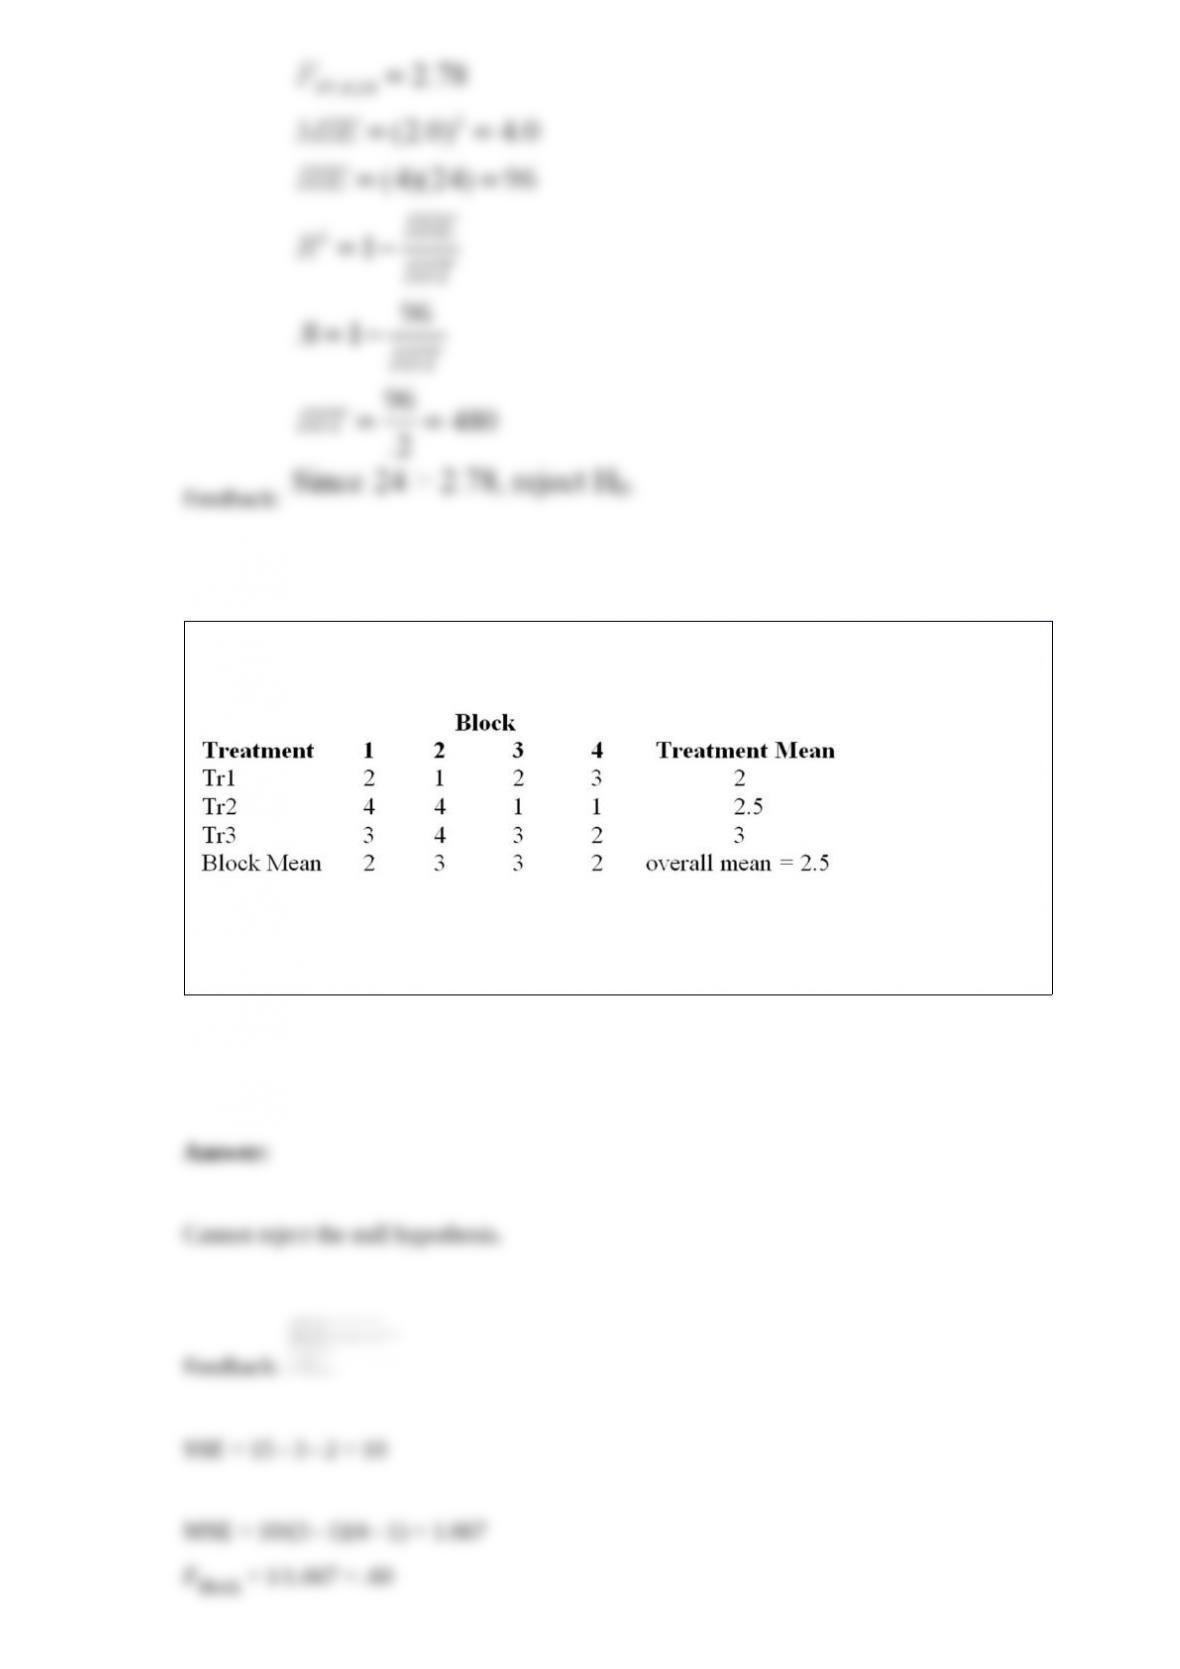
Consider the randomized block design with 4 blocks and 3 treatments given above. Test
H0: there is no difference between block effects at α = .05.
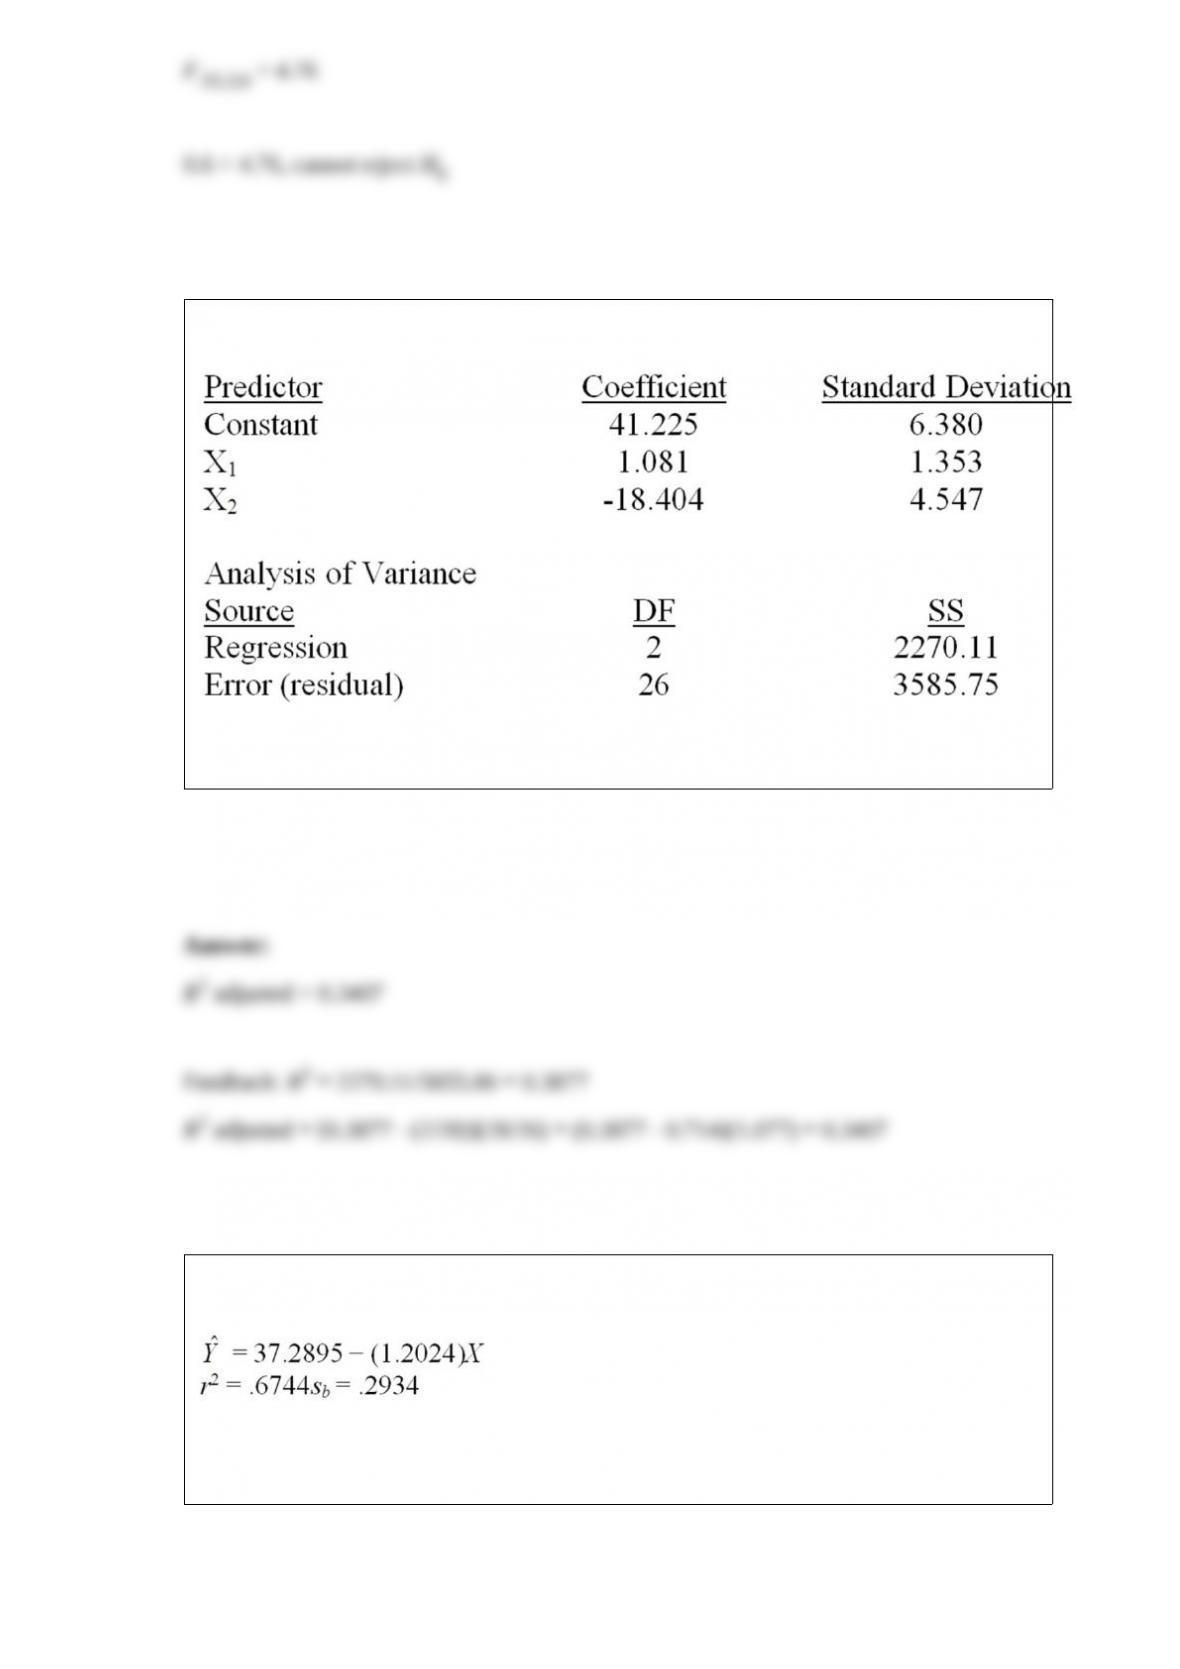
Consider the following partial computer output for a multiple regression model.
Calculate the adjusted R2.
Use the following results obtained from a simple linear regression analysis with 12
observations.
Test to determine if there is a significant negative relationship between the independent
and dependent variables at α = .05. Give the test statistic and the resulting conclusion.
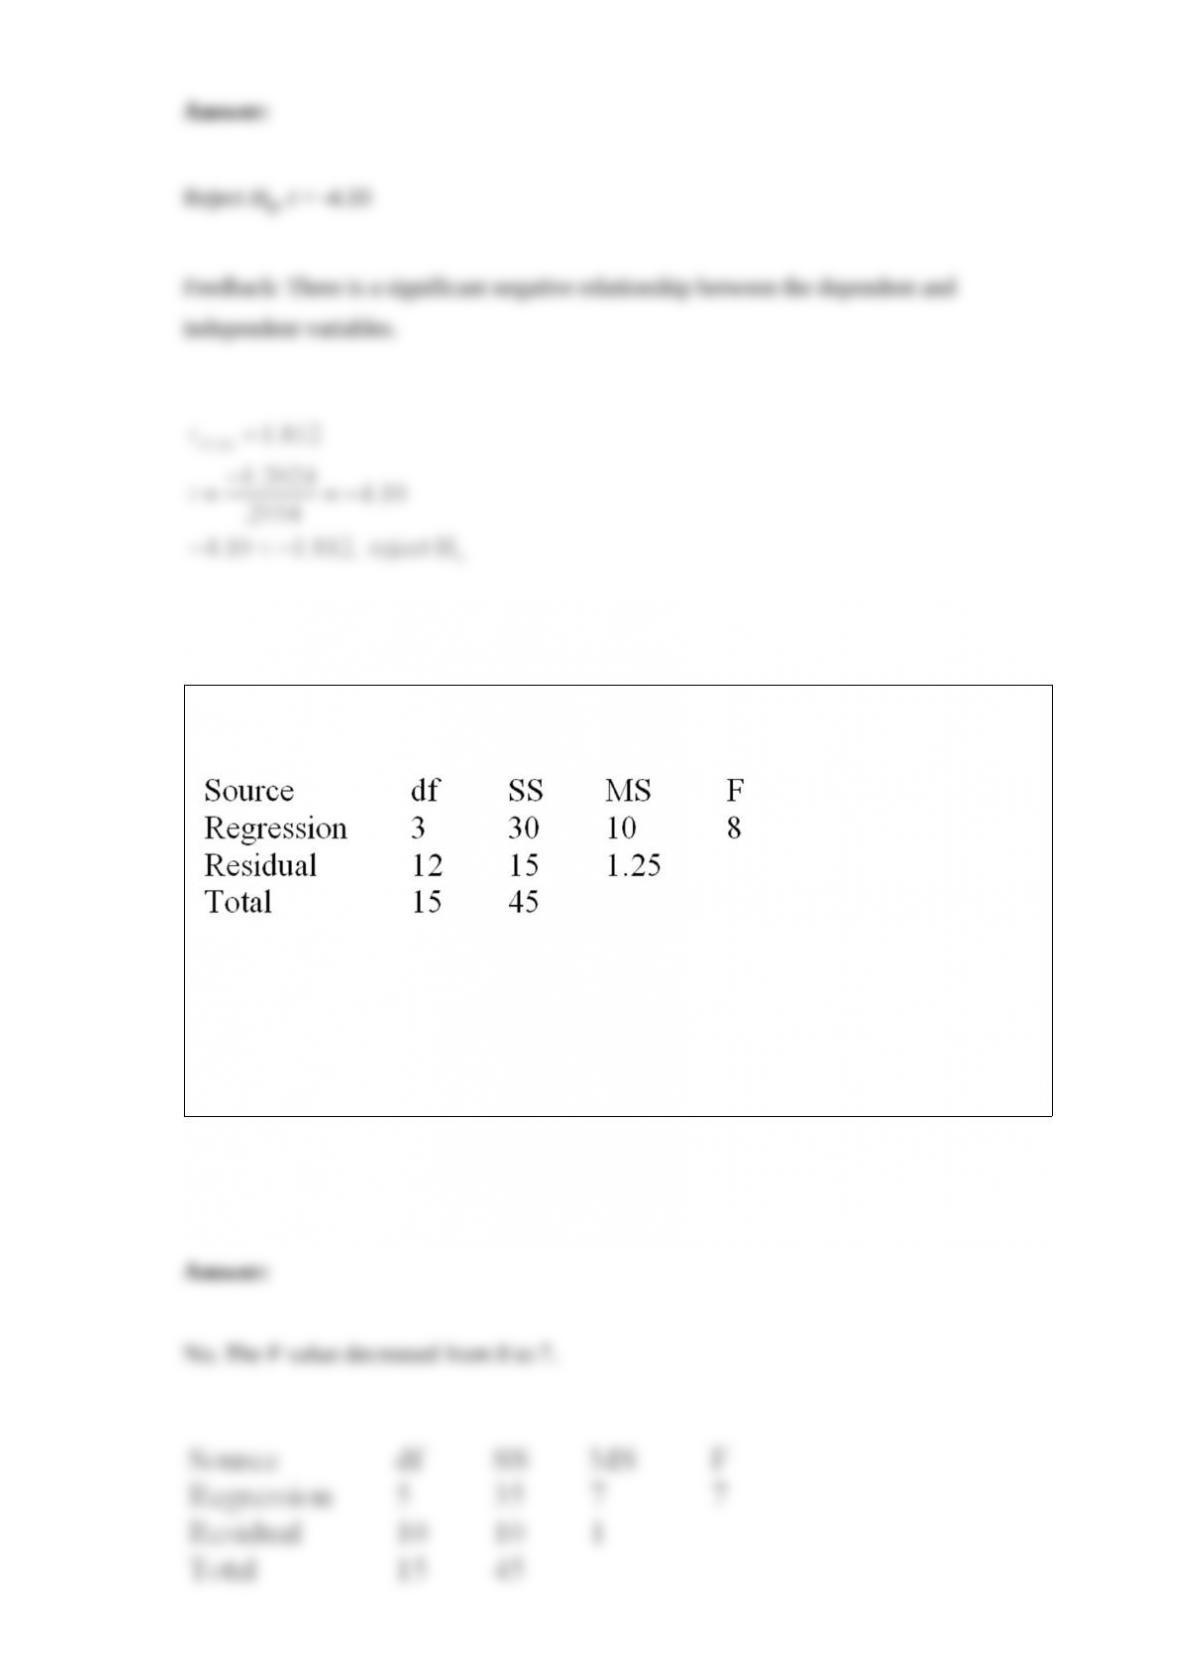
A multiple regression model with 3 independent variables and 16 observations
produced the following analysis of variance table.
After some consideration, the analyst decided to add two new independent variables to
the multiple regression model. As a result of this change, the unexplained variation
(SSE) decreased by 5. Complete the new analysis of variance table after the addition of
the two new independent variables. Did the two newly added variables improve the
model?
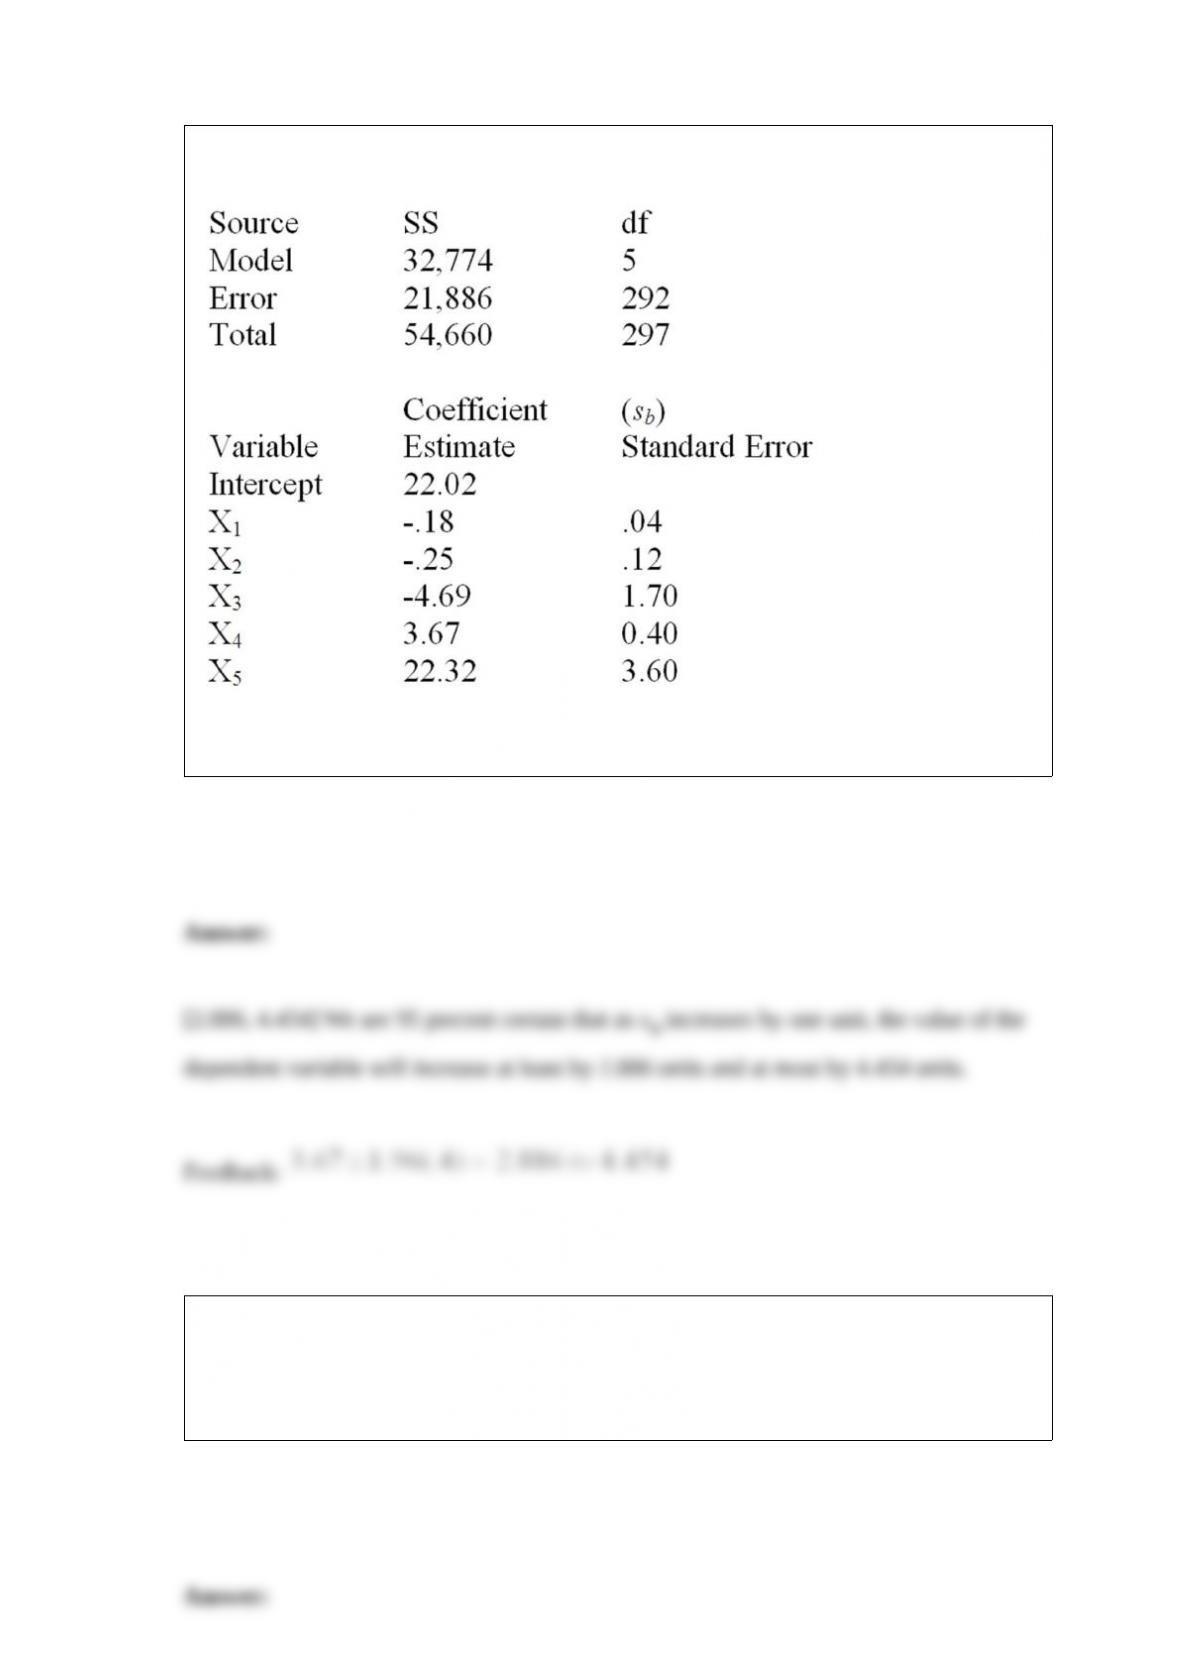
Below is a partial multiple regression computer output.
Determine the 95 percent interval for β4 and interpret its meaning.
An experiment was performed on a certain metal to determine if the strength is a
function of heating time. The sample size consists of 10 metal sheets. Residuals are
calculated for all 10 sheets and ordered from smallest to largest. Determine the normal
point for the smallest residual.