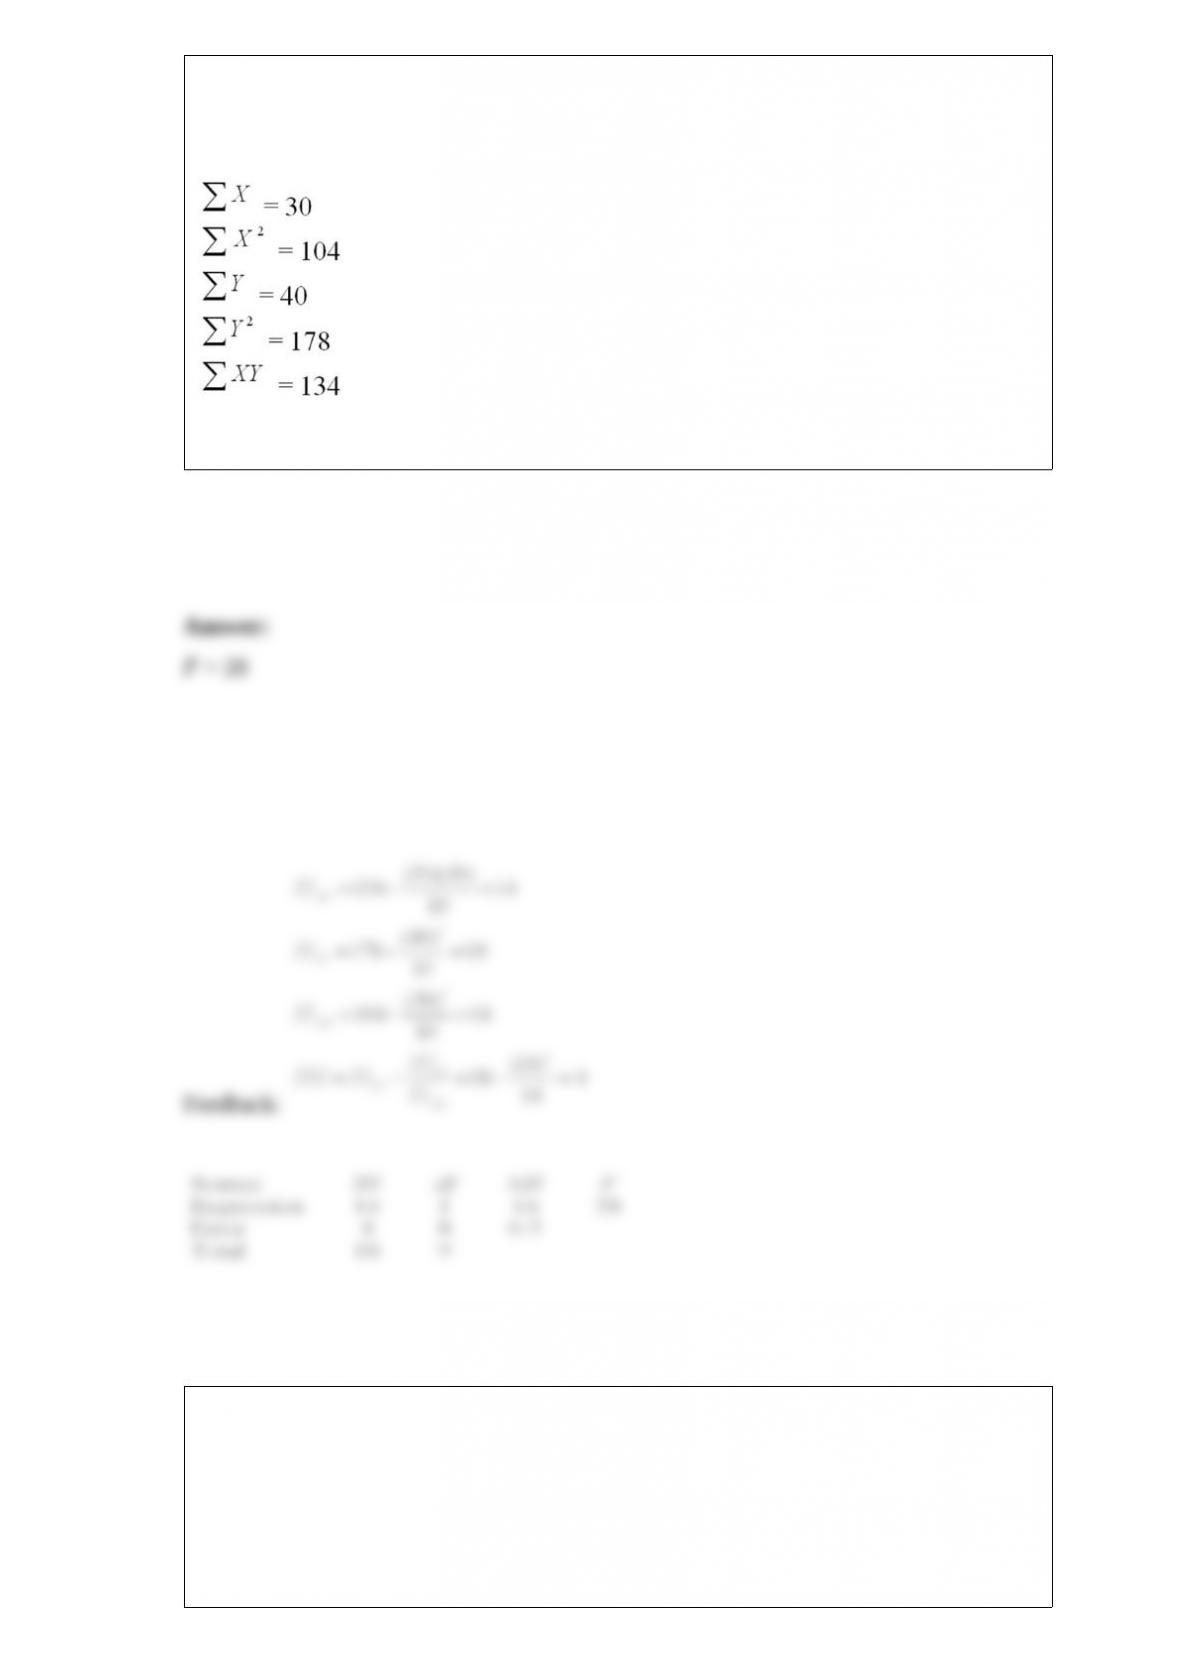
An experiment was performed on a certain metal to determine if the strength is a
function of heating time. Results based on 10 metal sheets are given below. Use the
simple linear regression model.
Determine the value of the F statistic.
The management of a professional baseball team is in the process of determining the
budget for next year. A major component of future revenue is attendance at the home
games. In order to predict attendance at home games, the team statistician has used a
multiple regression model with dummy variables. The model is of the form y = β0 +
β1x1 + β2x2 + β3x3 + ε, where:
y = attendance at a home game.
x1 = current power rating of the team on a scale from 0 to 100 before the game.
x2 and x3 are dummy variables, and they are defined below.
x2 = 1, if weekend,
x2 = 0, otherwise.
x3 = 1, if weather is favorable,
x3 = 0, otherwise.
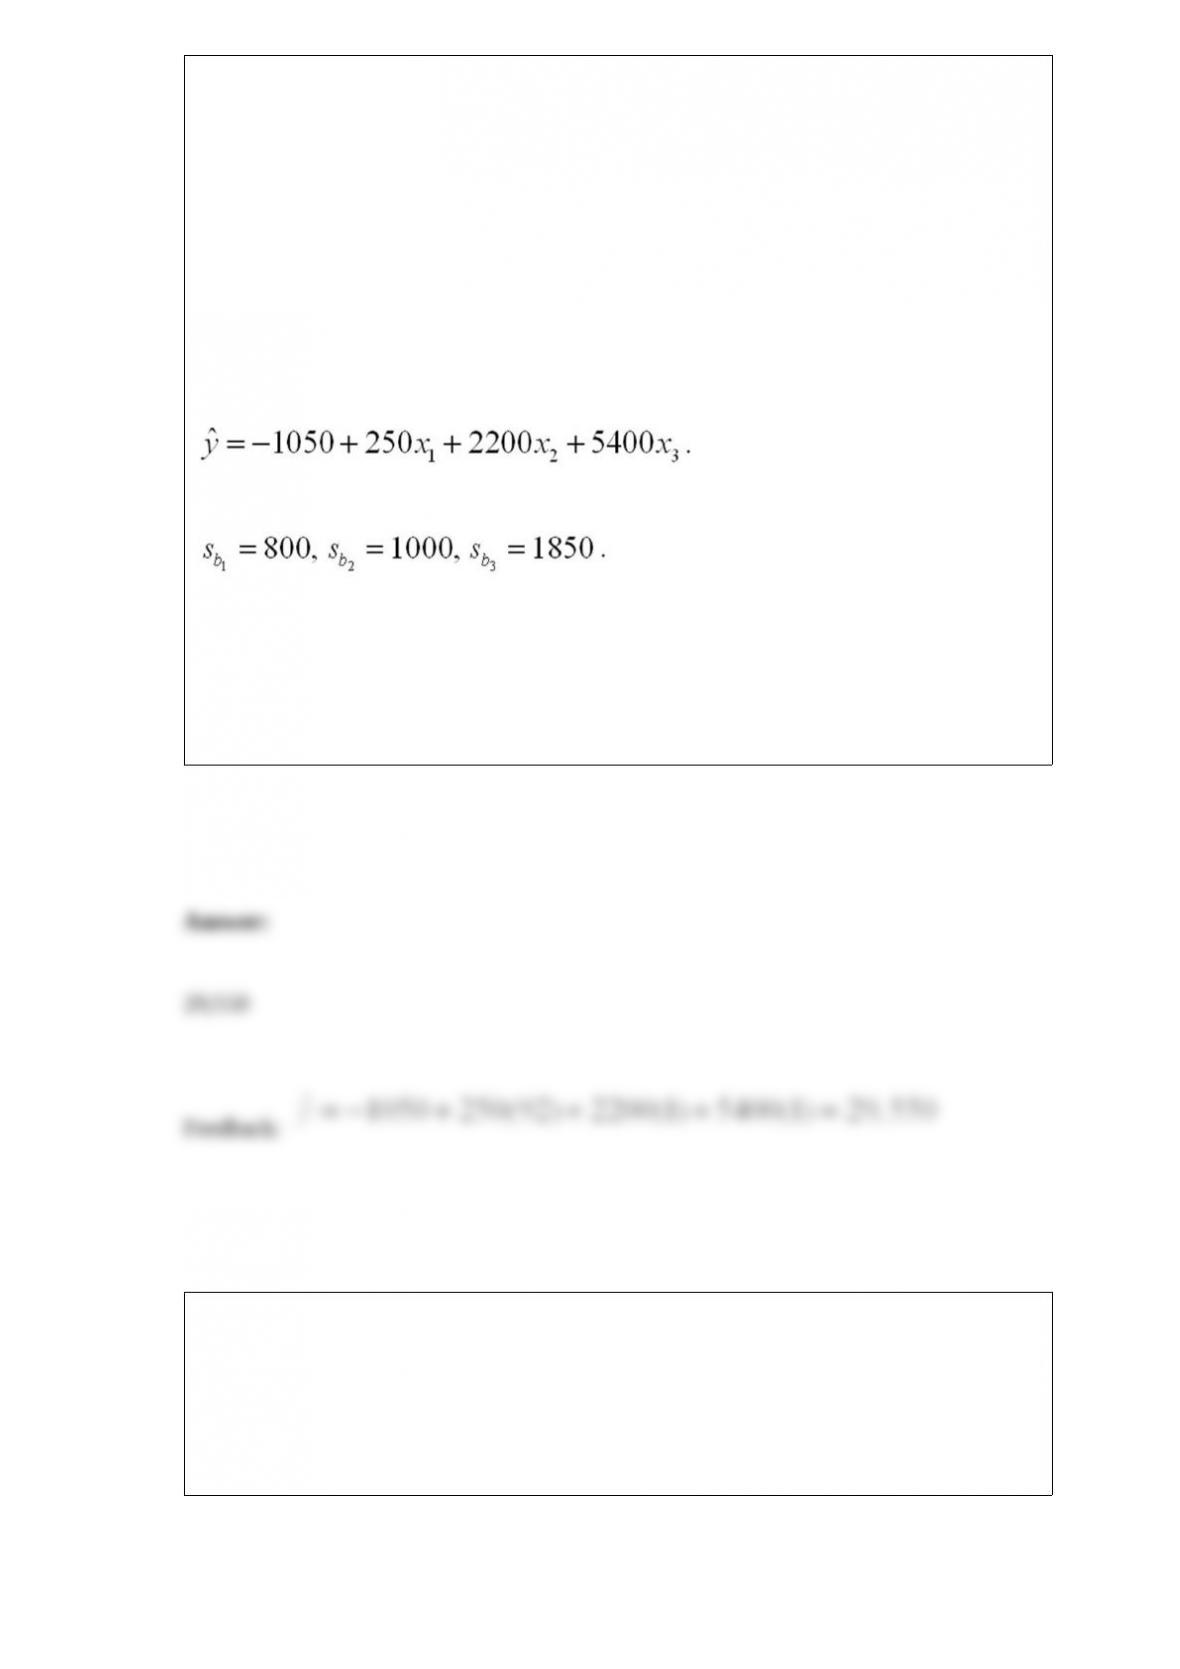
After collecting the data, based on 30 games from last year, and implementing the
above stated multiple regression model, the team statistician obtained the following
least squares multiple regression equation:
The multiple regression computer output also indicated the following:
Assume today is Saturday morning, the weather forecast indicates sunny, excellent
weather conditions for the rest of the day, and that the overall model is useful in
predicting the game attendance. Later today, there is a home baseball game for this
team. If the current power rating of the team is 92, use the model given above and
predict the attendance for today’s game.
Suppose you are a researcher investigating the annual sales differences among five
categories of businesses. Looking at a total of 55 companies equally divided among
categories groups A, B, C, D, and E.
Determine degrees of freedom treatment, degrees of freedom error and degrees of
freedom total and state the critical value of the F statistic at α = .05.
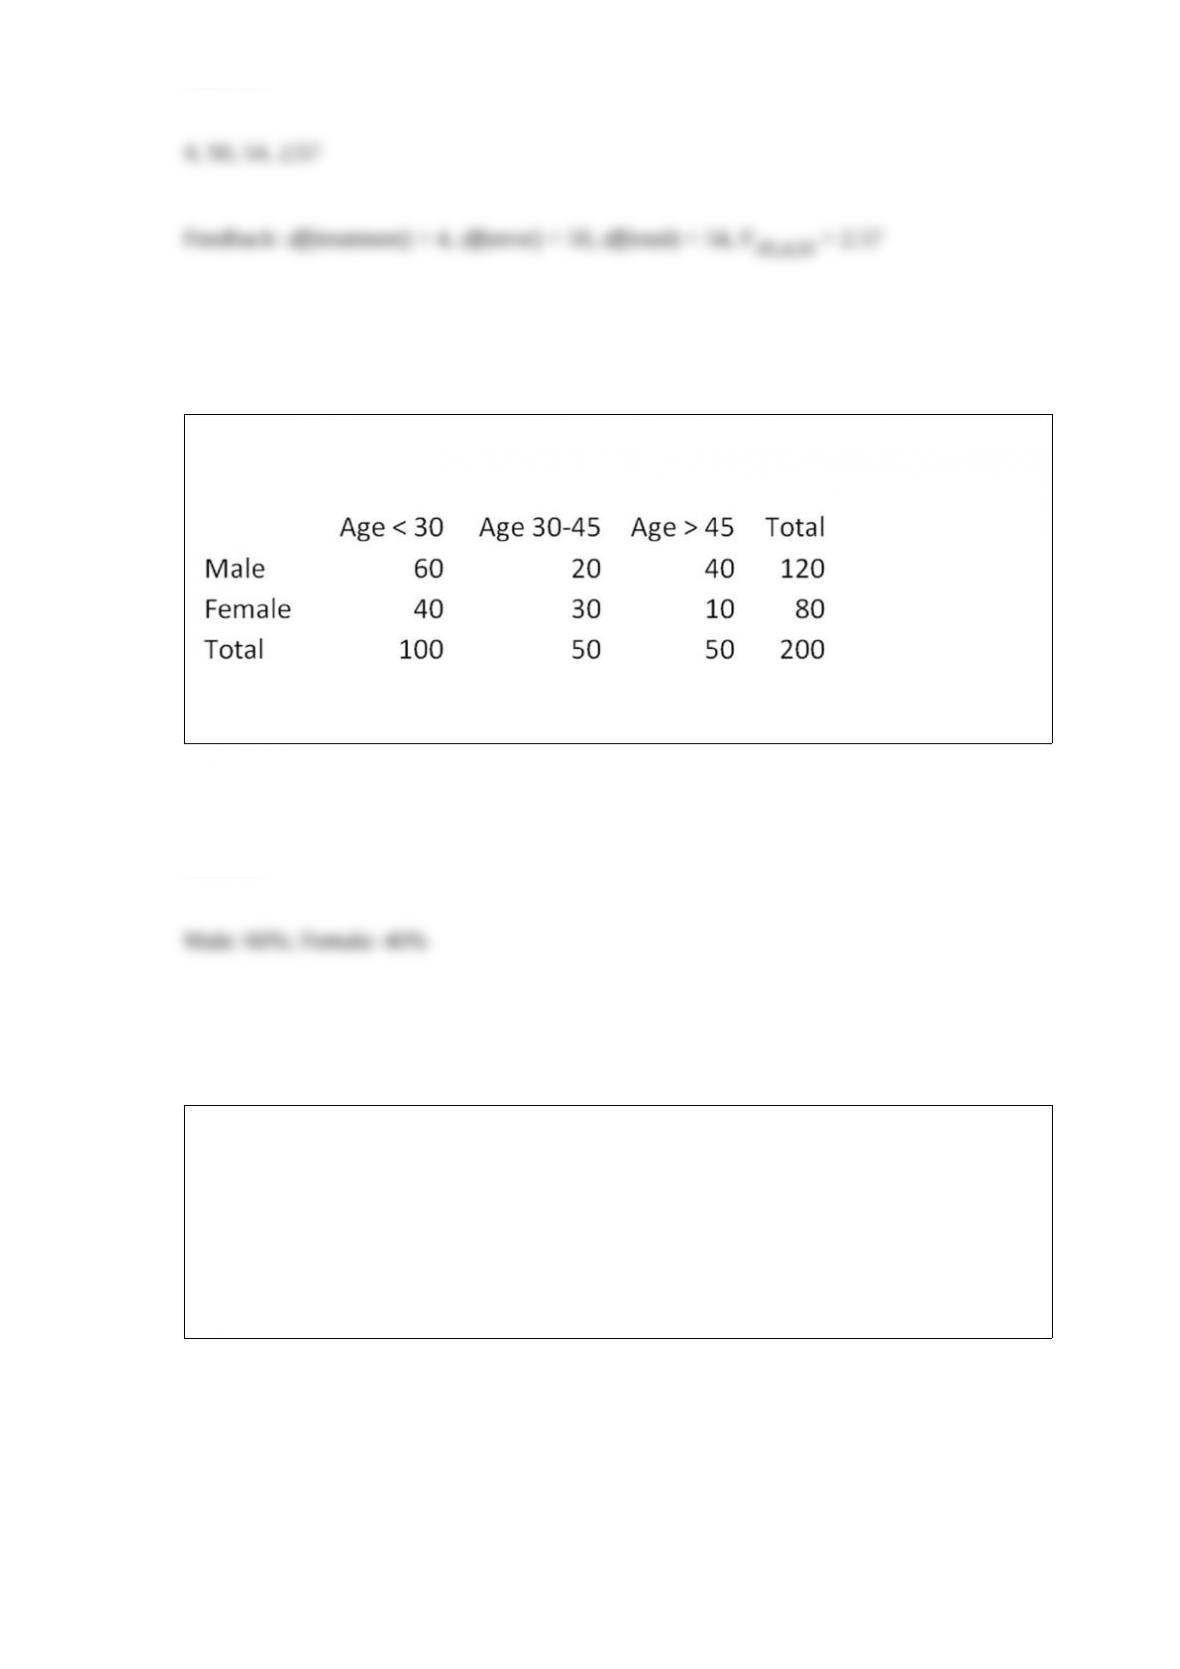
A survey was conducted on the age and gender of the purchasers of a specific
automotive model. The results are below.
For each row total, calculate the corresponding percentage.
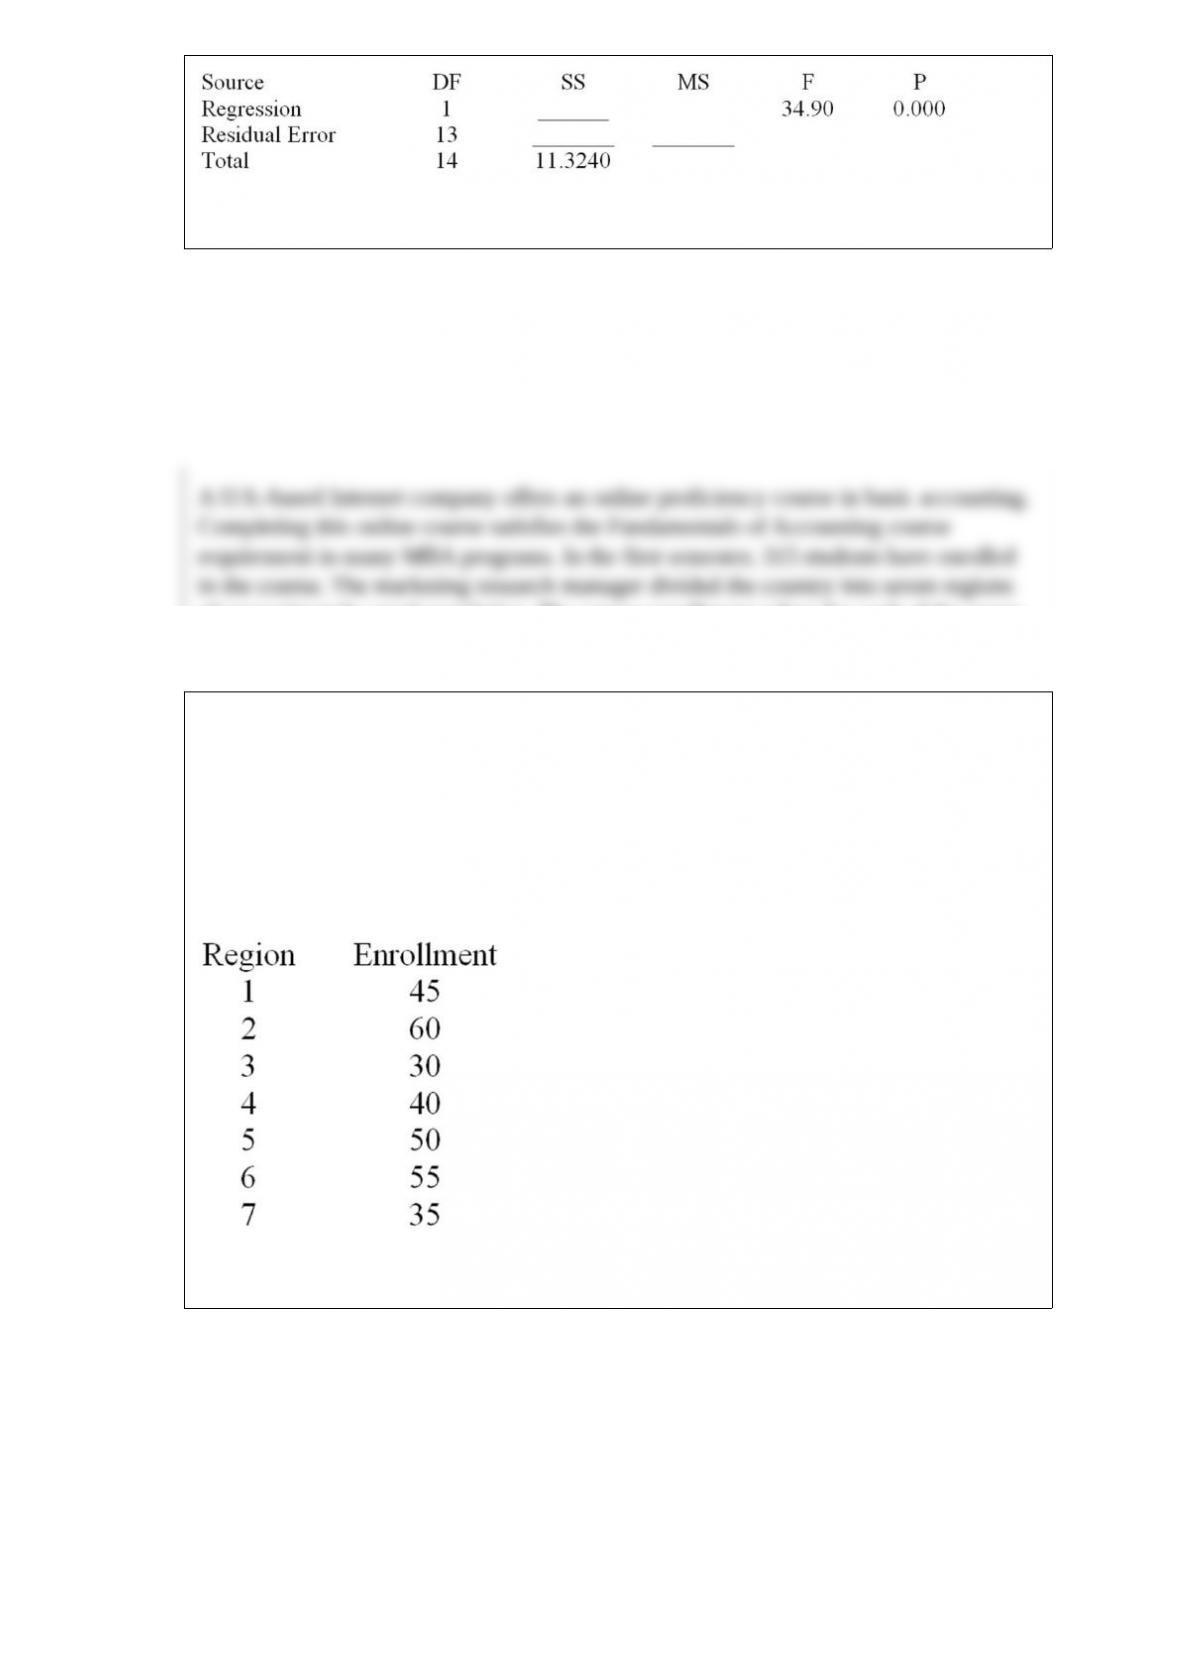
A U.S.-based Internet company offers an online proficiency course in basic accounting.
Completing this online course satisfies the Fundamentals of Accounting course
requirement in many MBA programs. In the first semester, 315 students have enrolled
in the course. The marketing research manager divided the country into seven regions
of approximately equal population. The course enrollment values for each of the seven
regions are given below. The management wants to know if there is equal interest in the
course across all regions.
At a significance level of .05, test H0: the probabilities are equal for all seven regions.
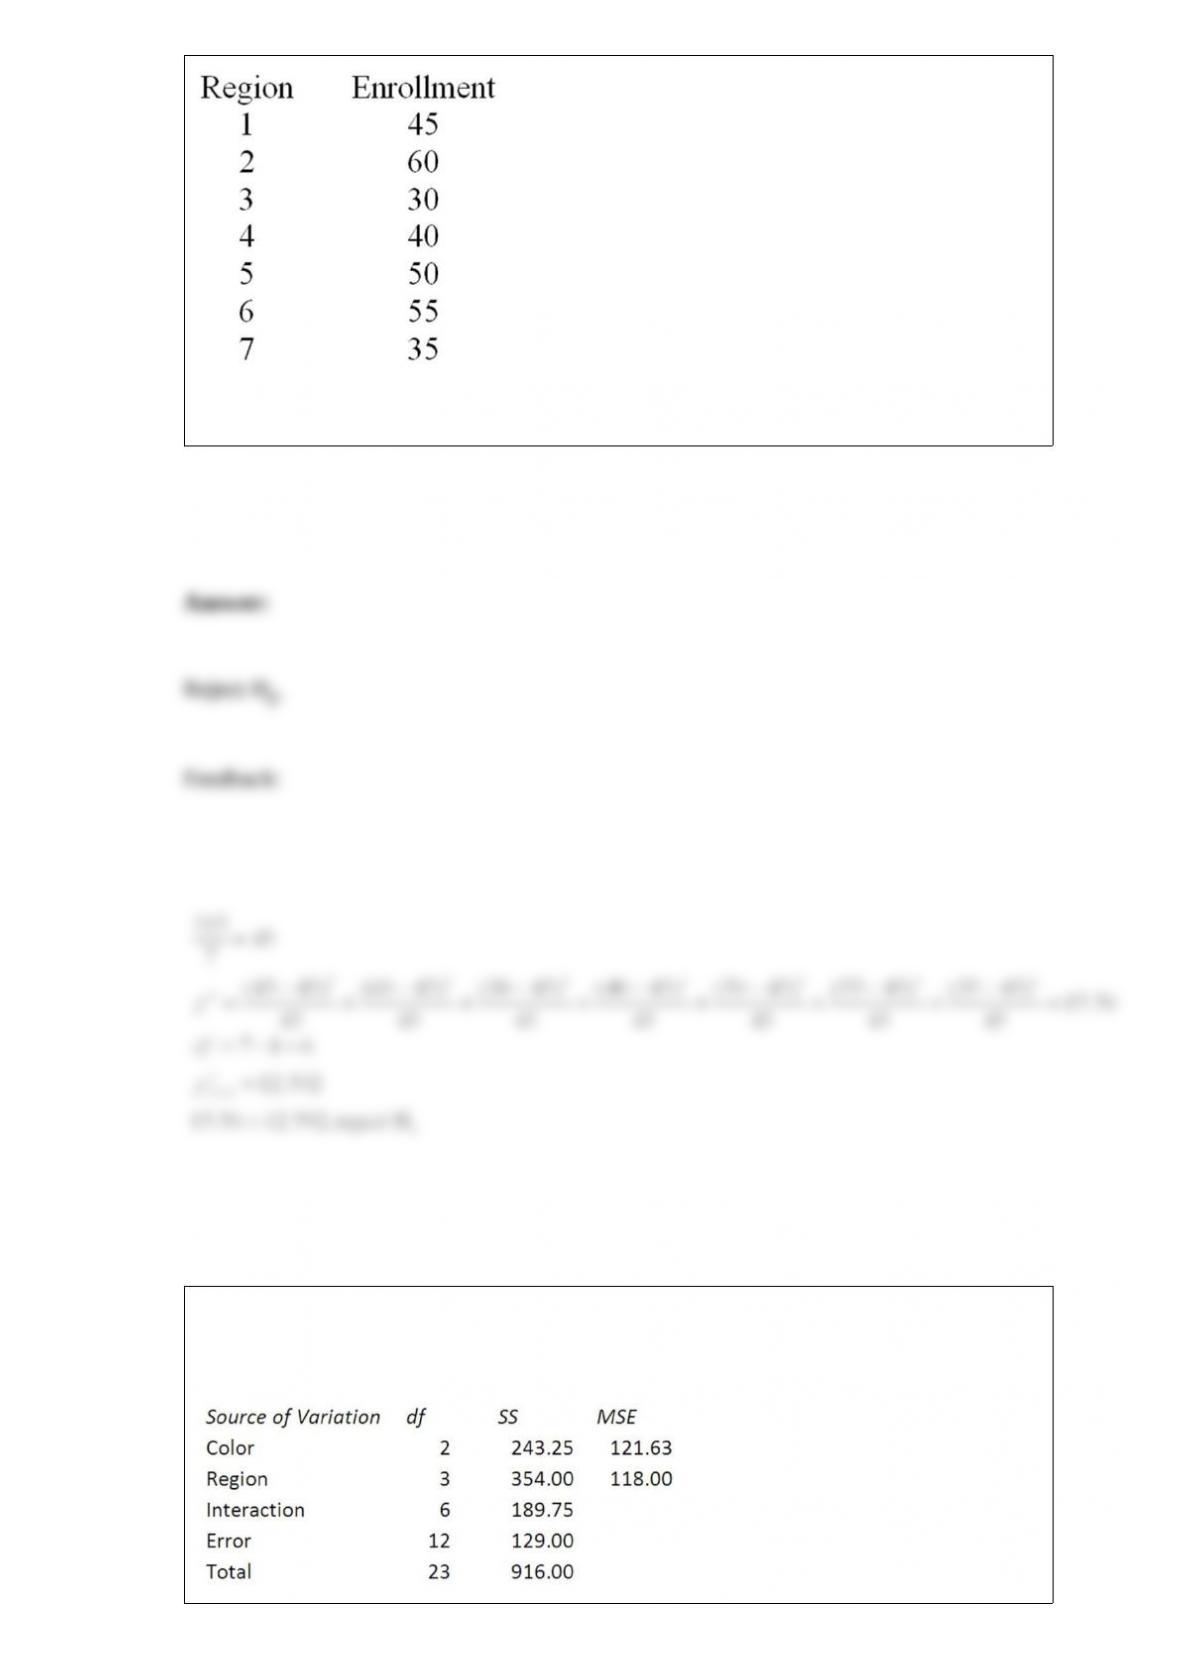
A vitamin-water manufacturer wants to compare the effects on sales of three water
colors: green, blue, and red. Four regions are selected for the test, with the following
ANOVA results.
Compute the mean square and F to test the null hypothesis that there is no interaction at
α = .01.
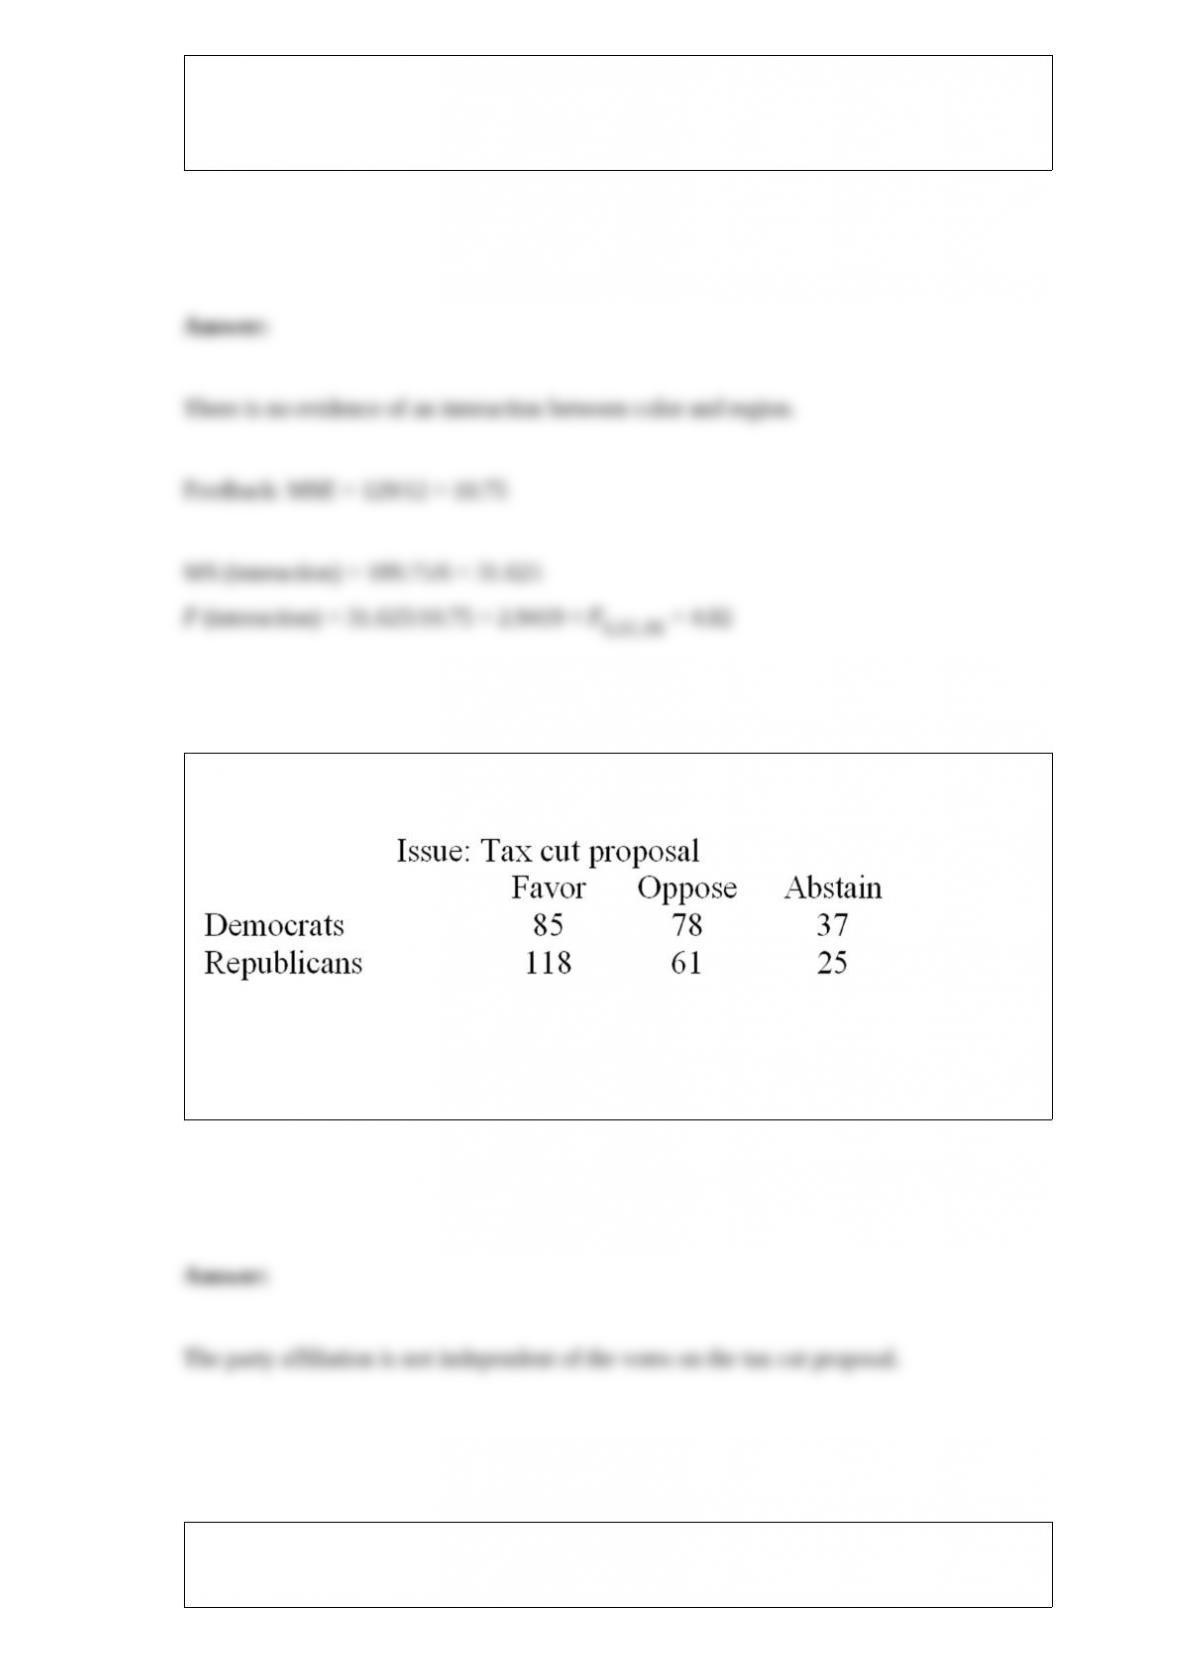
On the most recent tax cut proposal, a random sample of Democrats and Republicans in
the Congress cast their votes as follows:
Suppose that the chi-square test of independence is performed and the null hypothesis
(the vote on the issue and party affiliation are independent) is rejected. Provide a
one-sentence interpretation of the outcome of the test.
A U.S.-based Internet company offers an online proficiency course in basic accounting.
Completing this online course satisfies the Fundamentals of Accounting course
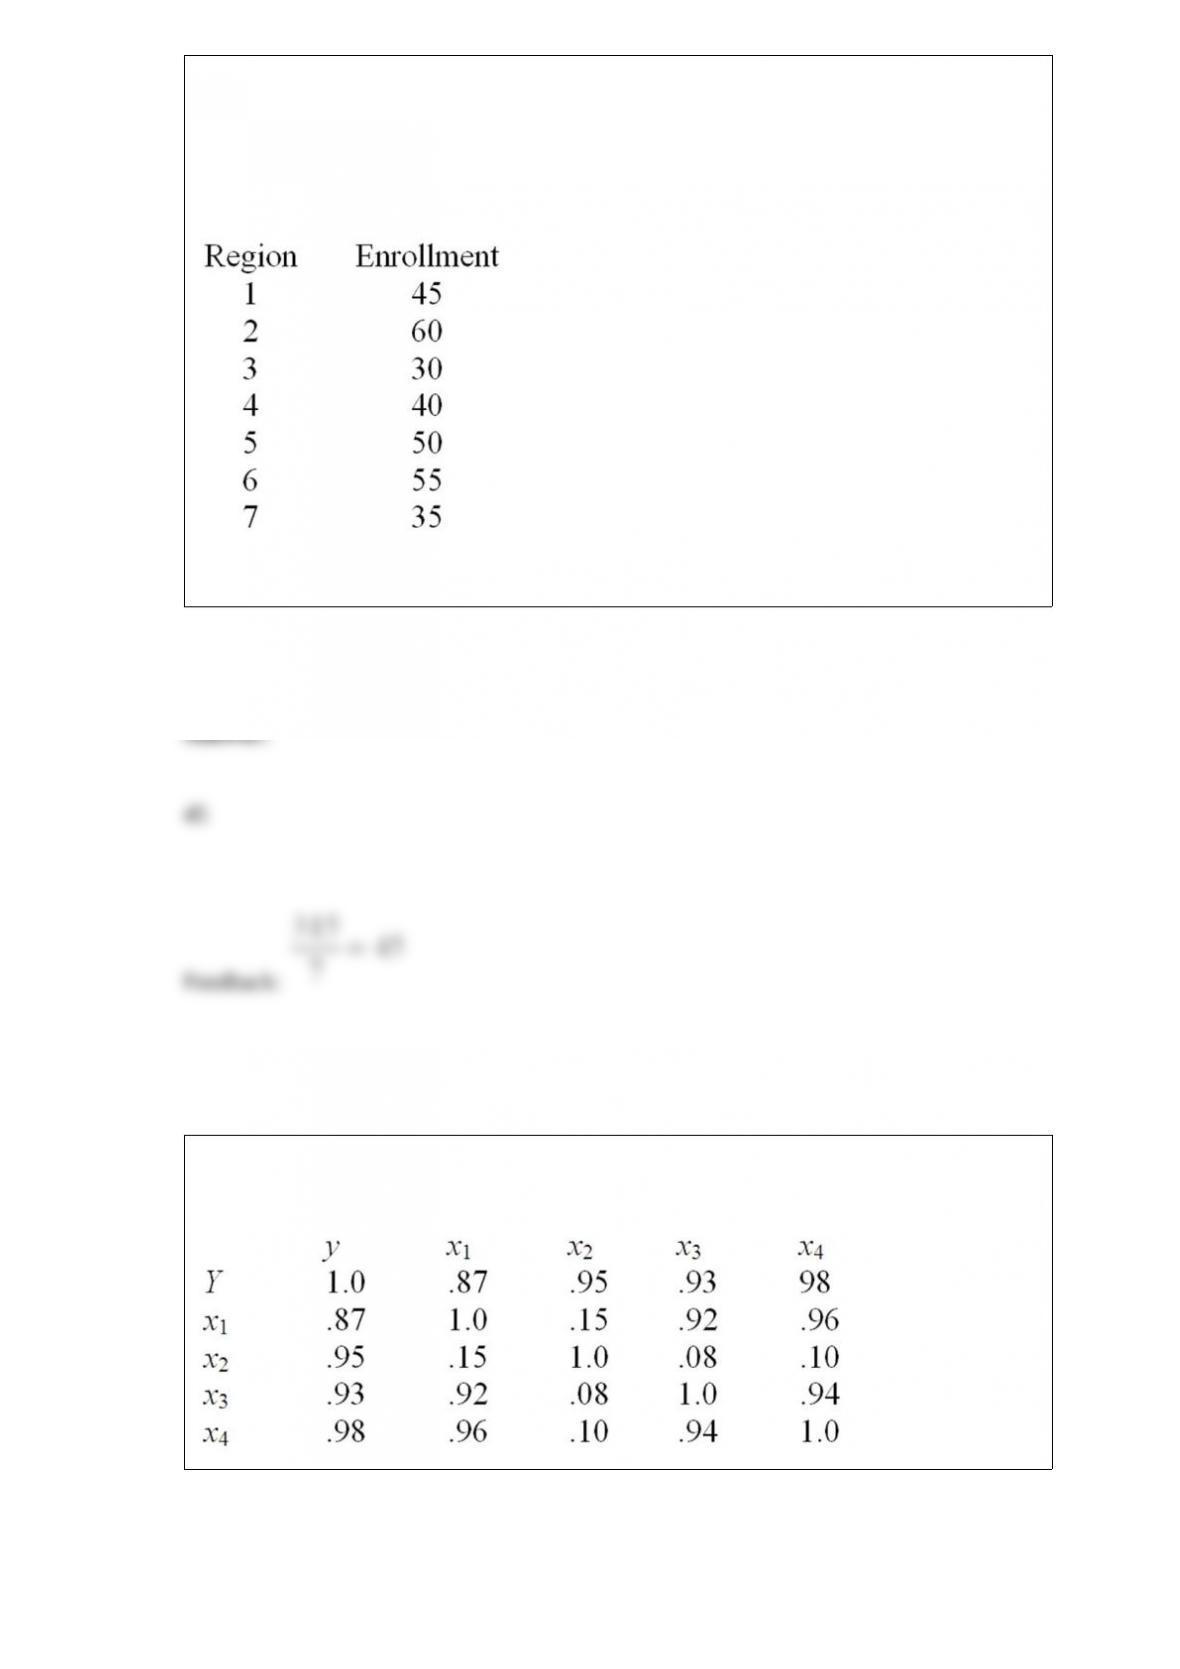
requirement in many MBA programs. In the first semester, 315 students have enrolled
in the course. The marketing research manager divided the country into seven regions
of approximately equal population. The course enrollment values for each of the seven
regions are given below. The management wants to know if there is equal interest in the
course across all regions.
Calculate the expected enrollment (frequency) for all 7 regions.
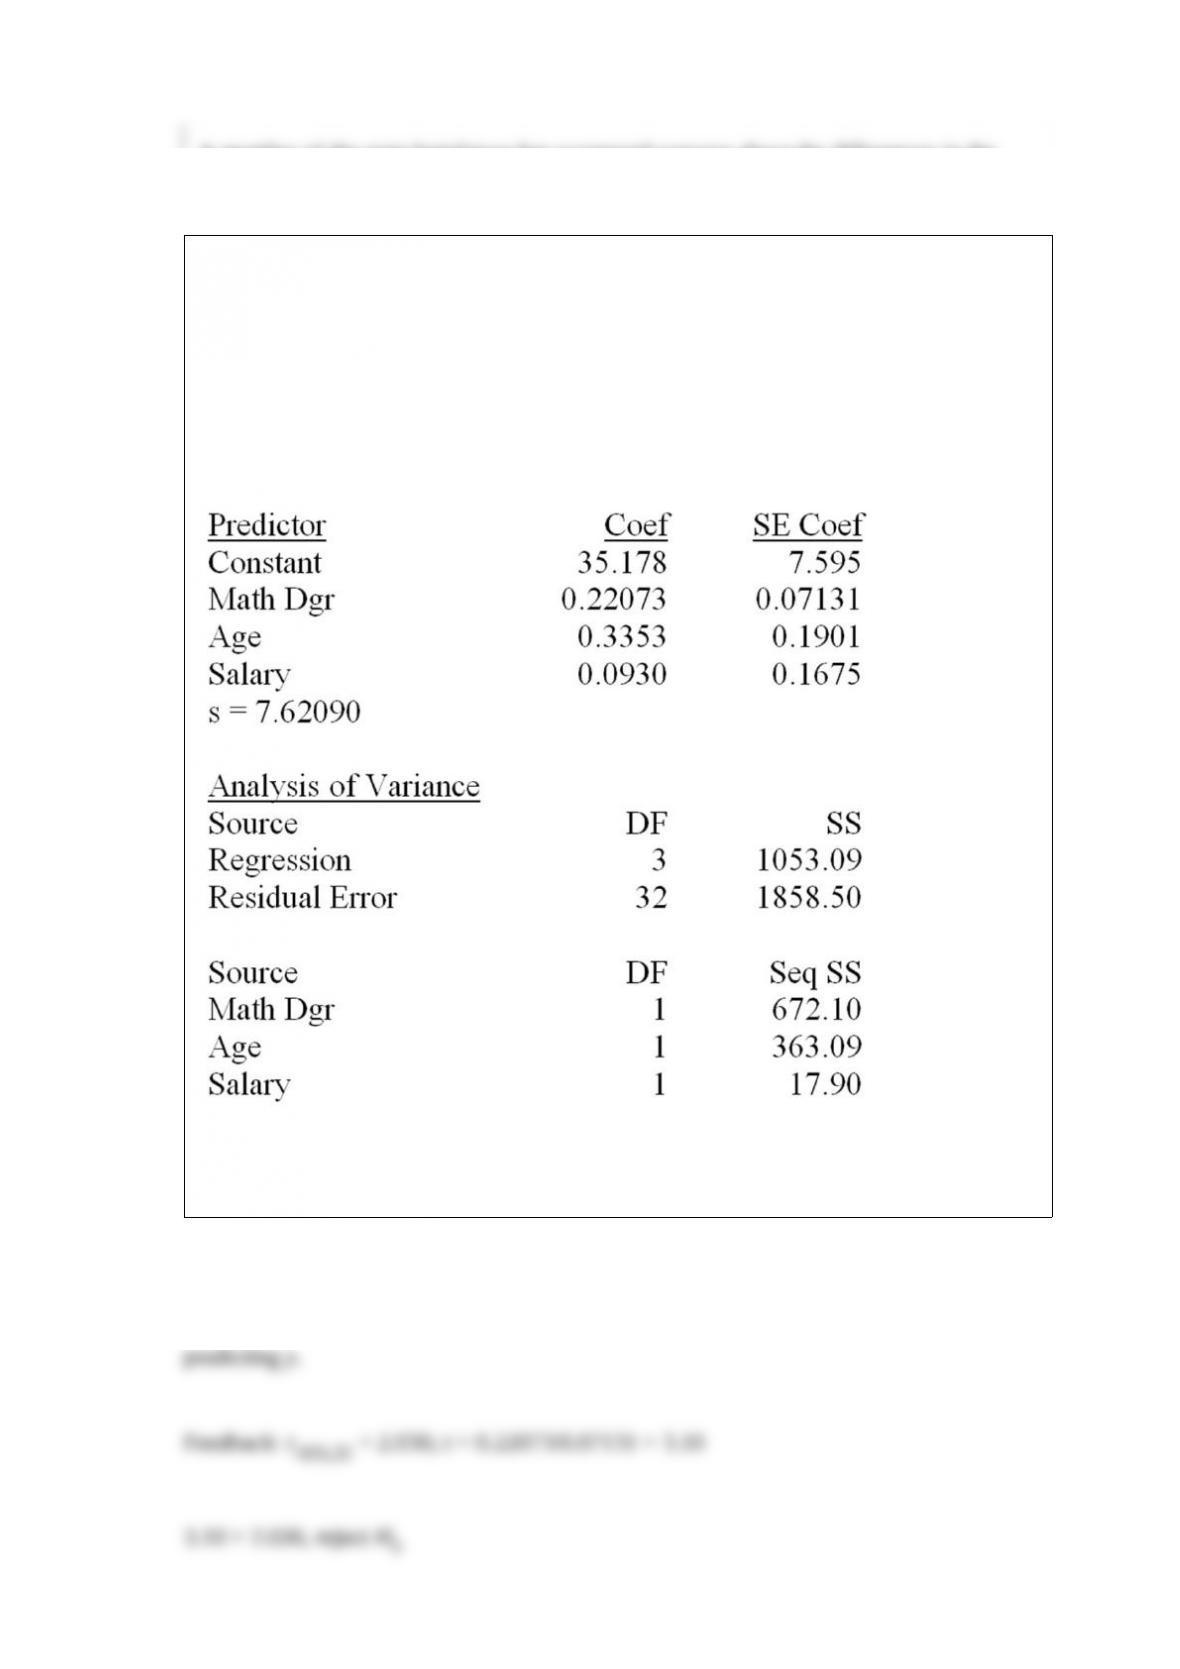
Use the following correlation matrix and determine the best multiple regression
prediction equation that has no significant multicollinearity.

An experiment was performed on a certain metal to determine if the strength is a
function of heating time. Results based on 10 metal sheets are given below.
Using the simple linear regression model, find the estimated y-intercept.
A human resource manager is interested in whether absences occur during the week
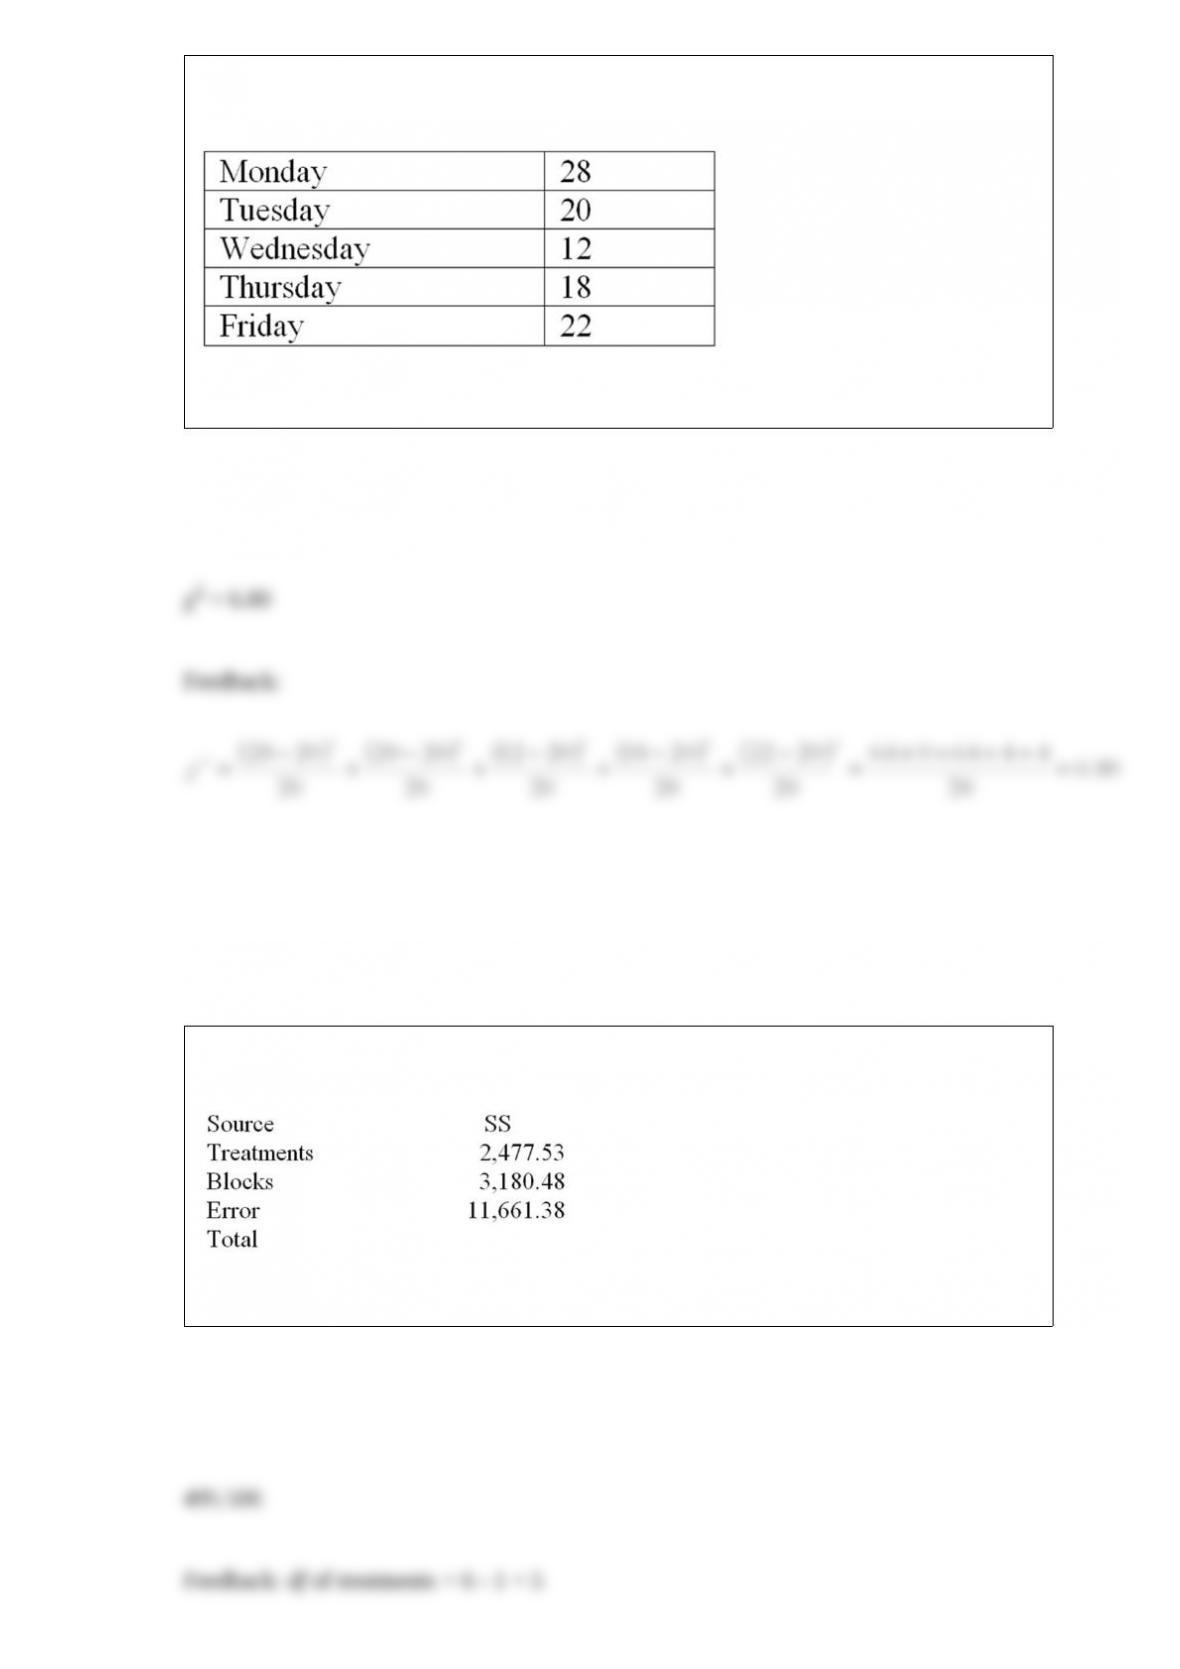
with equal frequency. The manager took a random sample of 100 absences and created
the following table:
Calculate the value of the chi-square statistic.
Consider the following partial analysis of variance table from a randomized block
design with 10 blocks and 6 treatments.
What is the treatment mean square?
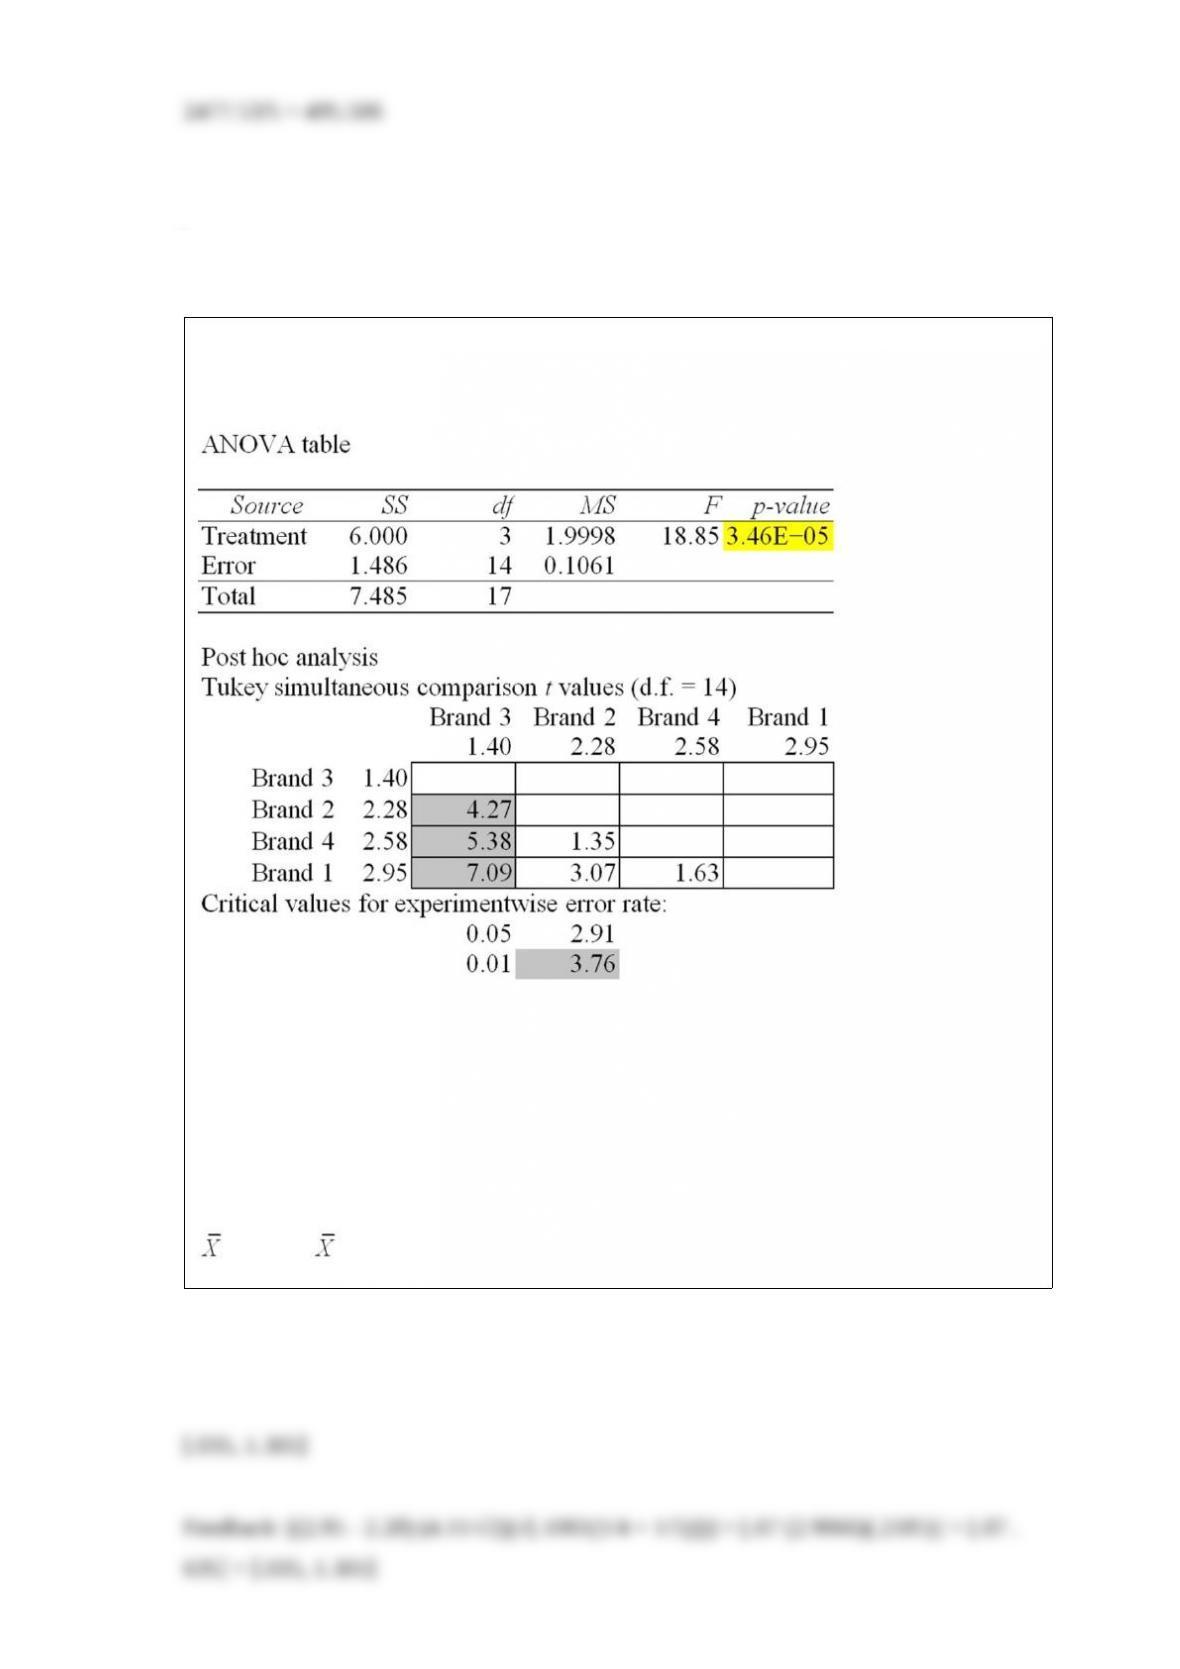
The Excel/Mega-Stat output given above summarizes the results of a one-way analysis
of variance in an attempt to compare the performance characteristics of four brands of
vacuum cleaners. The response variable is the amount of time it takes to clean a specific
size room with a specific amount of dirt.
Use the information above and determine a Tukey simultaneous 95 percent confidence
interval for μ1 – μ2. The mean and sample sizes for brand 1 and brand 2 are as follows:
1 = 2.95, 2 = 2.28, n1 = 4, and n2 = 5.
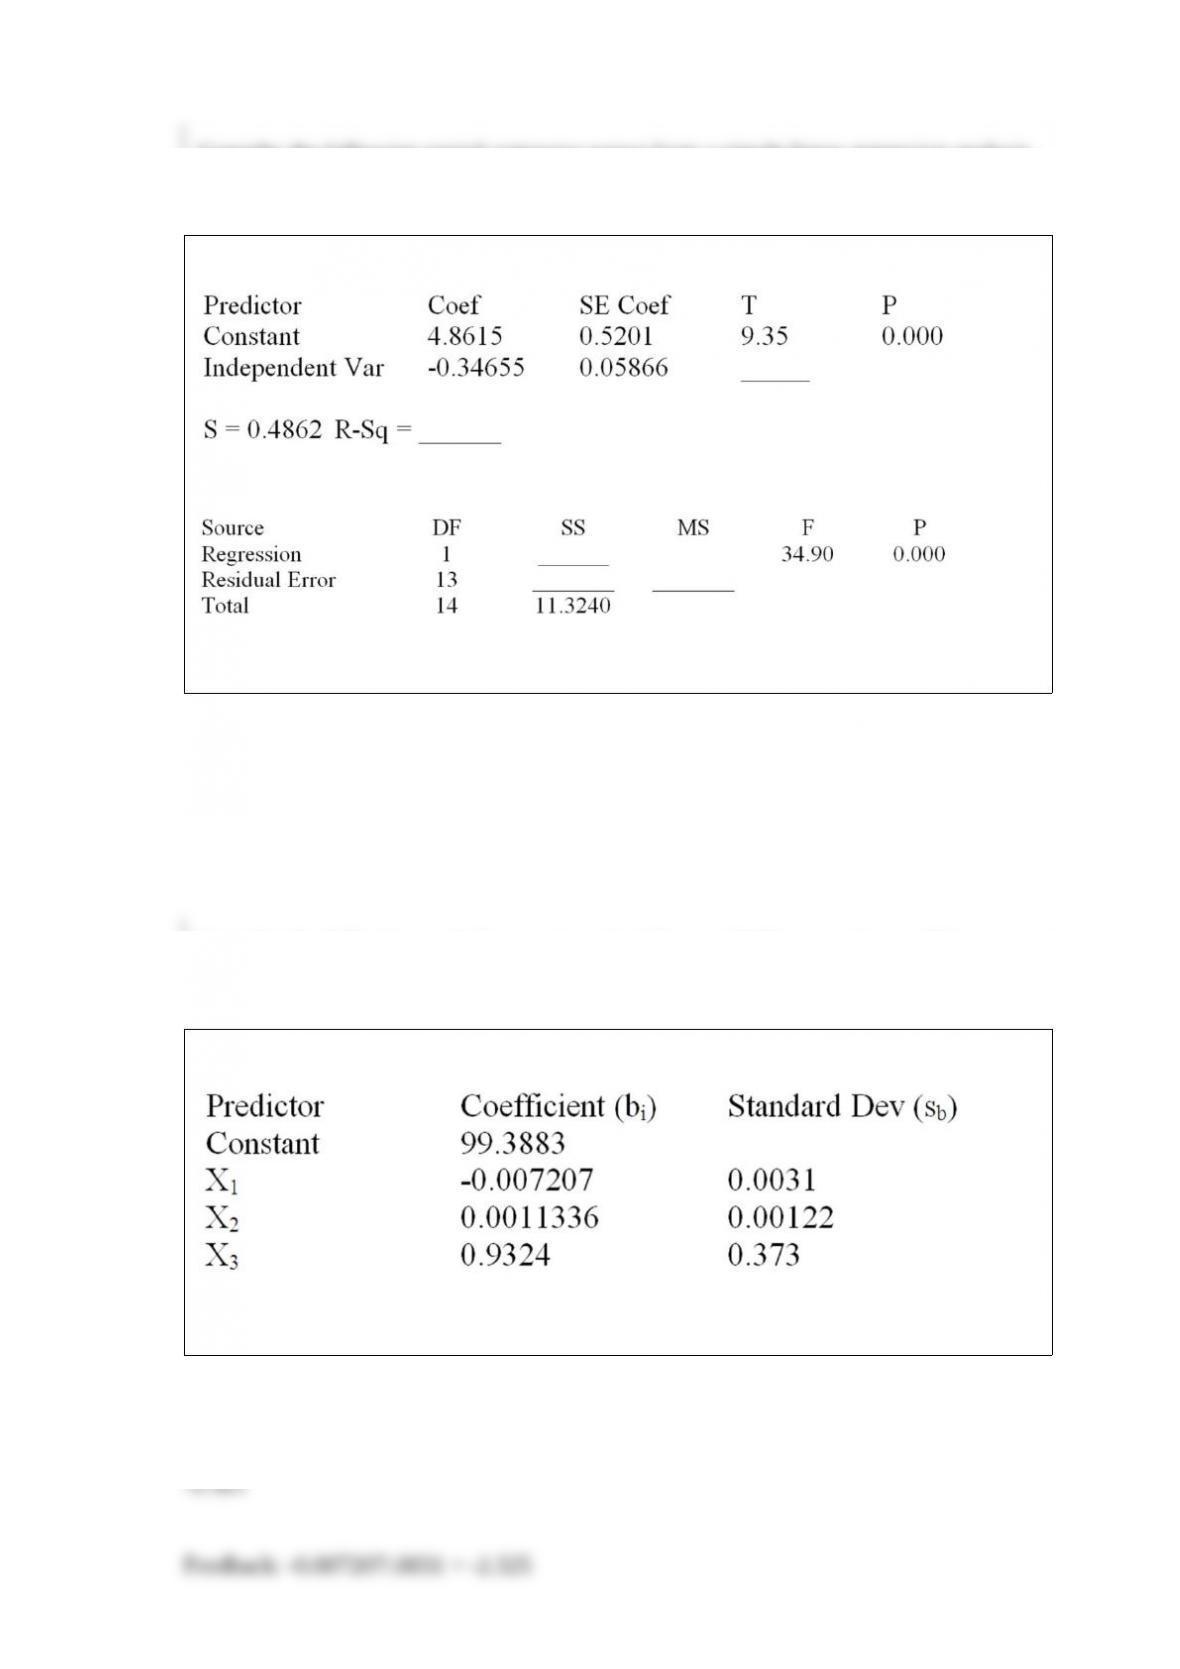
Consider the following partial computer output from a simple linear regression analysis.
Analysis of Variance
What is the estimated slope?
Consider the following partial computer output for a multiple regression model.
The calculated value of the t statistic for X1 is ________.
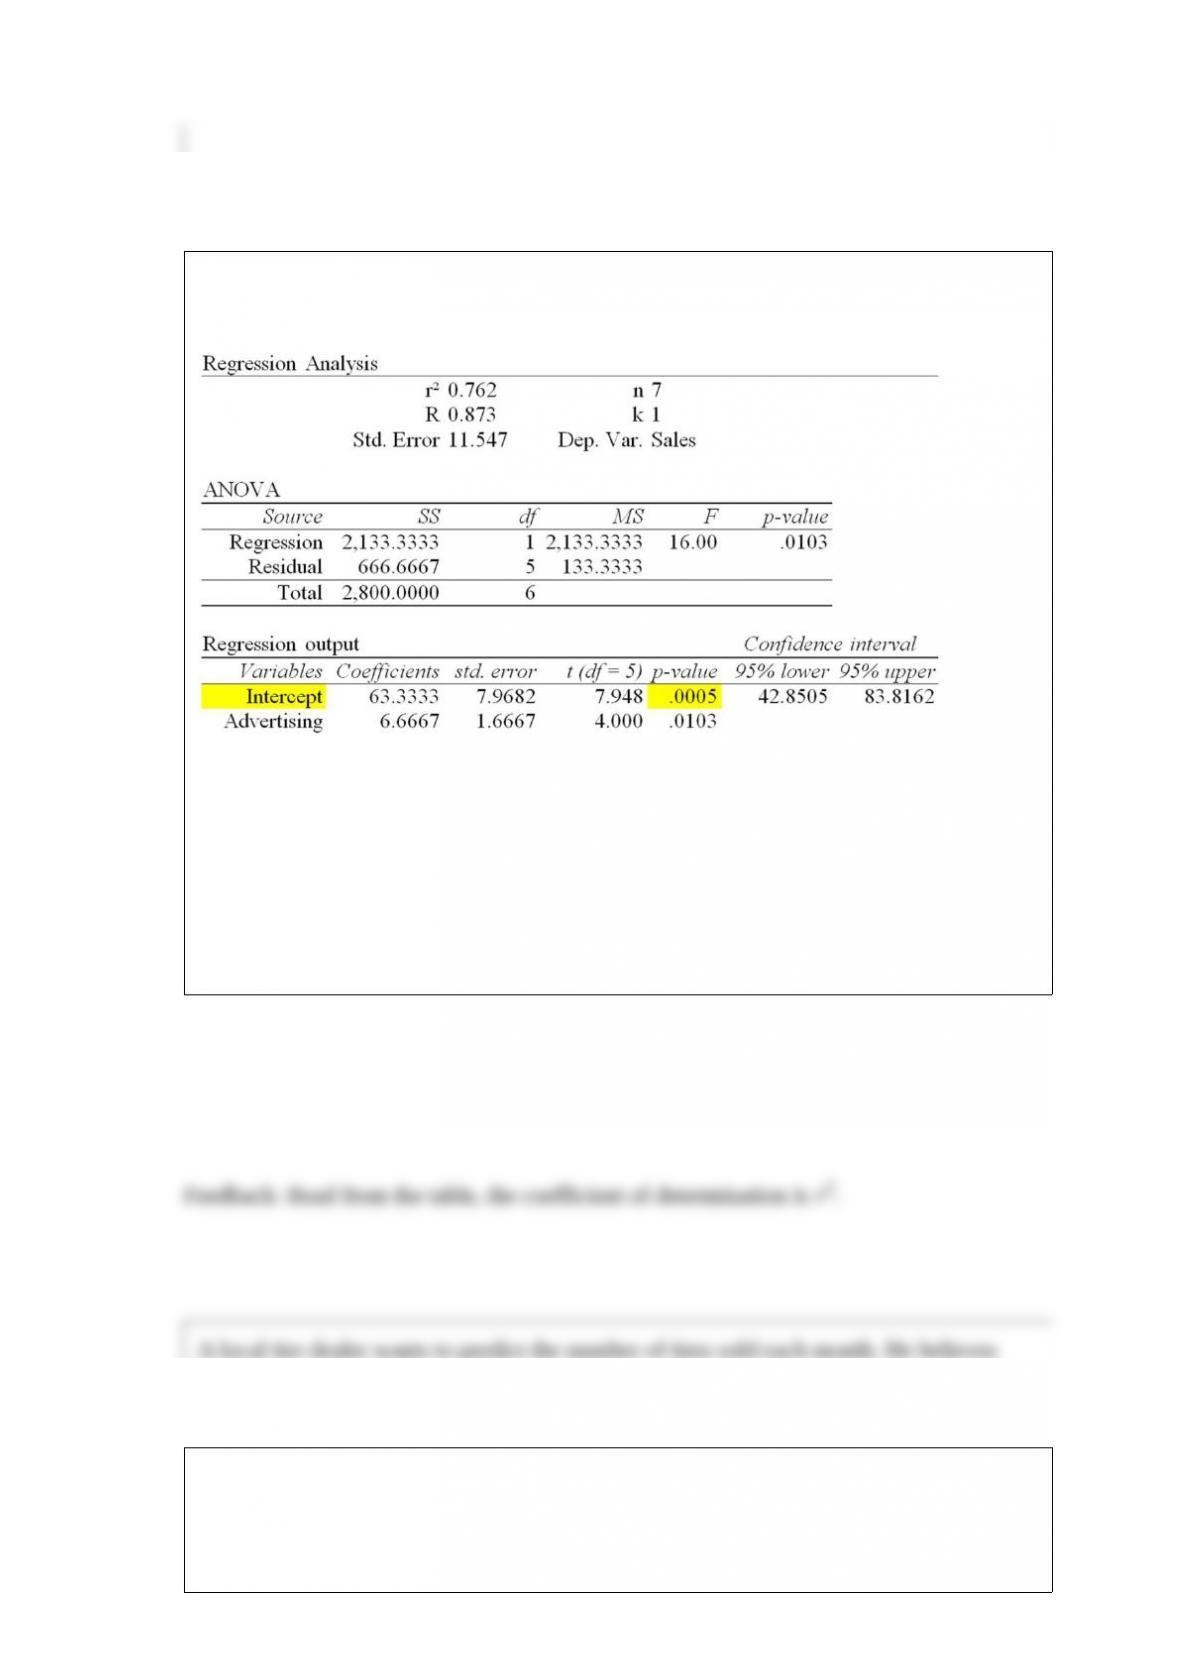
A member of the state legislature has expressed concern about the differences in the
mathematics test scores of high school freshmen across the state. She asks her research
assistant to conduct a study to investigate what factors could account for the
differences. The research assistant looks at a random sample of school districts across
the state and uses the factors of percentage of mathematics teachers in each district with
a degree in mathematics, the average age of mathematics teachers, and the average
salary of mathematics teachers.
Test the usefulness of variable x1 in the model at α = .05. Calculate the t statistic and
state your conclusions.
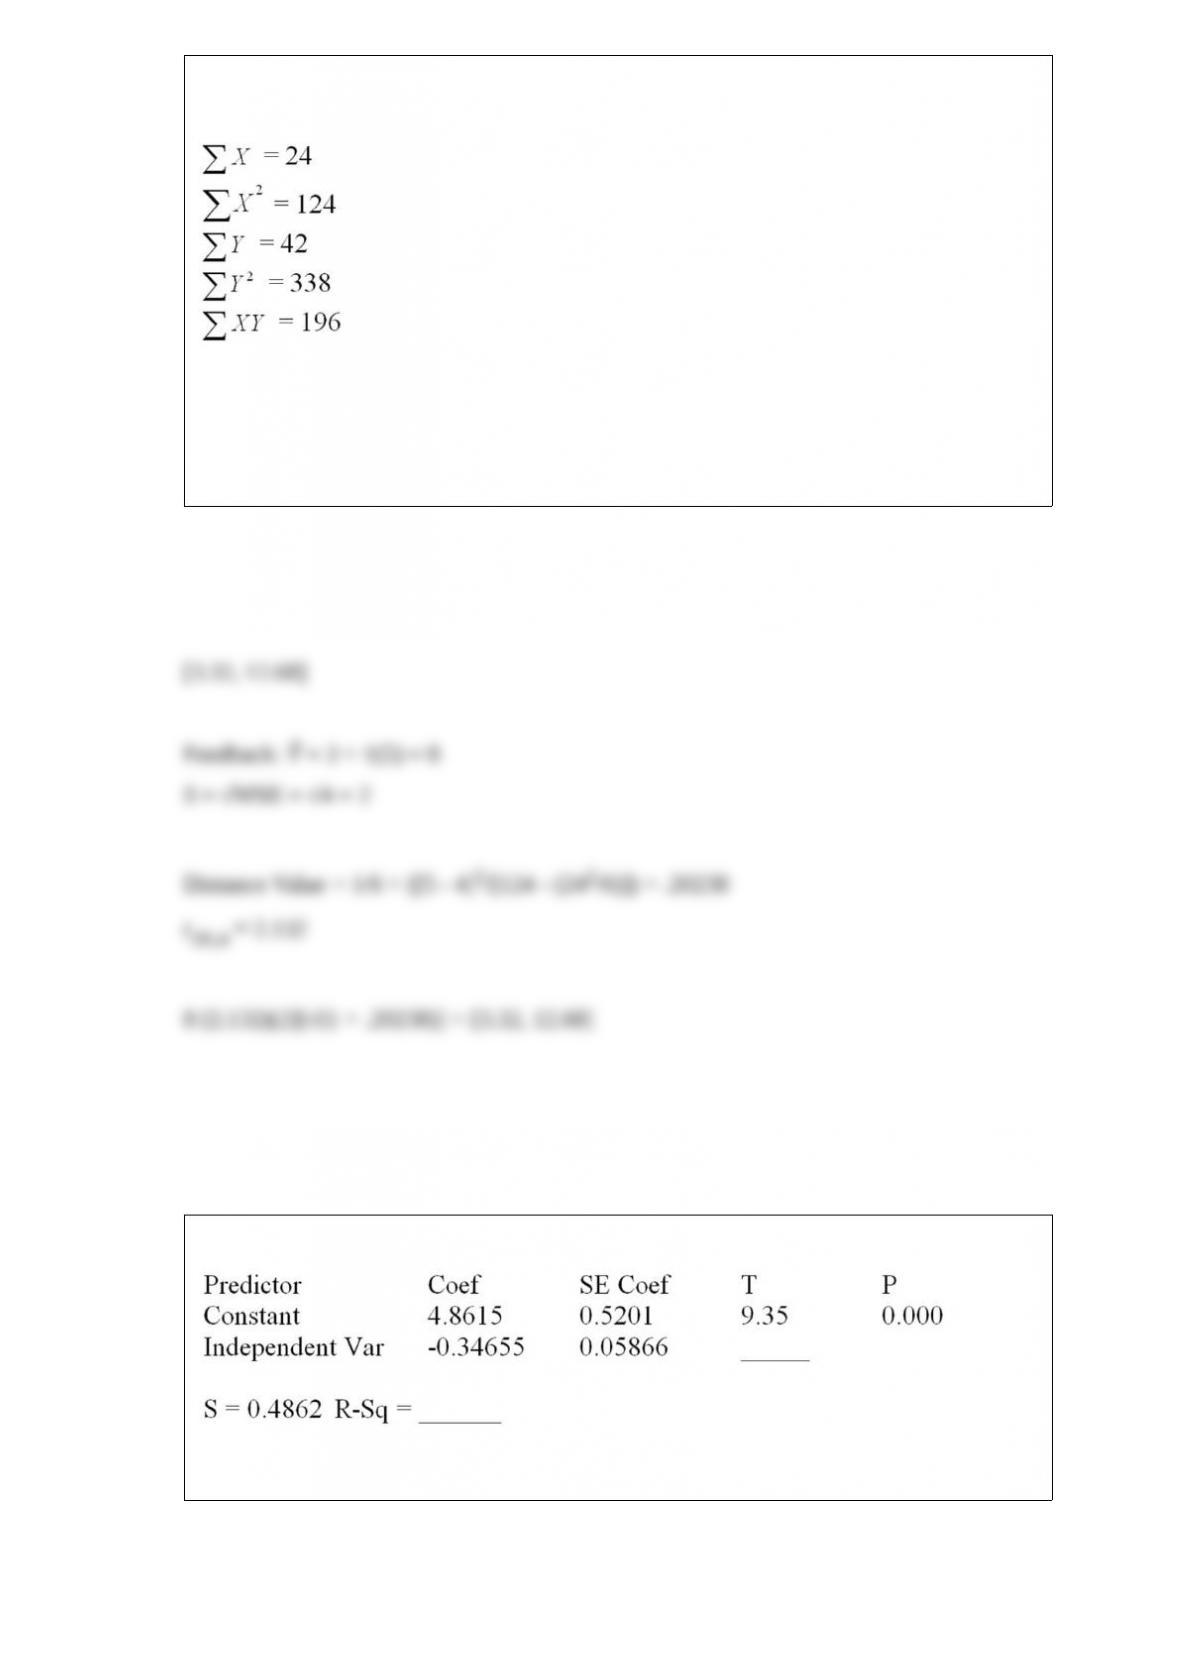
The local grocery store wants to predict its daily sales in dollars. The manager believes
that the amount of newspaper advertising significantly affects sales. He randomly
selects 7 days of data consisting of daily grocery store sales (in thousands of dollars)
and advertising expenditures (in thousands of dollars). The Excel/MegaStat output
given above summarizes the results of the regression model.
What is the value of the simple coefficient of determination?
A local tire dealer wants to predict the number of tires sold each month. He believes
that the number of tires sold is a linear function of the amount of money invested in
advertising. He randomly selects 6 months of data consisting of tire sales (in thousands
of tires) and advertising expenditures (in thousands of dollars). Based on the data set
with 6 observations, the simple linear regression equation of the least squares line is ŷ =
3 + 1x.
MSE = 4
Using the sums of the squares given above, determine the 90 percent prediction interval
for tire sales in a month when the advertising expenditure is $5000.
Consider the following partial computer output from a simple linear regression analysis.
Analysis of Variance
What is the predicted value of y when x = 9.00?
A U.S.-based Internet company offers an online proficiency course in basic accounting.
Completing this online course satisfies the Fundamentals of Accounting course
requirement in many MBA programs. In the first semester, 315 students have enrolled
in the course. The marketing research manager divided the country into seven regions
of approximately equal population. The course enrollment values for each of the seven
regions are given below. The management wants to know if there is equal interest in the
course across all regions.
Calculate the value of the chi-square statistic.