When using and R charts to analyze and improve a process, first, the chart is
analyzed and the necessary action(s) to correct assignable causes of variation is (are)
taken before the R chart is analyzed.
In a regression model, at any given combination of values of the independent variables,
the population of potential error terms is assumed to have an F distribution.
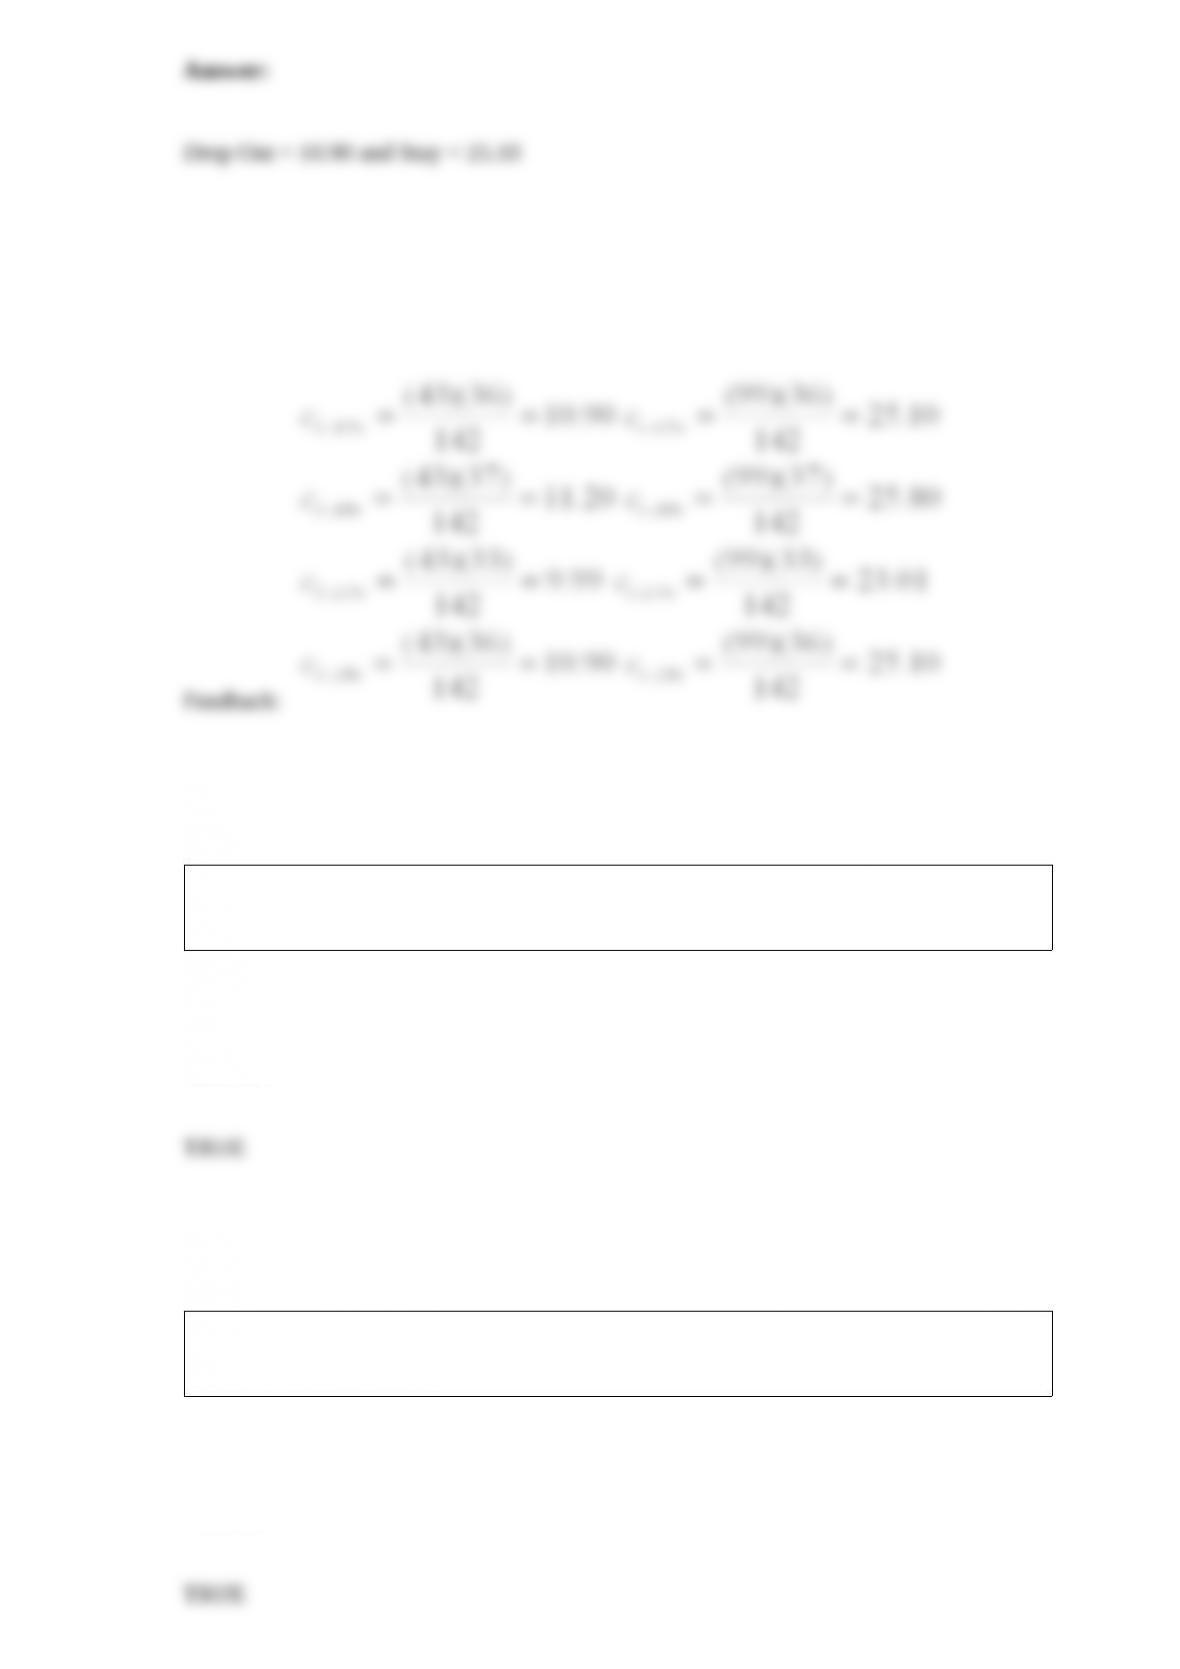
At a recent meeting of educational researchers, comparisons were made between the
type of college that freshmen attend and the numbers who drop out. A random sample
of freshmen shows the following results:
Determine the expected frequencies for the two cells of 4-year public institutions that
will be used in the chi-square test of independence.
A partial F test is used to assess when at least one variable in a subset of squared and
interaction variables in the multiple regression model is significant.
If a process is stable and in statistical control, it is not influenced by assignable causes
of variation.

The multiple correlation coefficient can assume any value between zero and 1,
inclusive.
When employing measurement data to study a process, the __________ monitors the
process variation.
A.
B. R chart
C. p chart
D. Natural tolerance
E. Pattern analysis
A control chart on which subgroup ranges are plotted versus time is a(n) _____ chart.
A.

B. R
C. p
D. C
Dummy or indicator variables typically are values of zero or one, and are used to model
the effects of different levels of ___________ variables.
A. Qualitative
B. Quantitative
C. Ratio
D. Measured
The χ2 statistic from a contingency table with 6 rows and 5 columns will have:
A. 30 degrees of freedom.
B. 24 degrees of freedom.
C. 5 degrees of freedom.
D. 20 degrees of freedom.
E. 25 degrees of freedom.

A(n) ____________ process has the ability to produce products or services that meet
customer requirements.
A. in-control
B. assignable
C. capable
D. statistical
Plotting the residuals in a time-ordered sequence will reveal possible violations of the
__________ of error terms assumption.
A. Normality
B. Independence
C. Constant variation
D. Residual sum
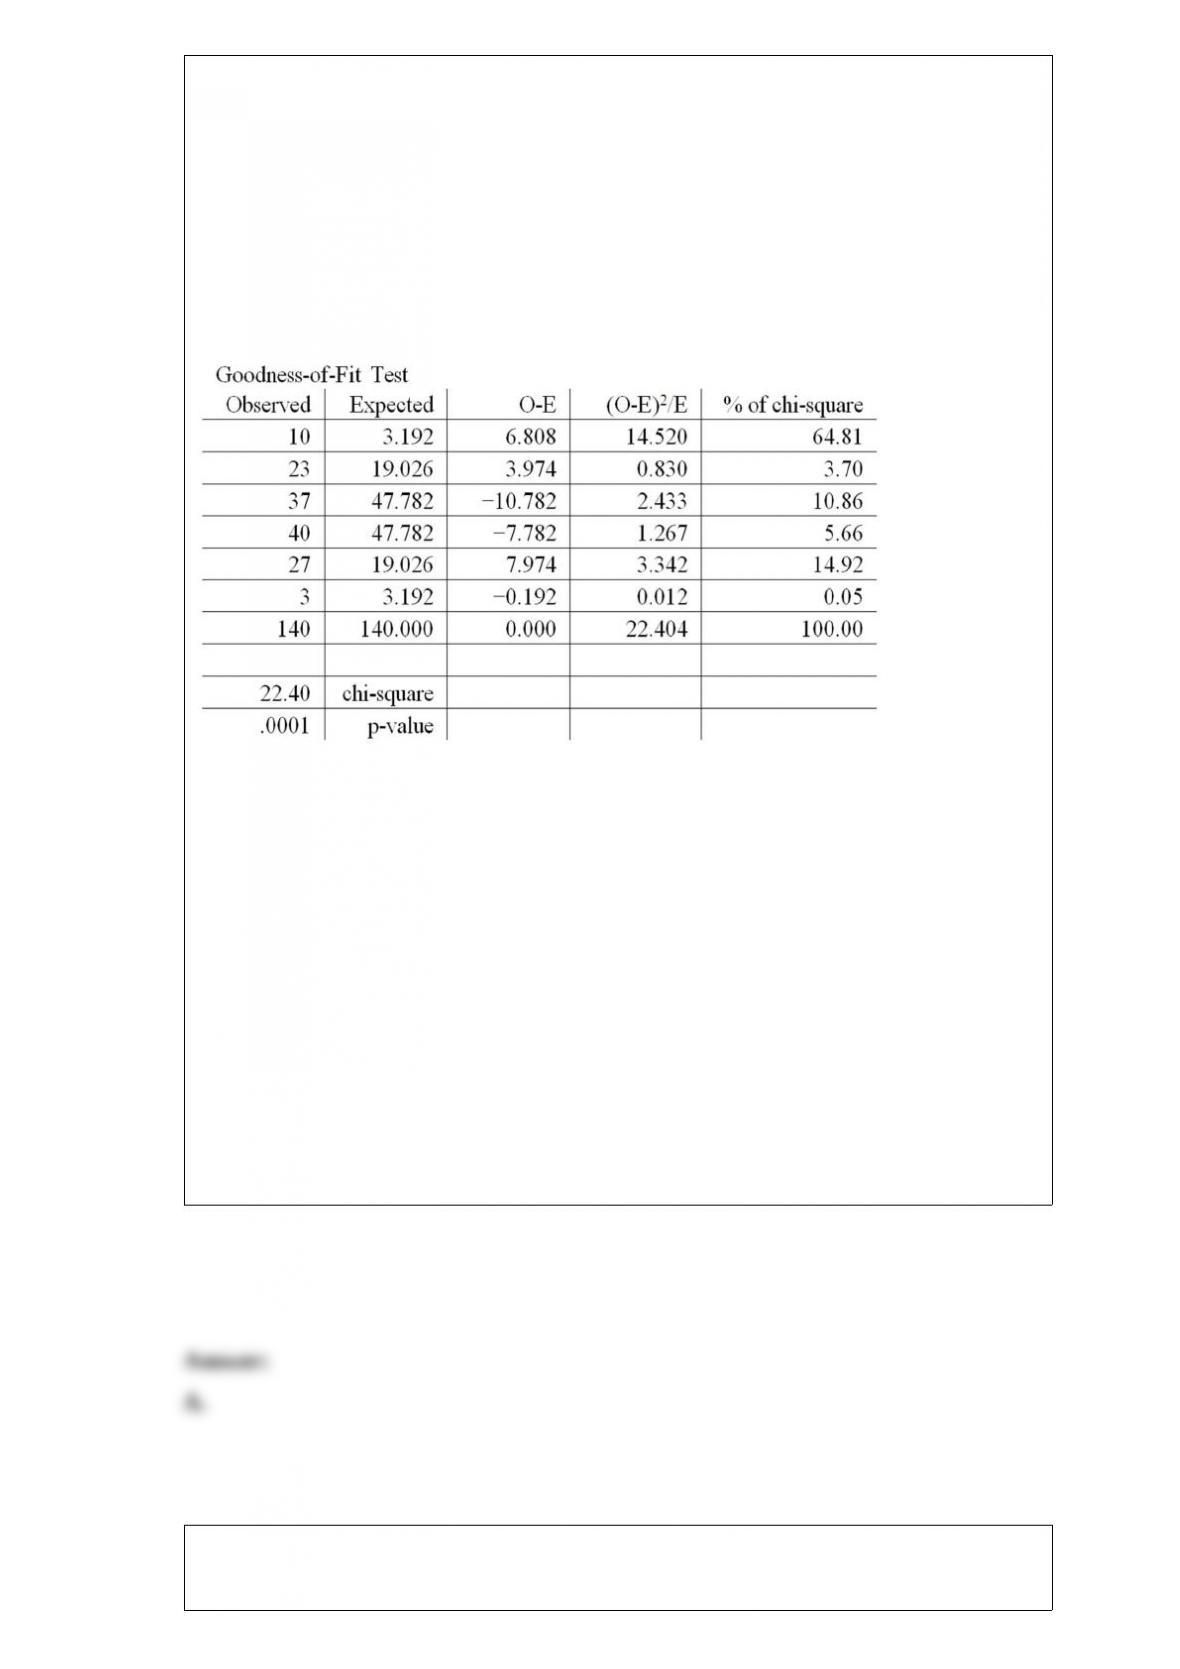
A real estate company is analyzing the selling prices of residential homes in a given
community. 140 homes that have been sold in the past month are randomly selected and
their selling prices are recorded. The statistician working on the project has stated that
in order to perform various statistical tests, the data must be distributed according to a
normal distribution. In order to determine whether the selling prices of homes included
in the random sample are normally distributed, the statistician divides the data into 6
classes of equal size and records the number of observations in each class. She then
performs a chi-square goodness-of-fit test for normal distribution. The results are
summarized in the following table.
What is the appropriate null hypothesis?
A. H0: The residential home selling prices are distributed according to a normal
distribution.
B. H0: The residential home selling prices are not distributed according to a normal
distribution.
C. H0: The distribution of residential home selling prices is either right or left skewed.
D. H0: The distribution of the residential home selling prices is symmetric.
E. None of these is correct.
The simple linear regression (least squares method) minimizes:

A. The explained variation.
B. SSyy.
C. Total variation.
D. SSxx.
E. SSE.
Sources of process variations that are inherent to the process design are called
___________ causes of variation.
A. common
B. assignable
C. unusual
D. expected
The _________ regression method is used when the response variable is a qualitative or
a categorical variable.
A. Quadratic
B. Logistic
C. Multiple

D. Simple
When we carry out a chi-square test of independence, the alternate hypothesis states
that the two relevant classifications:
A. Are mutually exclusive.
B. Form a contingency table with r rows and c columns.
C. Have (r – 1)(c – 1) degrees of freedom.
D. Are statistically dependent.
E. Are normally distributed.
In simple regression analysis, the standard error is ___________ greater than the
standard deviation of y values.
A. Always
B. Sometimes
C. Never

When we carry out a chi-square test of independence, as the differences between the
respective observed and expected frequencies decrease, the probability of concluding
that the row variable is independent of the column variable:
A. Decreases.
B. Increases.
C. May decrease or increase depending on the number of rows and columns.
D. Will be unaffected.
Which of the following is a violation of one of the major assumptions of the simple
regression model?
A. The error terms are independent of each other.
B. A histogram of the residuals forms a bell-shaped, symmetrical curve.
C. The error terms show no pattern.
D. As the value of x increases, the value of the error term also increases.
The point estimate of the variance in a regression model is:

A. SSE
B. b0
C. MSE
D. b1
The ___________ of the simple linear regression model is the value of y when the mean
value of x is zero.
A. y-intercept
B. slope
C. independent variable
D. response variable
A real estate company is analyzing the selling prices of residential homes in a given
community. 140 homes that have been sold in the past month are randomly selected and
their selling prices are recorded. The statistician working on the project has stated that
in order to perform various statistical tests, the data must be distributed according to a
normal distribution. In order to determine whether the selling prices of homes included
in the random sample are normally distributed, the statistician divides the data into 6
classes of equal size and records the number of observations in each class. She then
performs a chi-square goodness-of-fit test for normal distribution. The results are
summarized in the following table.
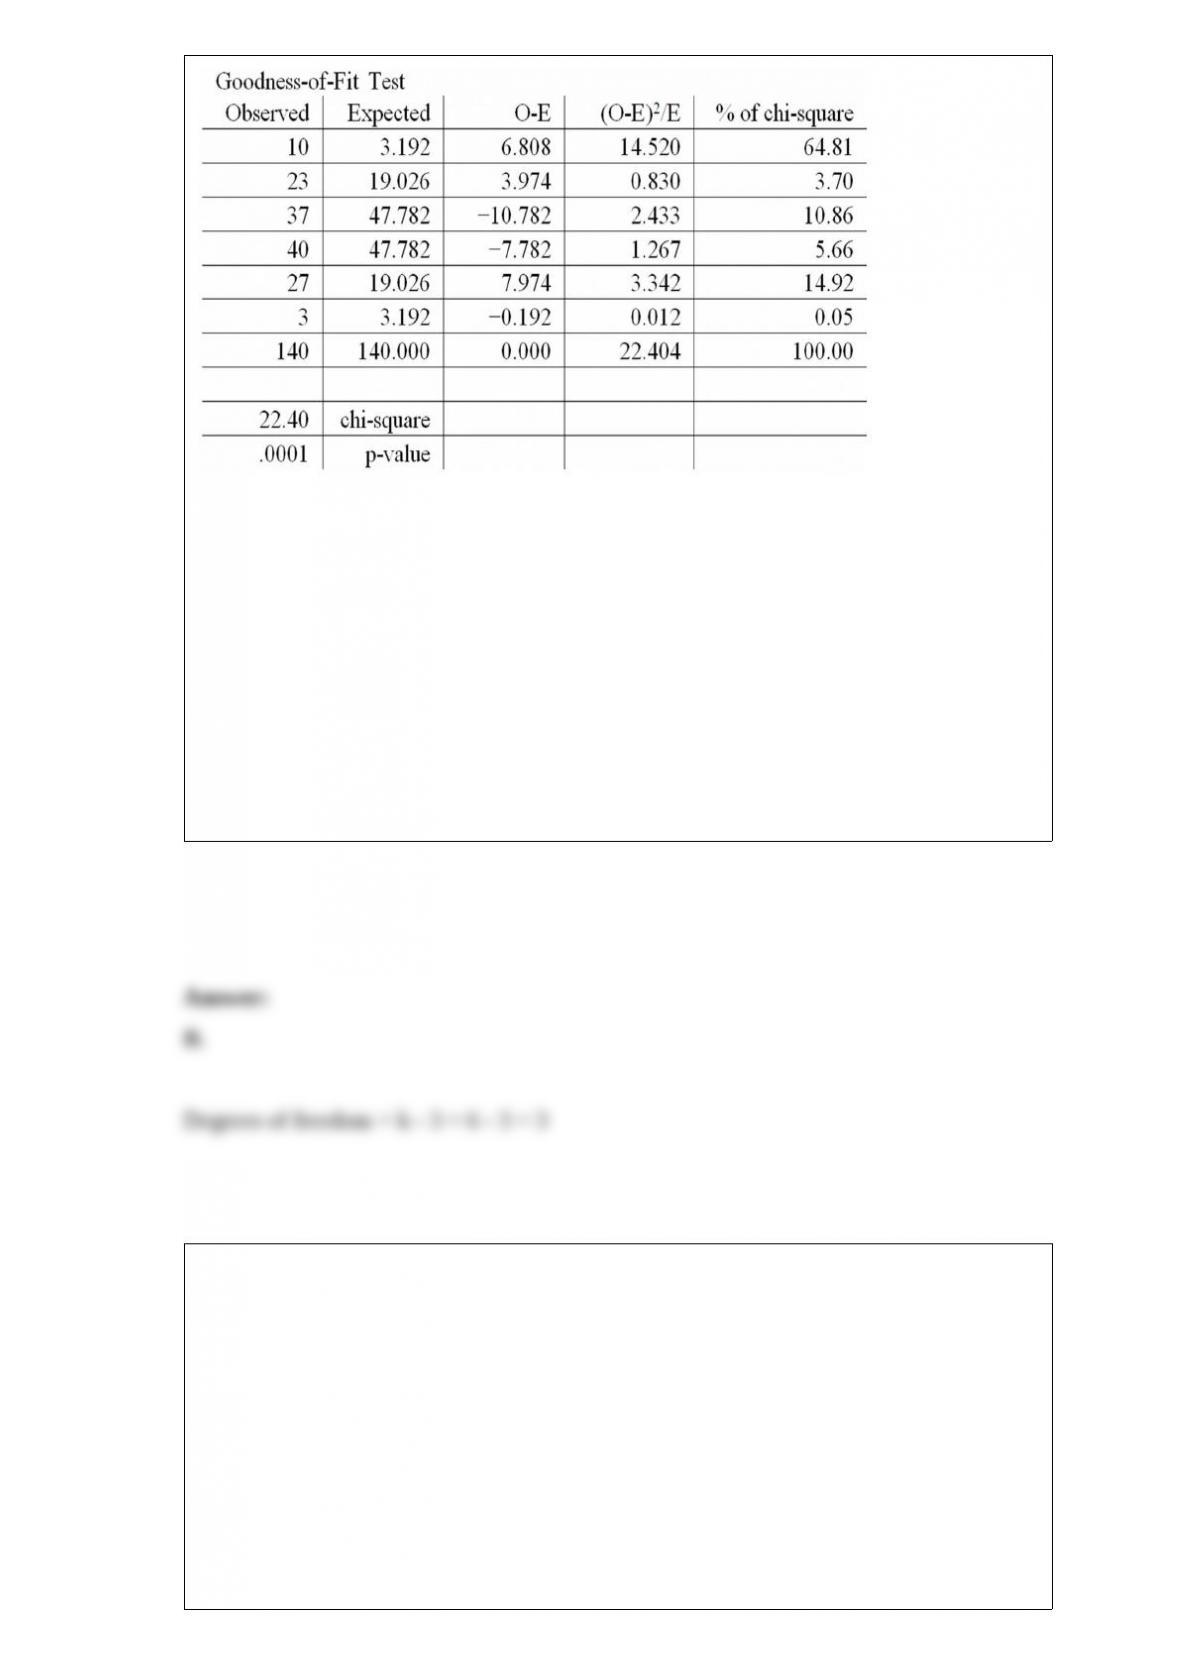
What are the degrees of freedom for the chi-square test?
A. 2
B. 3
C. 4
D. 5
E. 6
The general form of the quadratic multiple regression models is:
A. y = β1x1 + β2x2 + ε
B. y = β0 + β1x1 + β2x2 + ε
C. y = β0 + β1x + β2x2 + ε
D. y = β0 + β1x2 + ε

E. y = β0 + β1x1 + β2x2
2 + ε
In a simple linear regression model, the slope term is the change in the mean value of y
associated with _____________ in x.
A. a corresponding increase
B. a variable change
C. no change
D. a one-unit increase
Which one of the following is not an assumption about the residuals in a regression
model?
A. Constant variance
B. Independence
C. Normality
D. Variance of zero
E. Mean of zero

When employing measurement data to study a process, the ____________ monitors the
process mean.
A.
B. p-bar chart
C. R chart
D. Natural tolerance
E. Pattern analysis
For a given data set, specific value of X, and confidence level, if all the other factors are
constant, the confidence interval for the mean value of Y will ___________ be wider
than the corresponding prediction interval for the individual value of Y.
A. Always
B. Sometimes
C. Never

In a manufacturing process, if the limits for a control chart are set too _____________,
the risk of not investigating a special cause of variation and possibly not taking a
corrective action ____________.
A. Tight, increases
B. Loose, increases
C. Loose, decreases
D. None of these
In a manufacturing process, if the limits for a control chart are set too _____________,
the risk of unnecessarily tampering with the process ____________.
A. Tight, increases
B. Loose, increases
C. Tight, decreases
D. None of these
The variable of interest in an experiment is referred to as the __________ variable.
A. Categorical
B. Regression
C. Response

D. Factor
The chi-square goodness-of-fit test for multinomial probabilities with 5 categories has
_____ degrees of freedom.
A. 5
B. 4
C. 3
D. 6
Significant _________ may exist when the overall F statistic is significant and the
individual t statistics for all independent variables are insignificant.
A. Autocorrelation
B. Independence
C. Multicollinearity
D. Outliers

The correlation coefficient may assume any value between:
A. 0 and 1.
B. -∞ and ∞.
C. 0 and 8.
D. -1, and 1.
E. -1, and 0.
The y-intercept (β0) in a multiple regression model represents the estimated value of the
__________ variable, when the value of all independent variables are _________.
A. Response, one
B. Dummy, zero
C. Response, zero
D. Dummy, one
The F test for testing the difference between means is equal to the ratio of Mean Square
_____________ over Mean Square __________________.
A. Treatment, Error
B. Error, Treatment
C. Treatment, Total
D. Error, Total
An experiment was performed on a certain metal to determine if the strength is a
function of heating time. Results based on 10 metal sheets are given below. Use the
simple linear regression model.
Calculate the correlation coefficient.

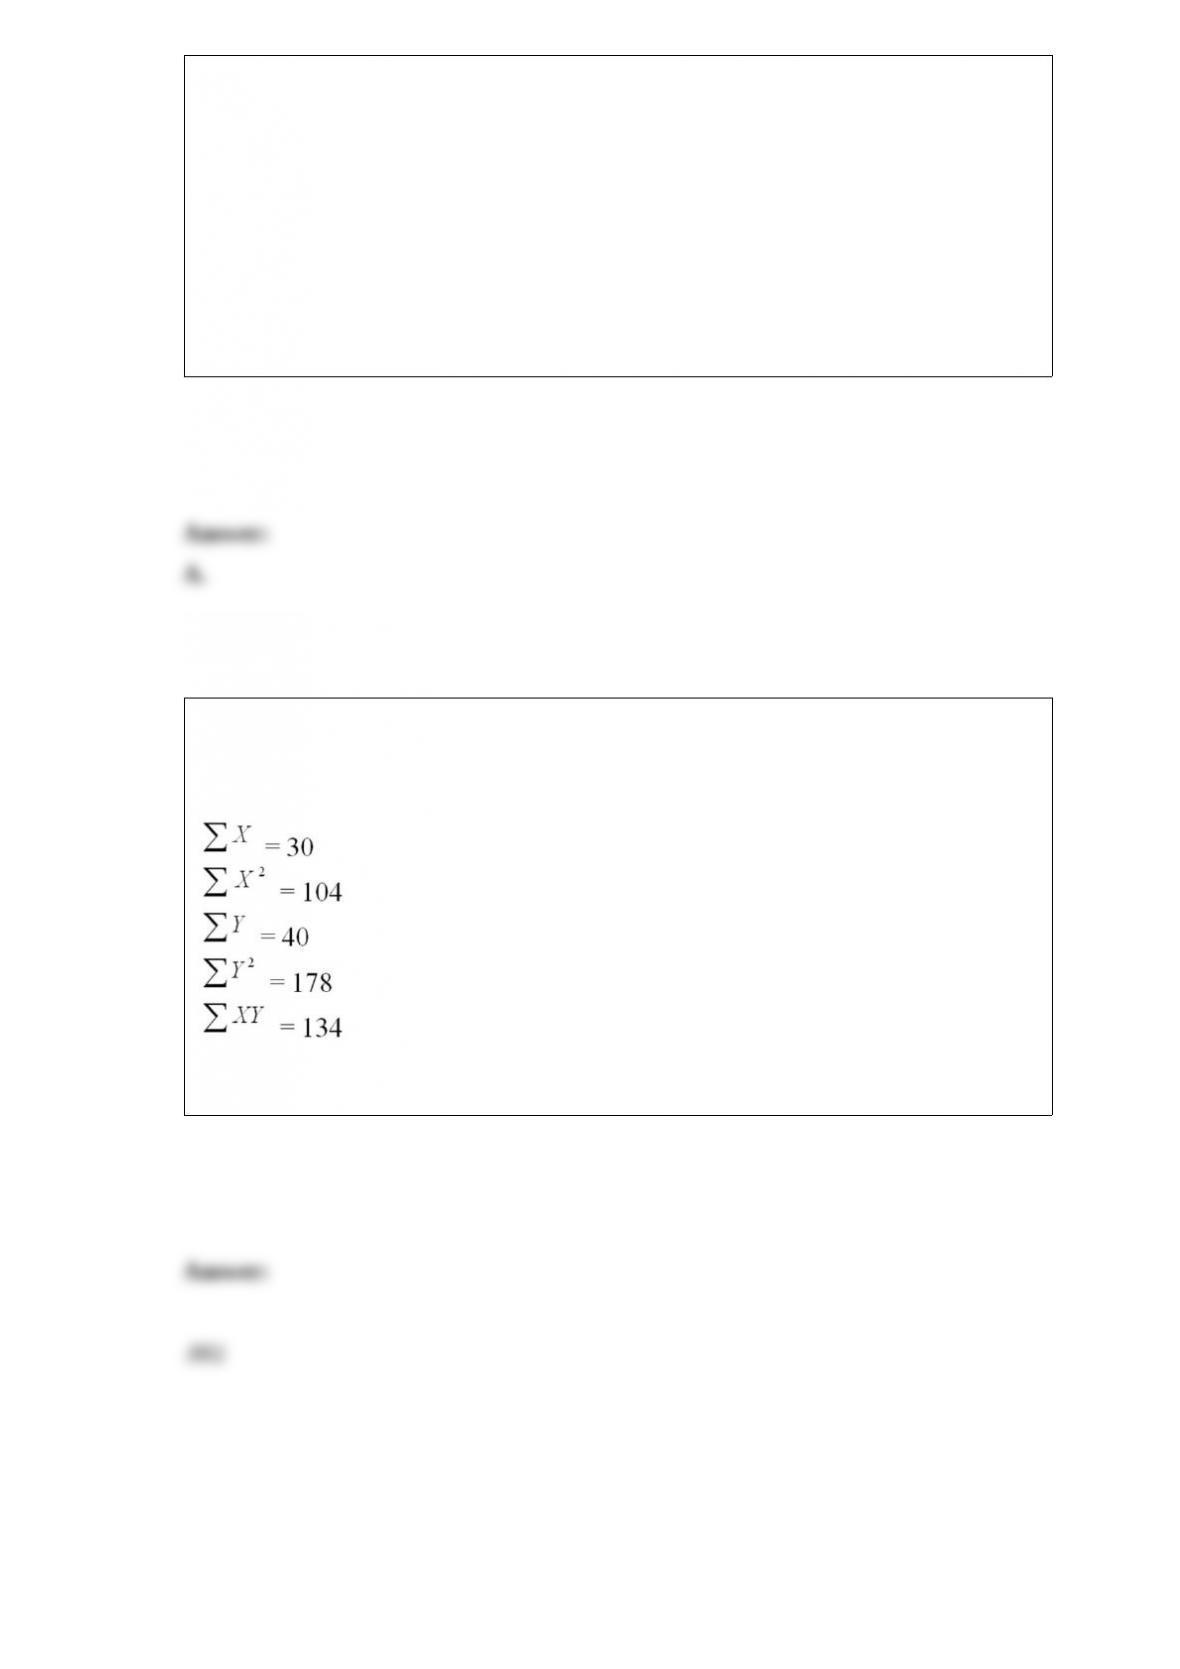
A local tire dealer wants to predict the number of tires sold each month. He believes
that the number of tires sold is a linear function of the amount of money invested in
advertising. He randomly selects 6 months of data consisting of tire sales (in thousands
of tires) and advertising expenditures (in thousands of dollars). Based on the data set
with 6 observations, the simple linear regression model yielded the following results.
Calculate the standard error.
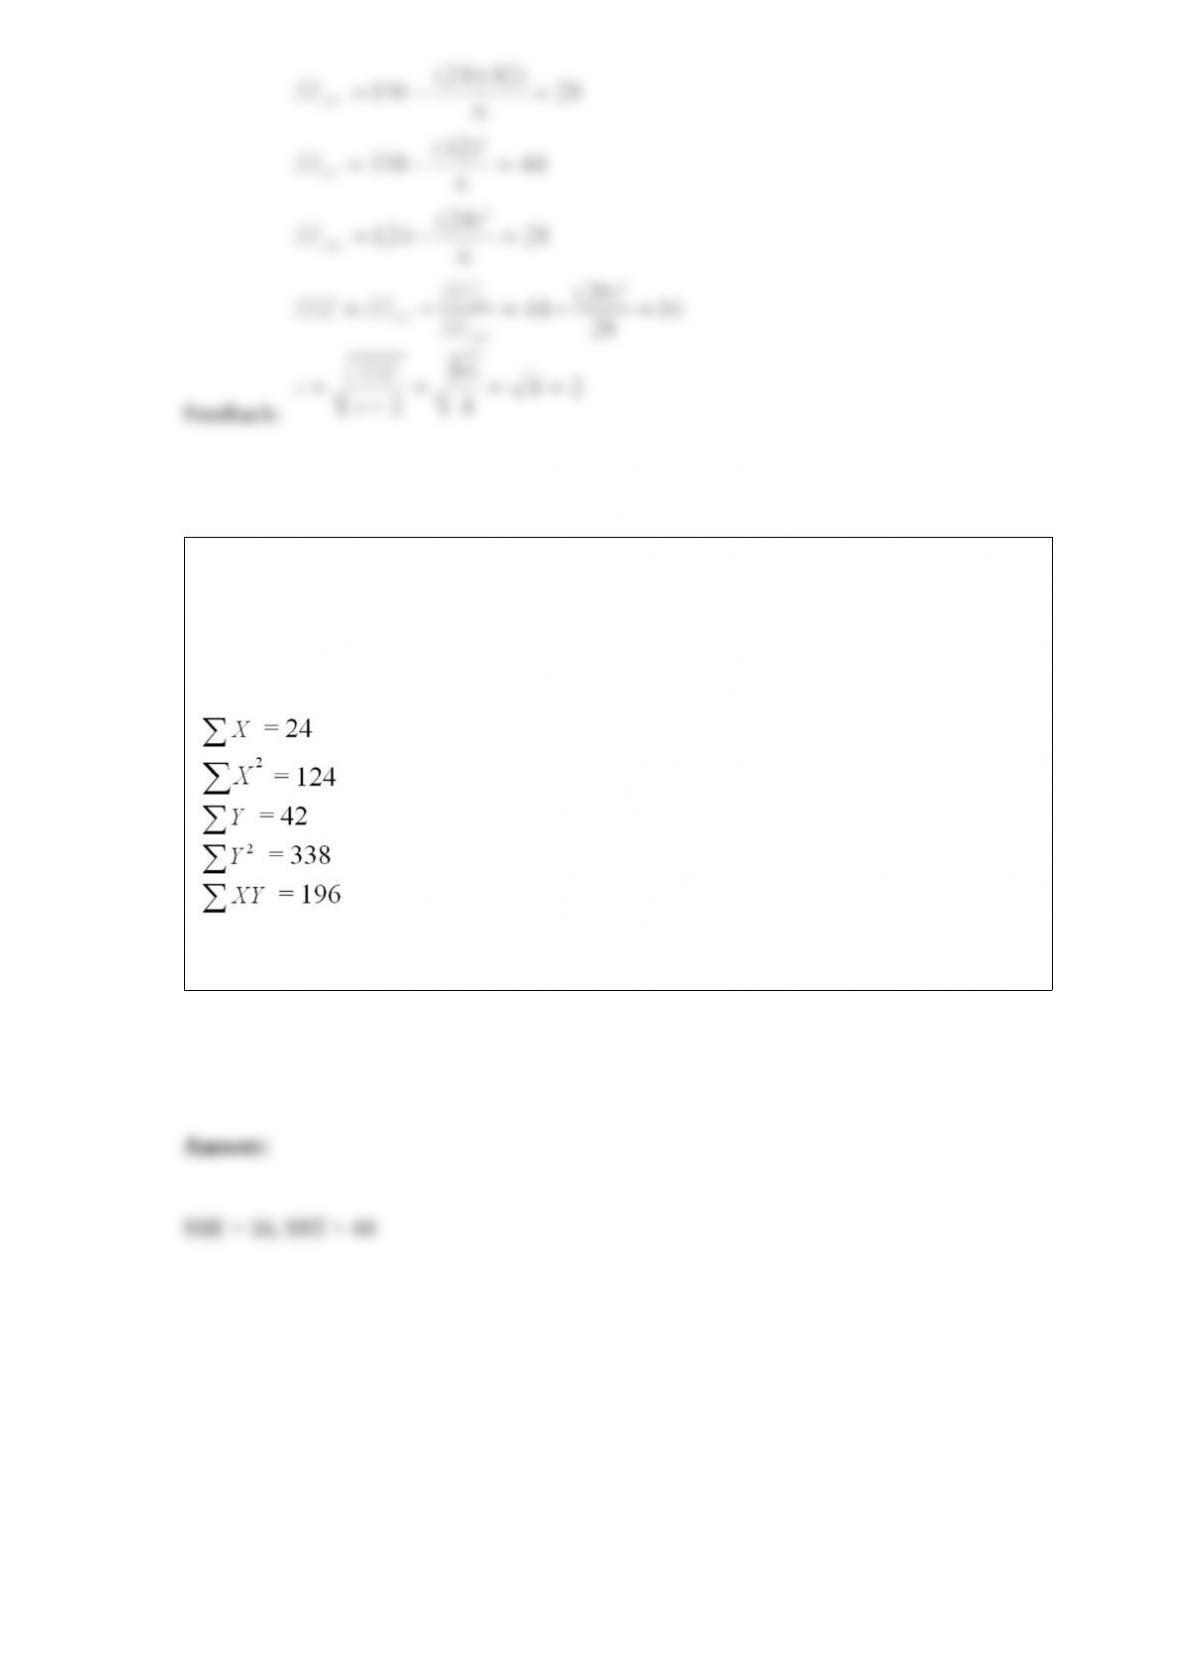
A local tire dealer wants to predict the number of tires sold each month. He believes
that the number of tires sold is a linear function of the amount of money invested in
advertising. He randomly selects 6 months of data consisting of tire sales (in thousands
of tires) and advertising expenditures (in thousands of dollars). Based on the data set
with 6 observations, the simple linear regression model yielded the following results.
Determine the values of SSE and SST.
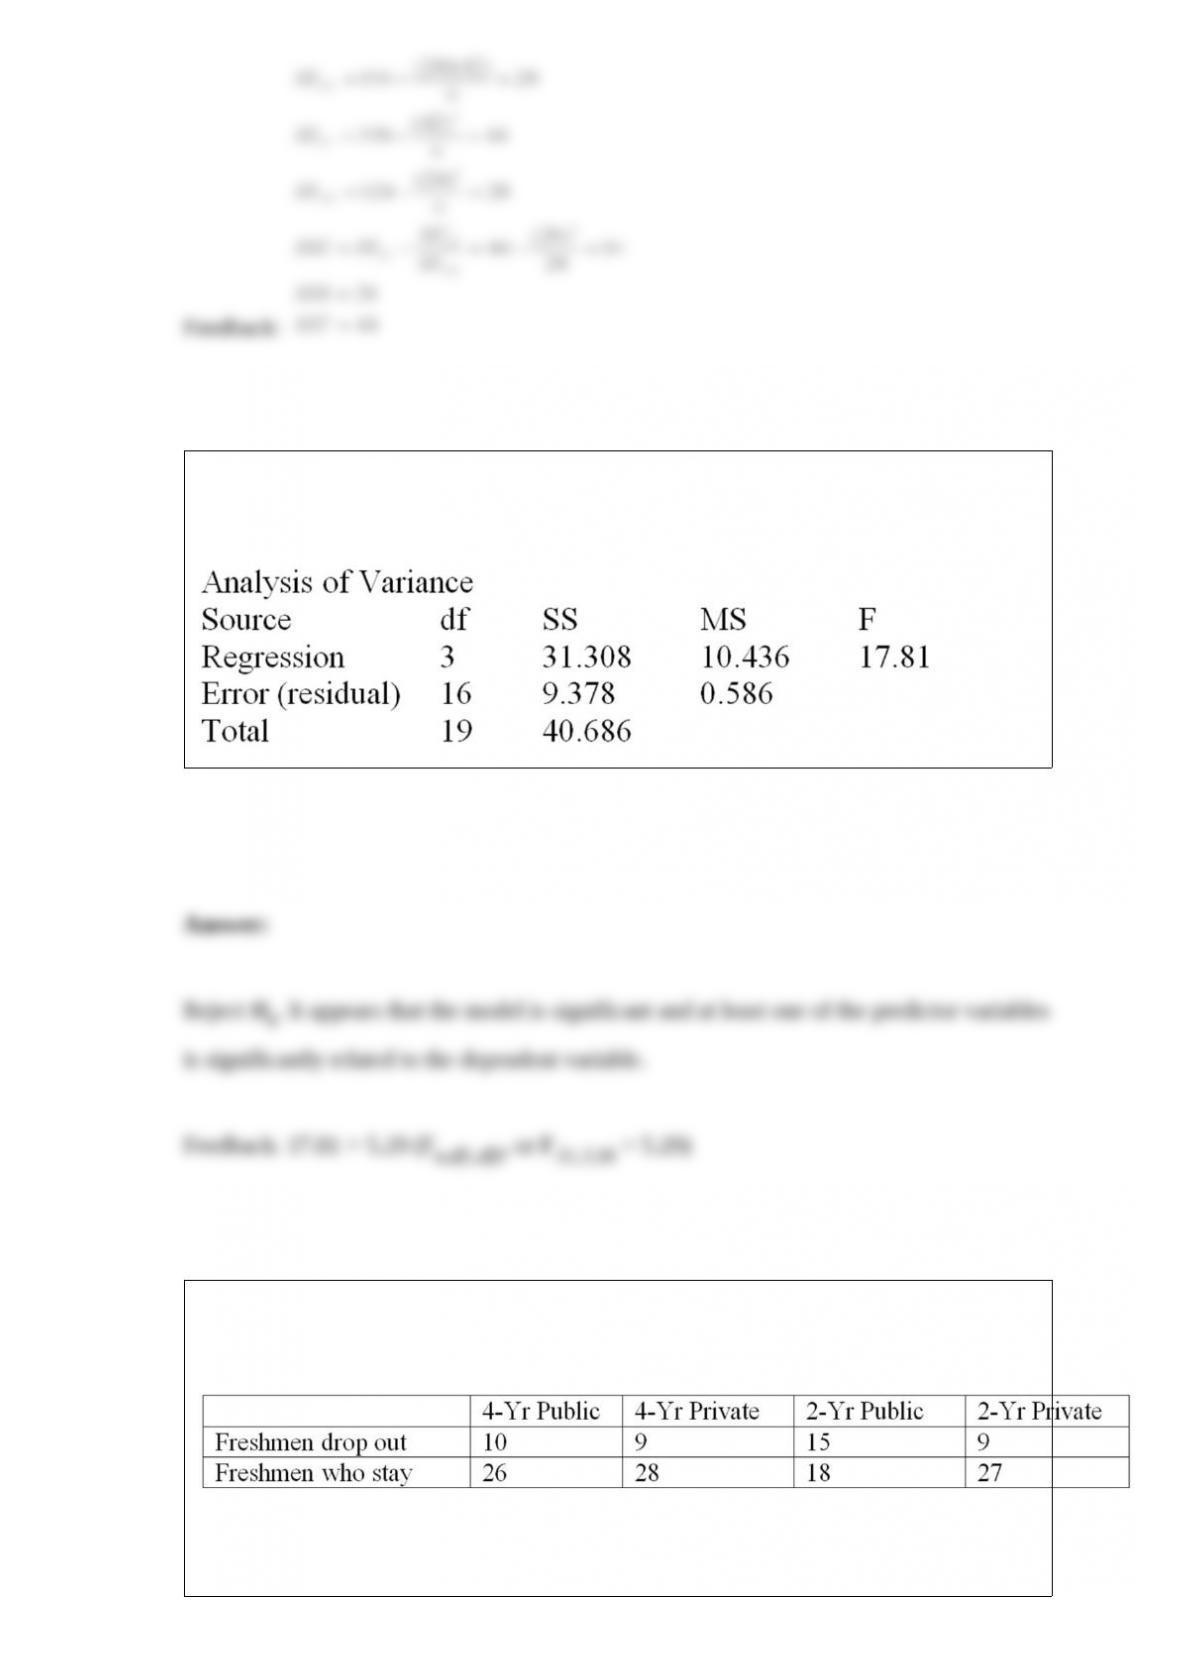
Consider the following analysis of variance table from a multiple regression model.
Test the model for overall usefulness at α = .01 and carefully make a managerial
conclusion.
At a recent meeting of educational researchers, comparisons were made between the
type of college that freshmen attend and the numbers who drop out. A random sample
of freshmen shows the following results:
Determine the expected frequencies for the freshmen who drop out of 2-year
institutions that will be used in the chi-square test of independence.
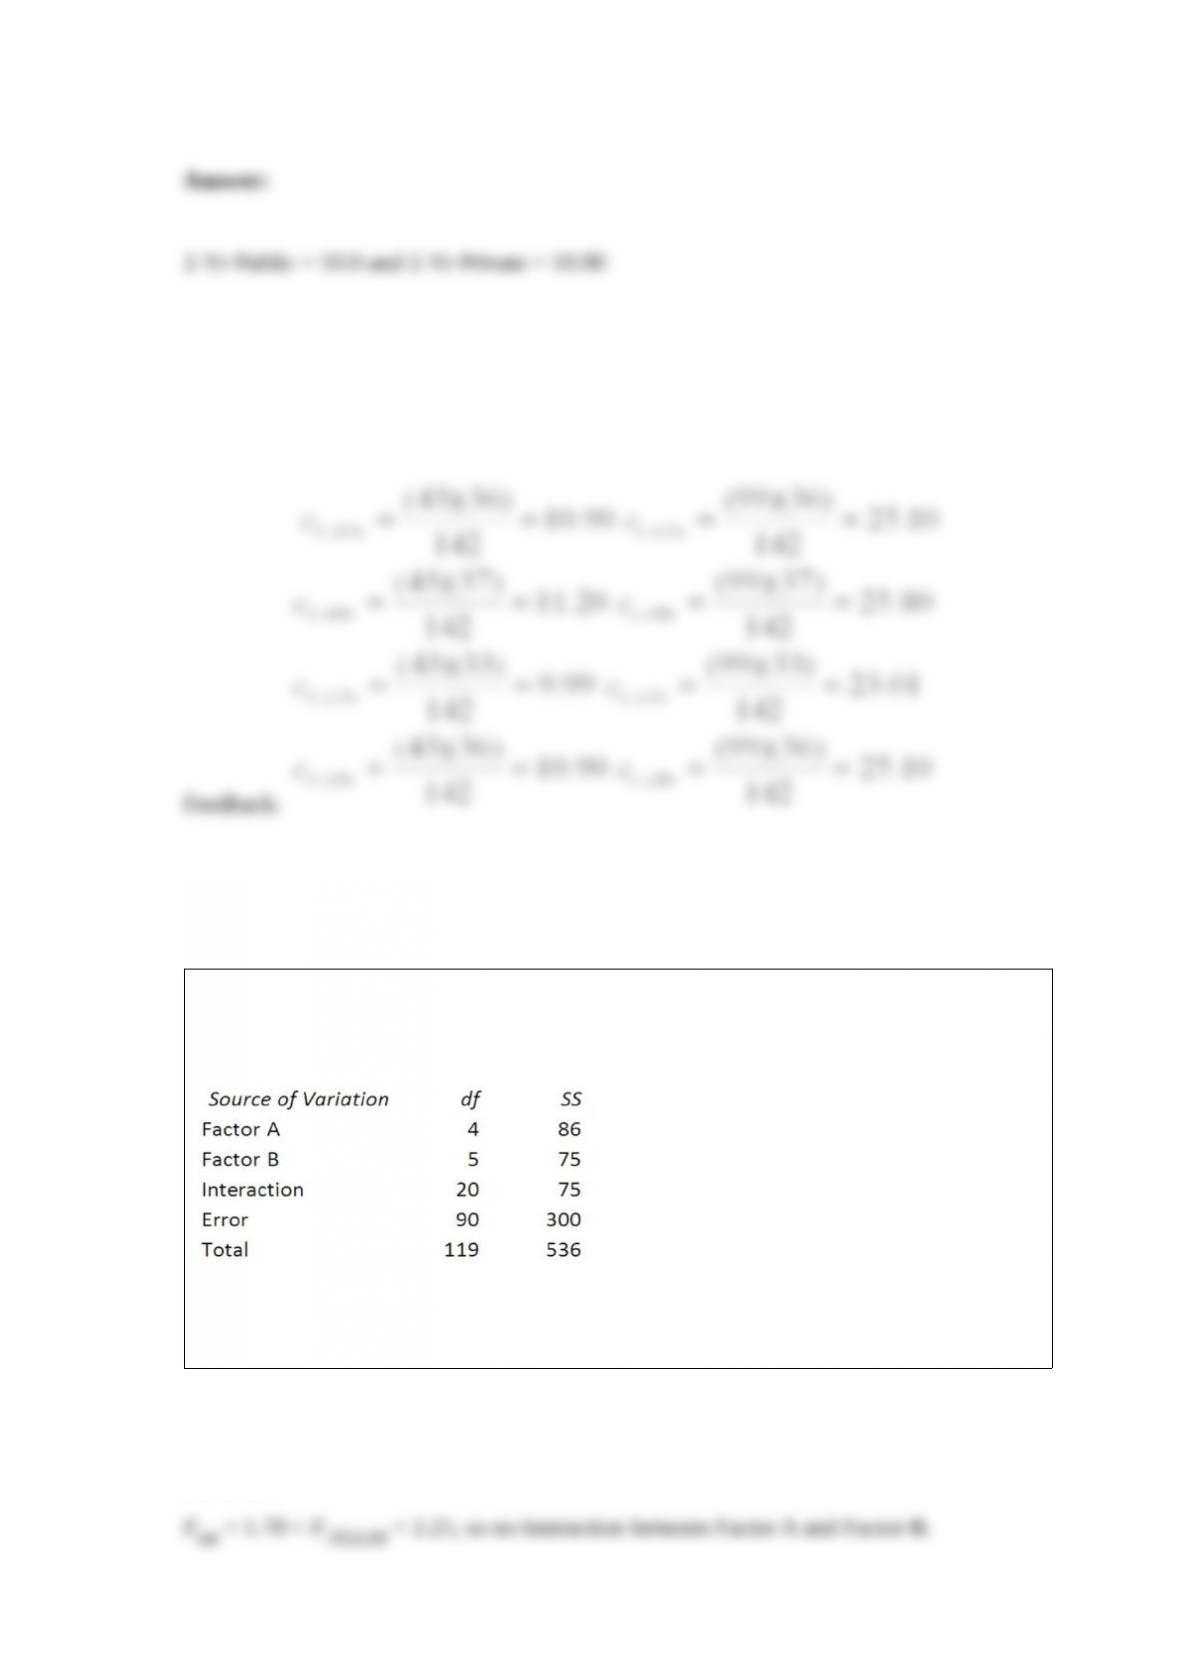
Consider a two-way analysis of variance experiment with treatment factors A and B,
with factor A having four levels and factor B having three levels. The results are
summarized below.
Compute the mean squares and F to test the null hypothesis that no interaction exists
between factor A and B at α = .05.
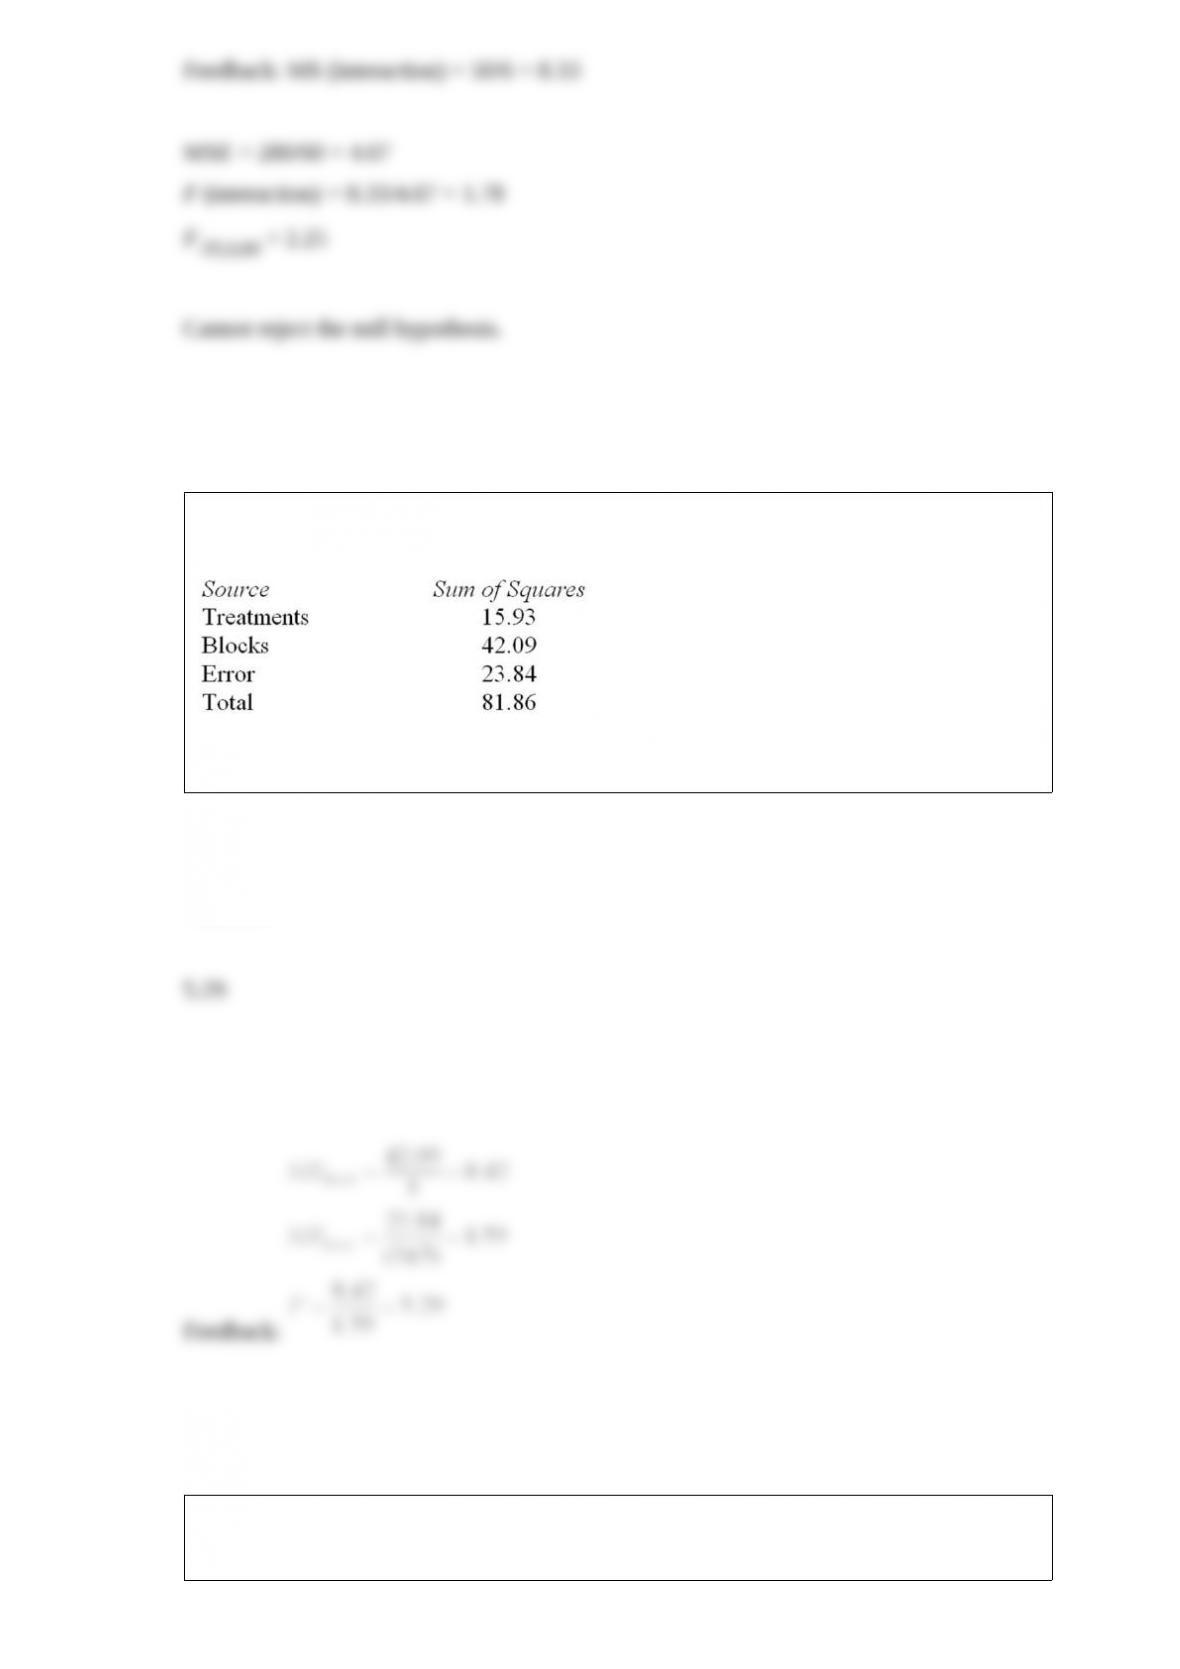
Consider the following partial analysis of variance table from a randomized block
design with 6 blocks and 4 treatments.
What is the calculated F statistic for blocks?
Consider the following partial analysis of variance table from a randomized block
design with 10 blocks and 6 treatments.
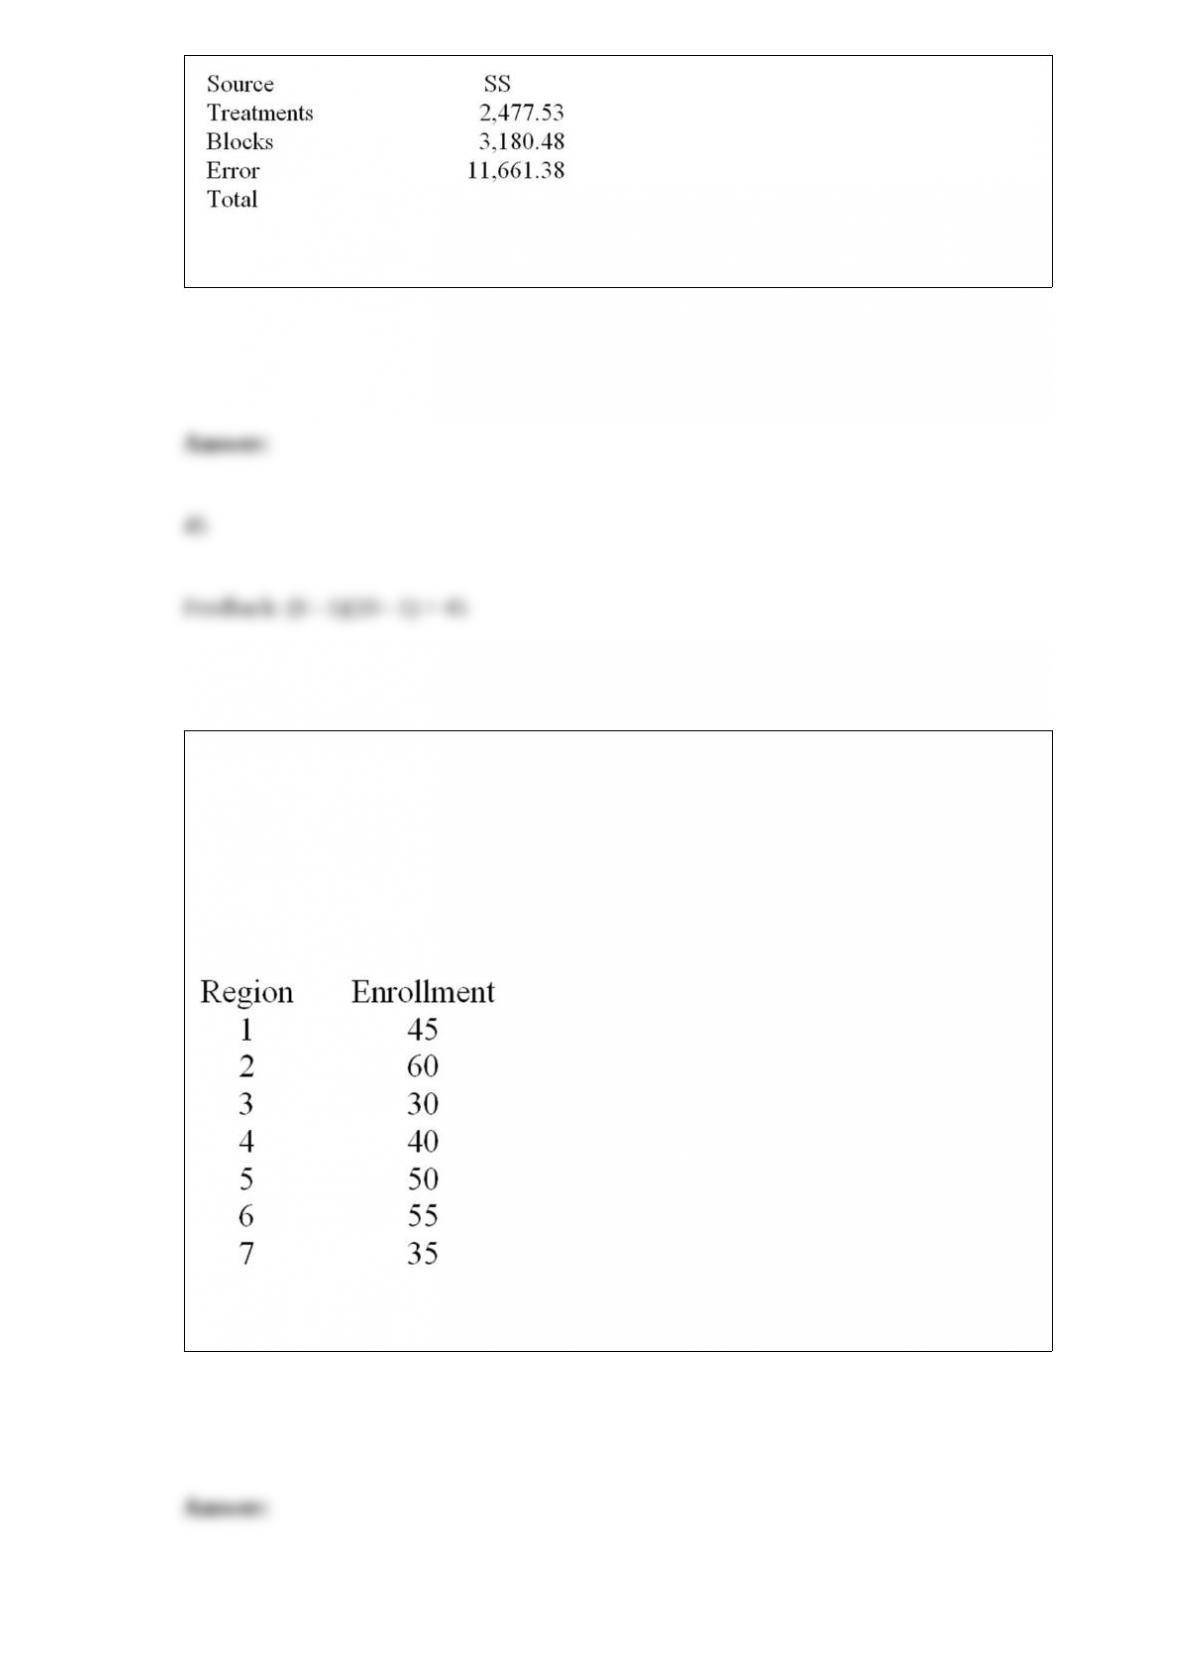
Determine the degrees of freedom for error.
A U.S.-based Internet company offers an online proficiency course in basic accounting.
Completing this online course satisfies the Fundamentals of Accounting course
requirement in many MBA programs. In the first semester, 315 students have enrolled
in the course. The marketing research manager divided the country into seven regions
of approximately equal population. The course enrollment values for each of the seven
regions are given below. The management wants to know if there is equal interest in the
course across all regions.
At a significance level of .01, test H0: the probabilities are equal for all seven regions.
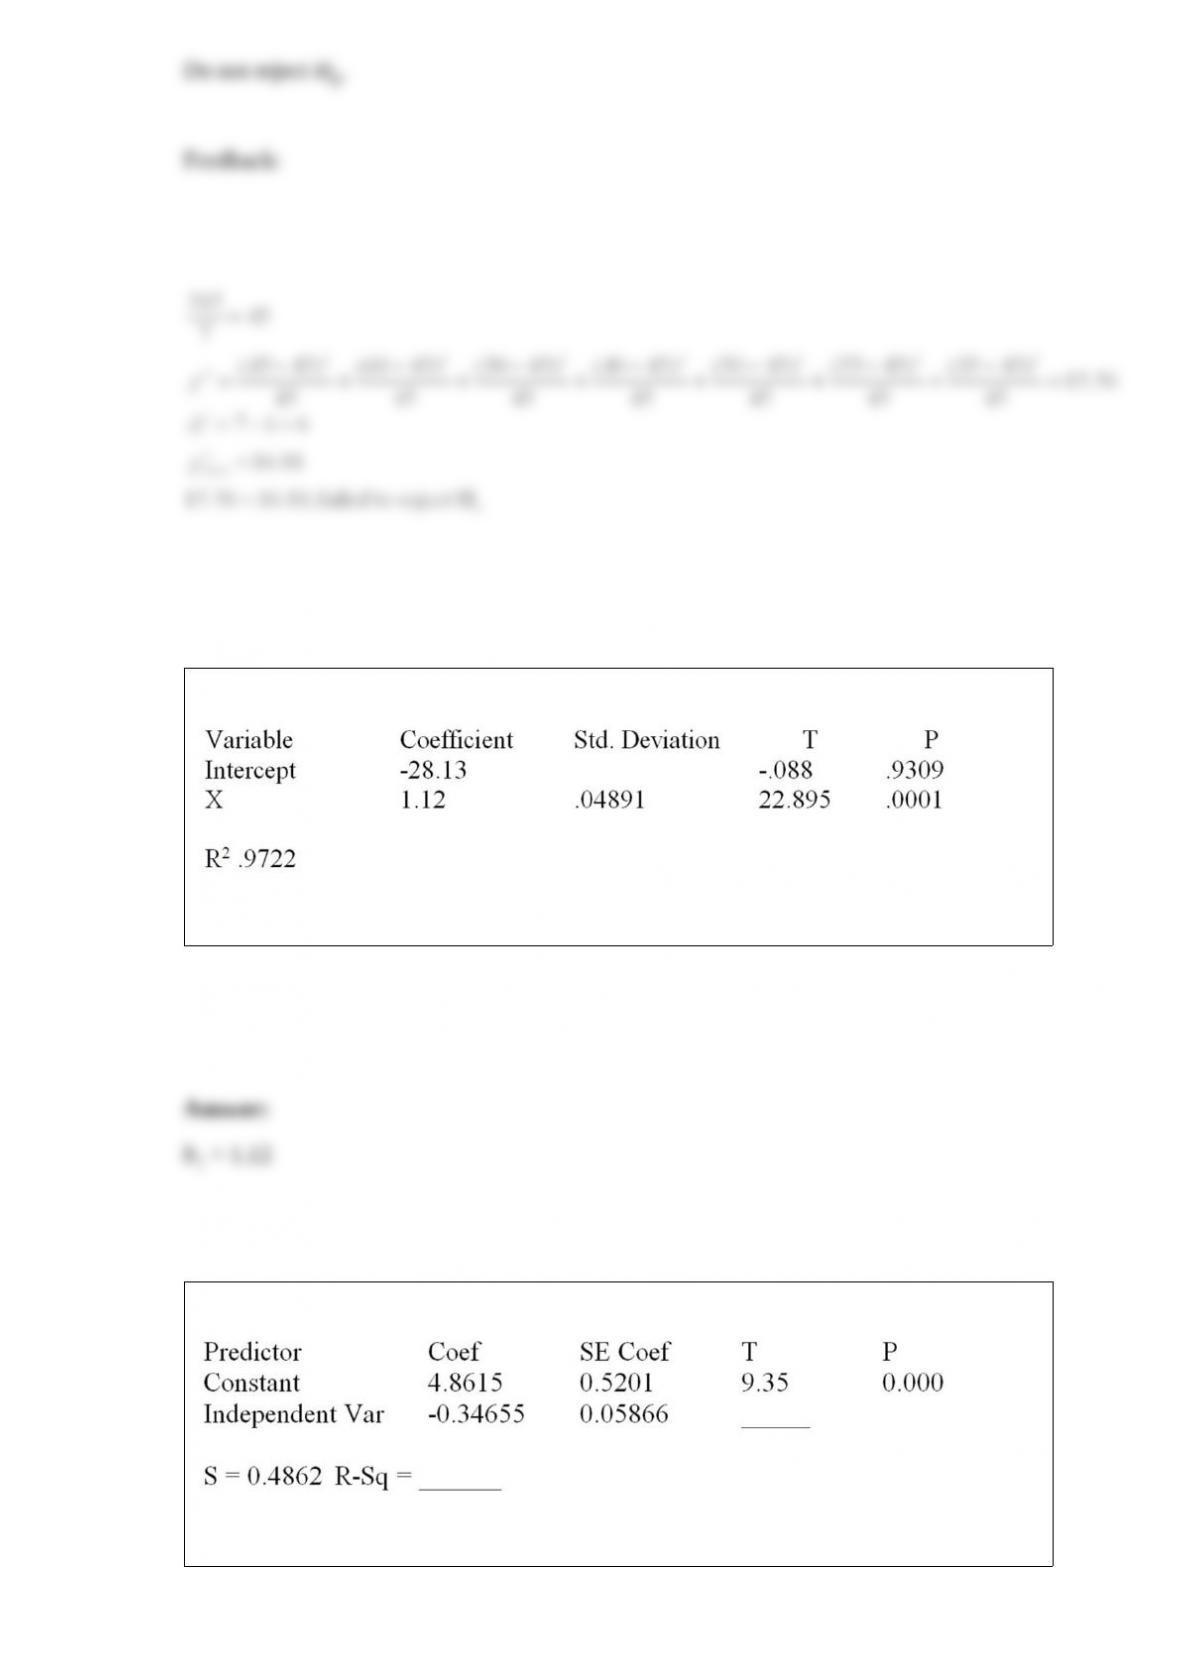
Consider the following partial computer output from a simple linear regression analysis.
What is the estimated slope?
Consider the following partial computer output from a simple linear regression analysis.
Analysis of Variance
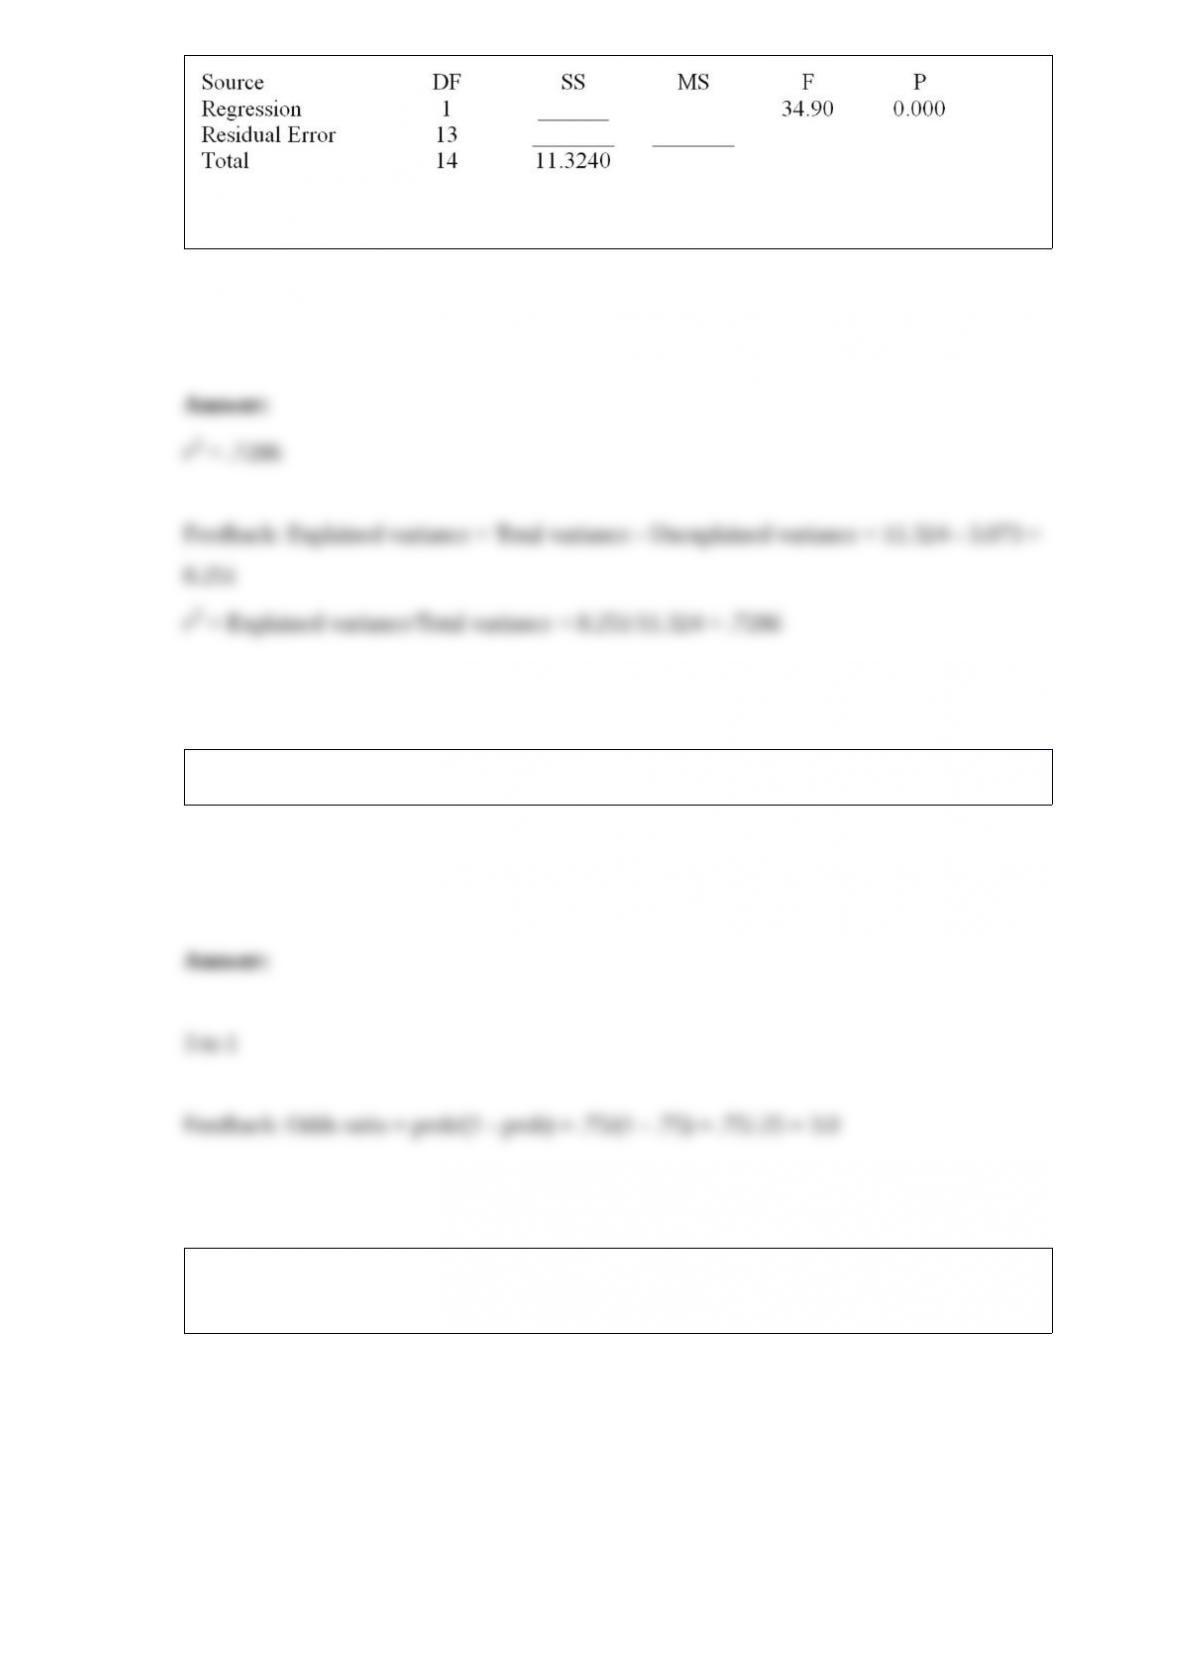
What is the coefficient of determination?
Calculate the odds ratio for an event when its probability is 0.75.
The following frequency table summarizes the ages of 60 shoppers at the local grocery
store.
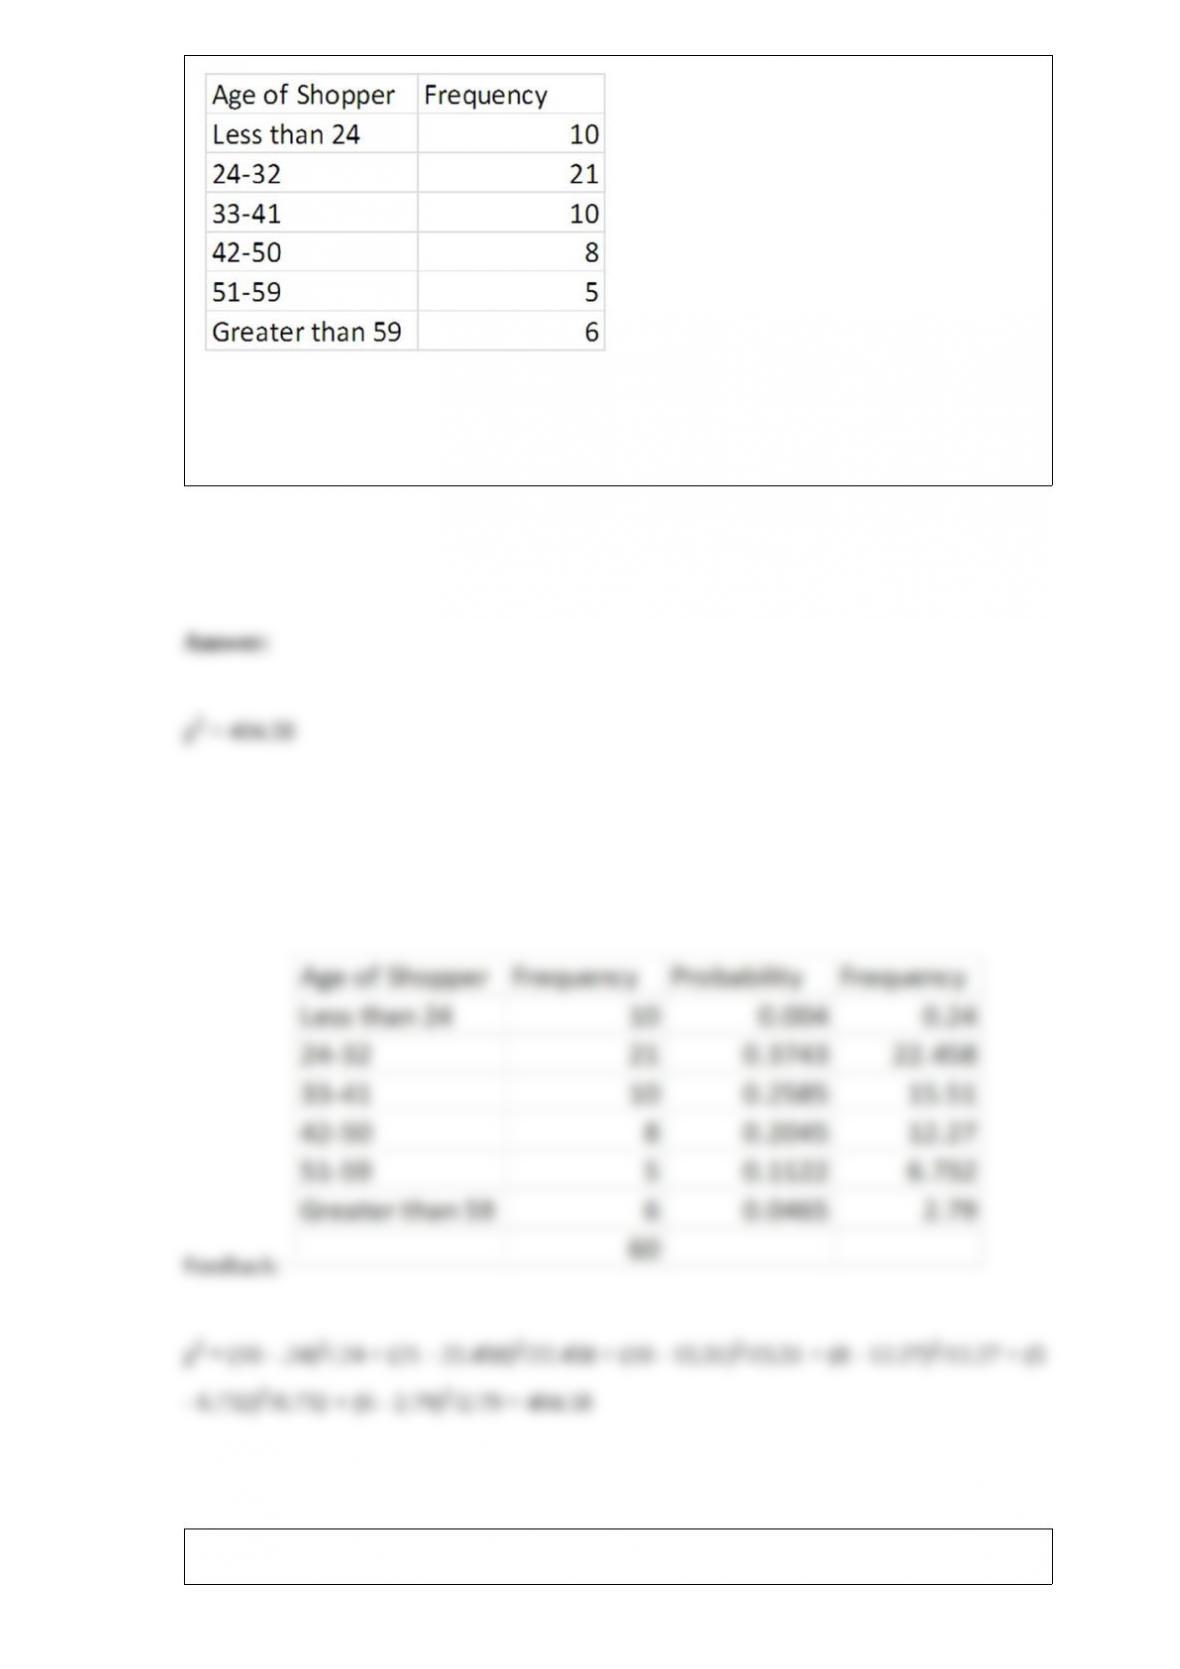
The estimated mean is 36.25, and the estimated standard deviation is 13.57. Calculate
the value of the chi-square test statistic to determine whether these measurements came
from a normal population.
A member of the state legislature has expressed concern about the differences in the
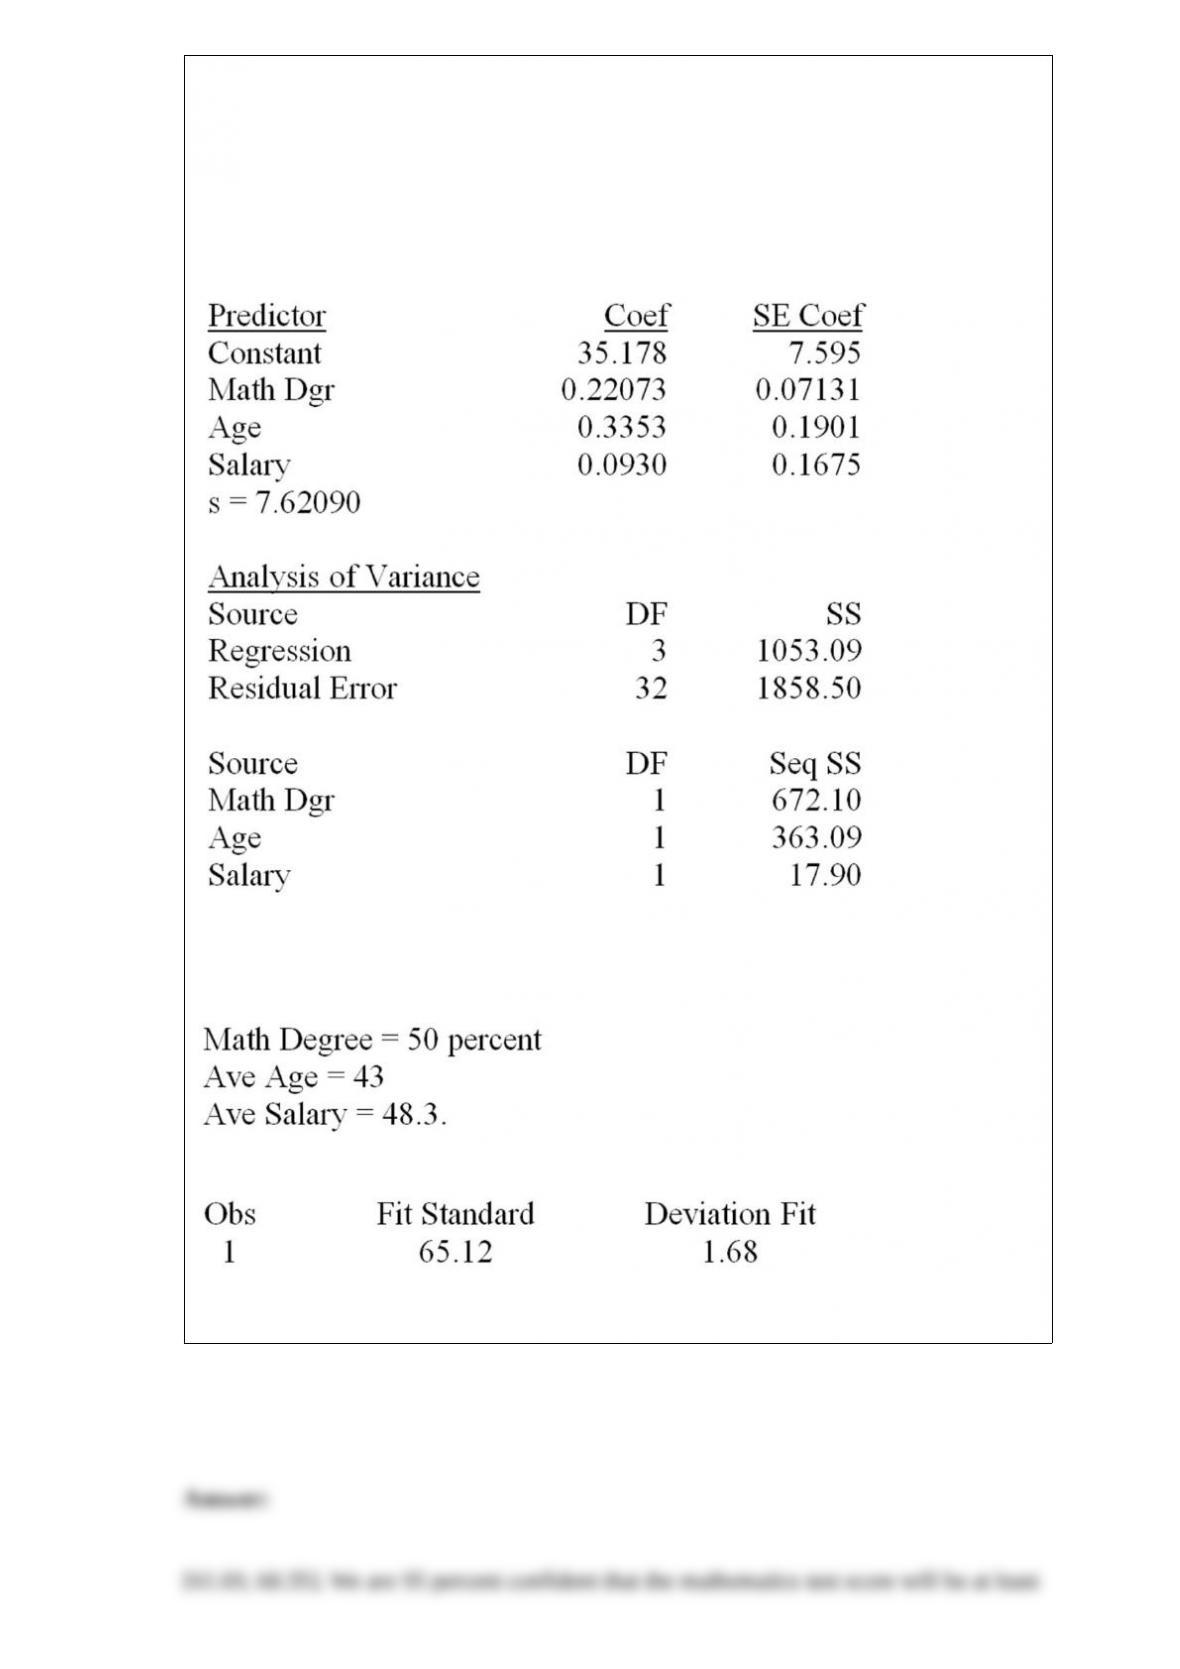
mathematics test scores of high school freshmen across the state. She asks her research
assistant to conduct a study to investigate what factors could account for the
differences. The research assistant looks at a random sample of school districts across
the state and uses the factors of percentage of mathematics teachers in each district with
a degree in mathematics, the average age of mathematics teachers, and the average
salary of mathematics teachers.
Additional information related to this point estimate of 65.12 is given below.
Predicted Values for New Observations:
New
Determine the 95 percent confidence interval for this estimate and interpret its meaning.
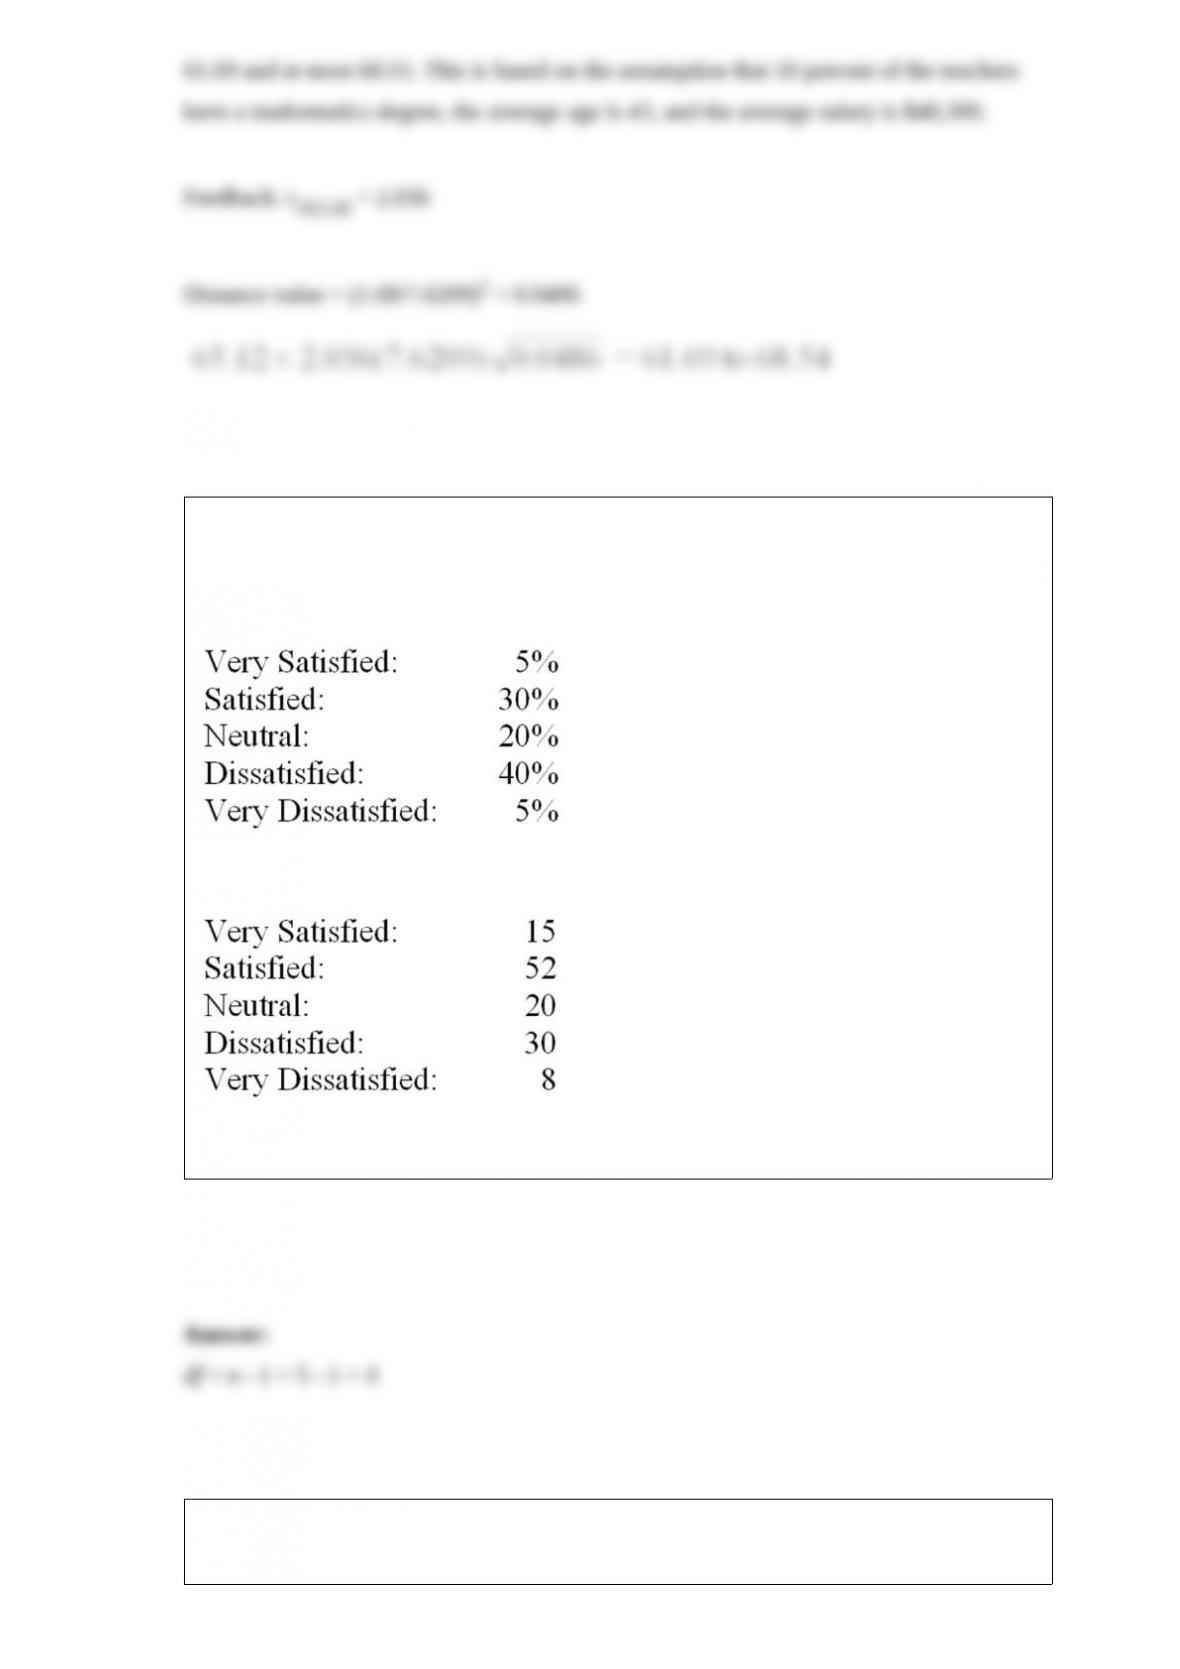
The AAA Co. is interested in the level of satisfaction of their employees with the
benefit package that they offer compared to their major competitors. A consultant hired
to conduct the satisfaction survey told AAA Co. that the distribution of level of
satisfaction at other companies is displayed below:
A survey was conducted of 125 AAA employees with the following results:
What are the degrees of freedom for testing the goodness of fit at α = .05?
A company that fills gallon containers of water has four machines. The quality control
manager needs to determine whether the average fill for these machines is the same.
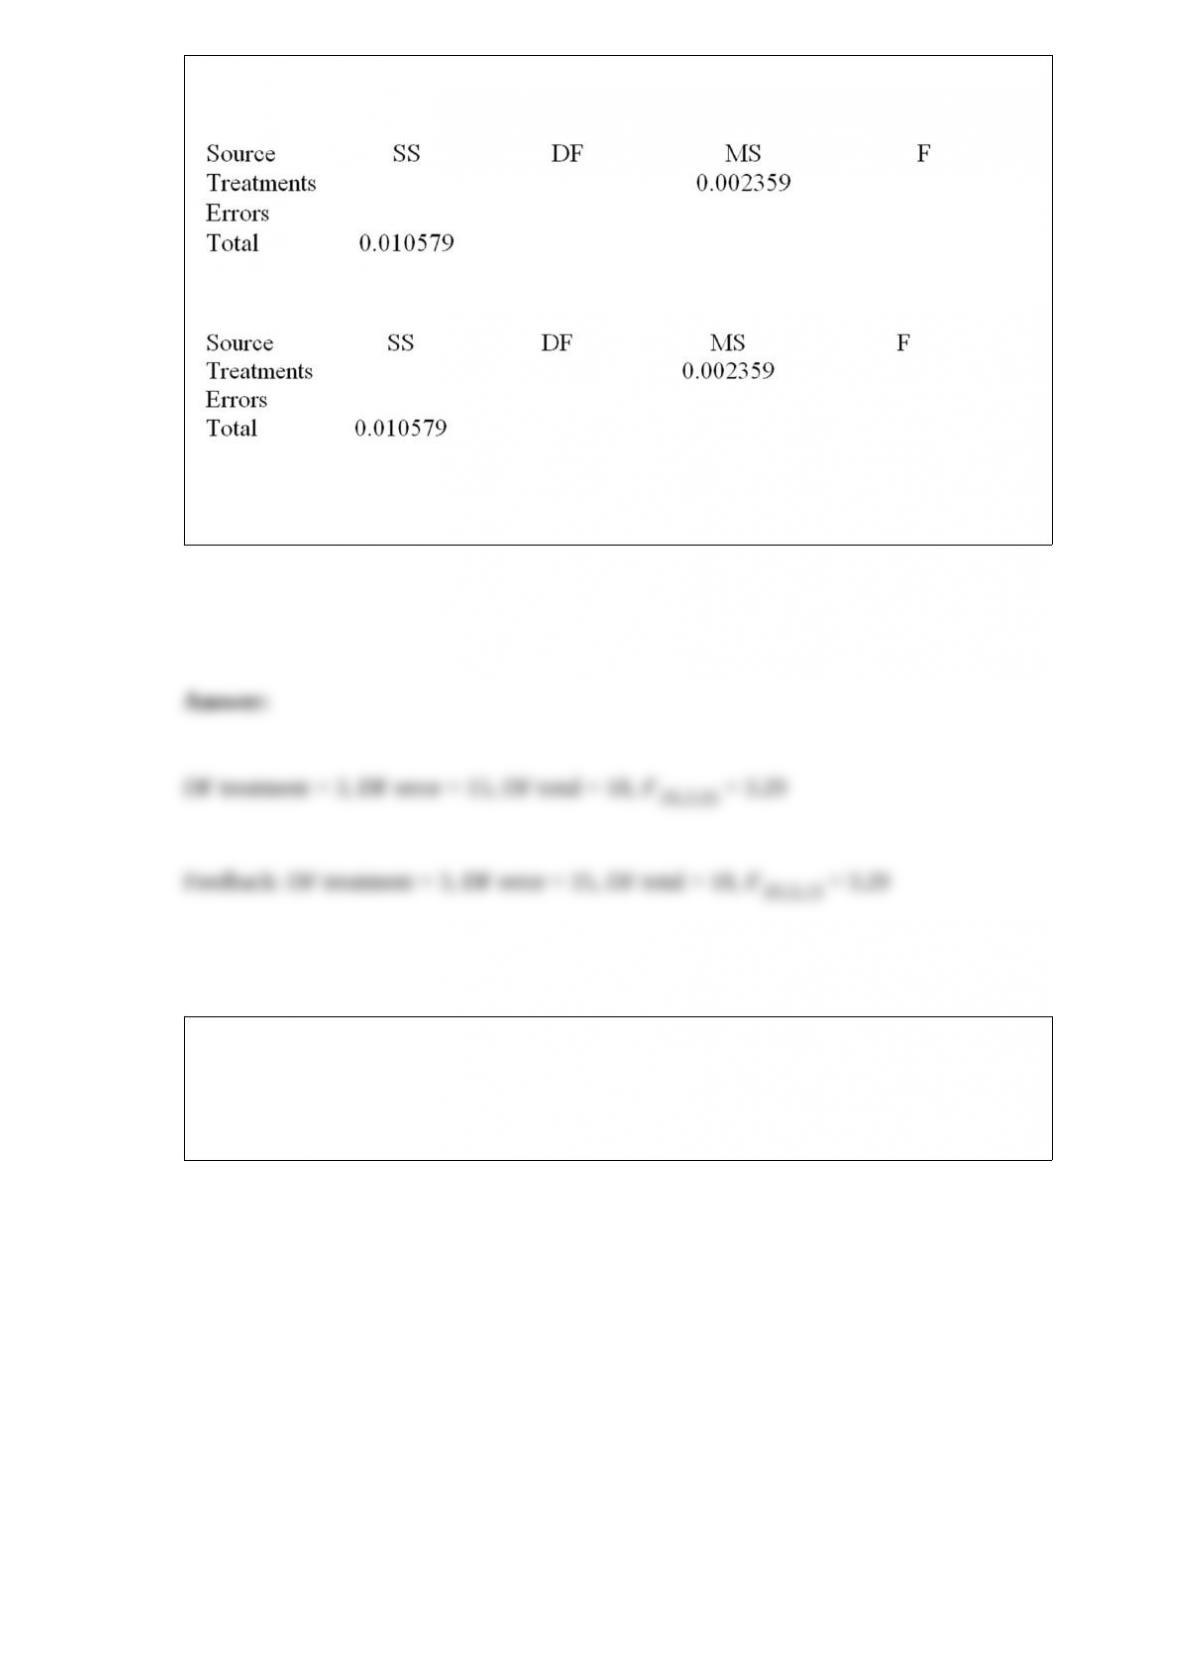
Looking at 19 one-gallon containers, we have the following data of fill measures (x) in
quarts.
And the following partial ANOVA table.
Determine the degrees of freedom for the treatment, error, and total, and state the
critical value of the F statistic at α = .05.
The manufacturer of a light fixture believes that the dollars spent on advertising, the
price of the fixture, and the number of retail stores selling the fixture in a particular
month influence the light fixture sales. The manufacturer randomly selects 10 months
and collects the following data:
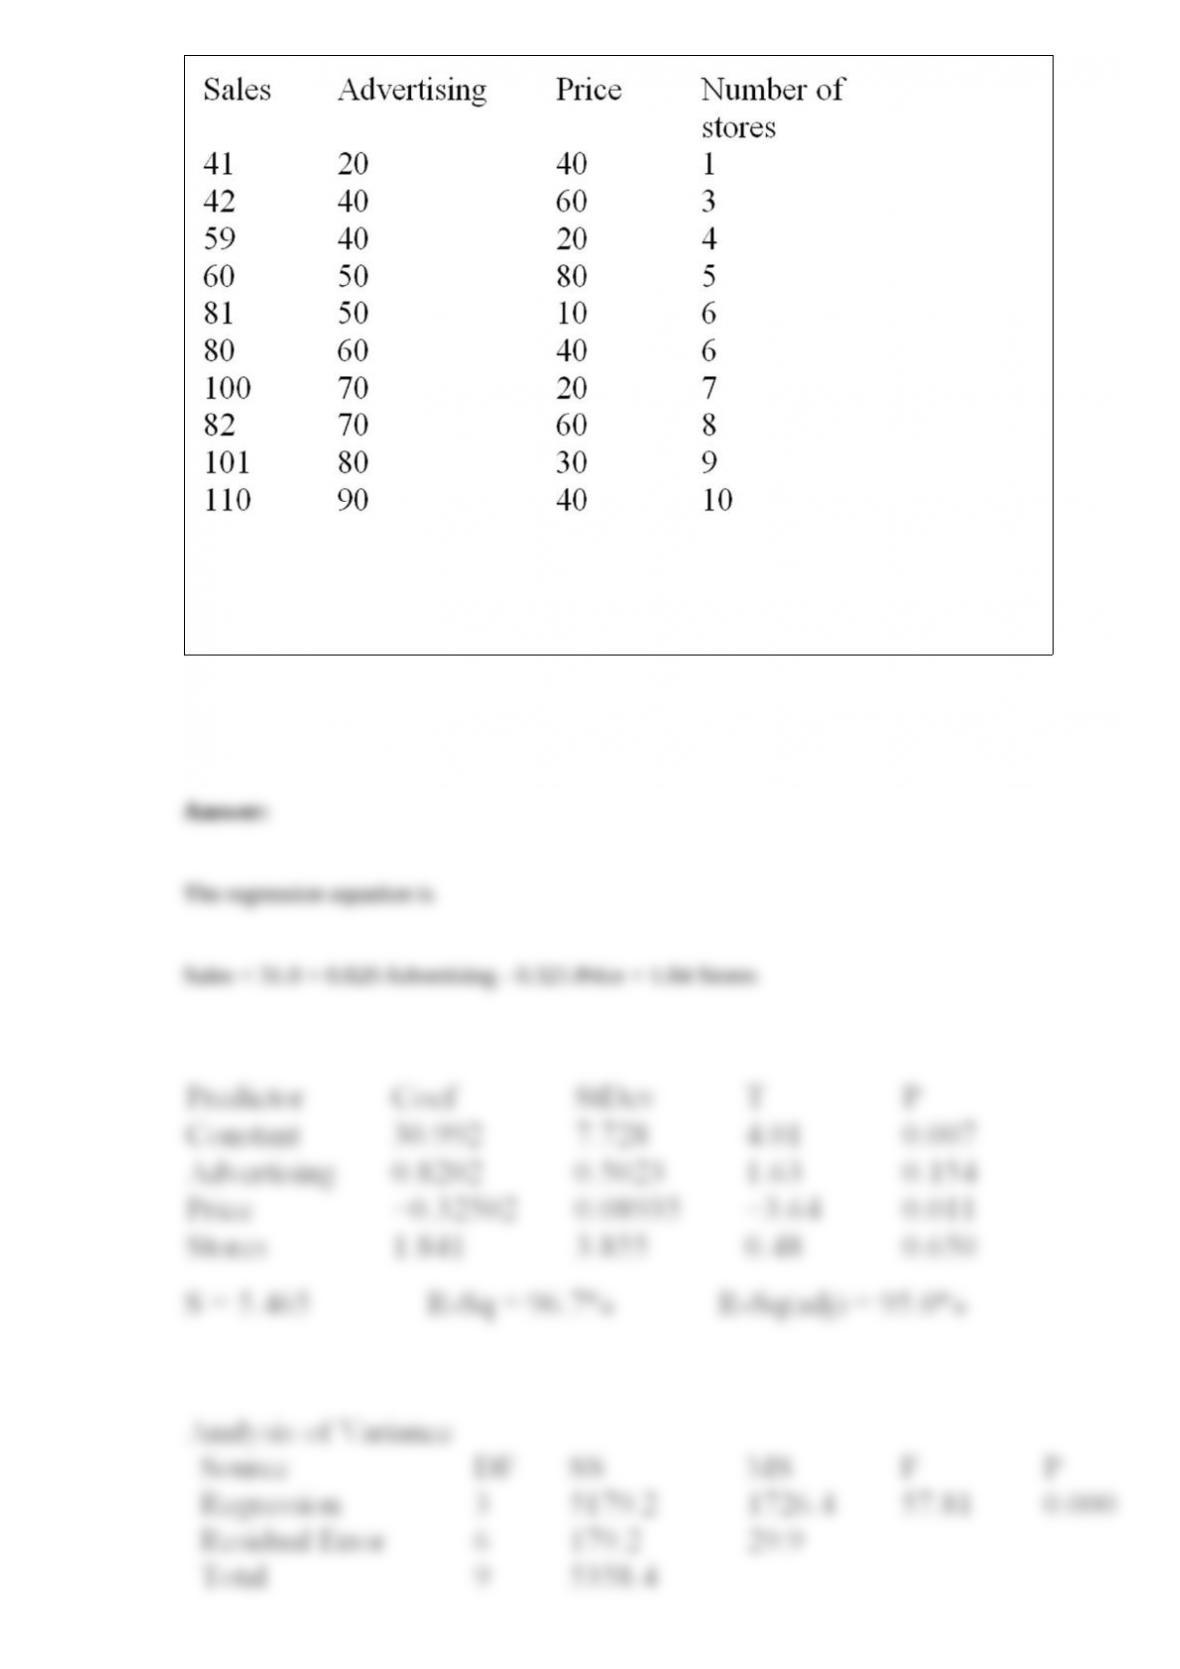
The sales are in thousands of units per month, the advertising is given in hundreds of
dollars per month, and the price is the unit retail price for the particular month. Using
MINITAB, the following computer output is obtained.
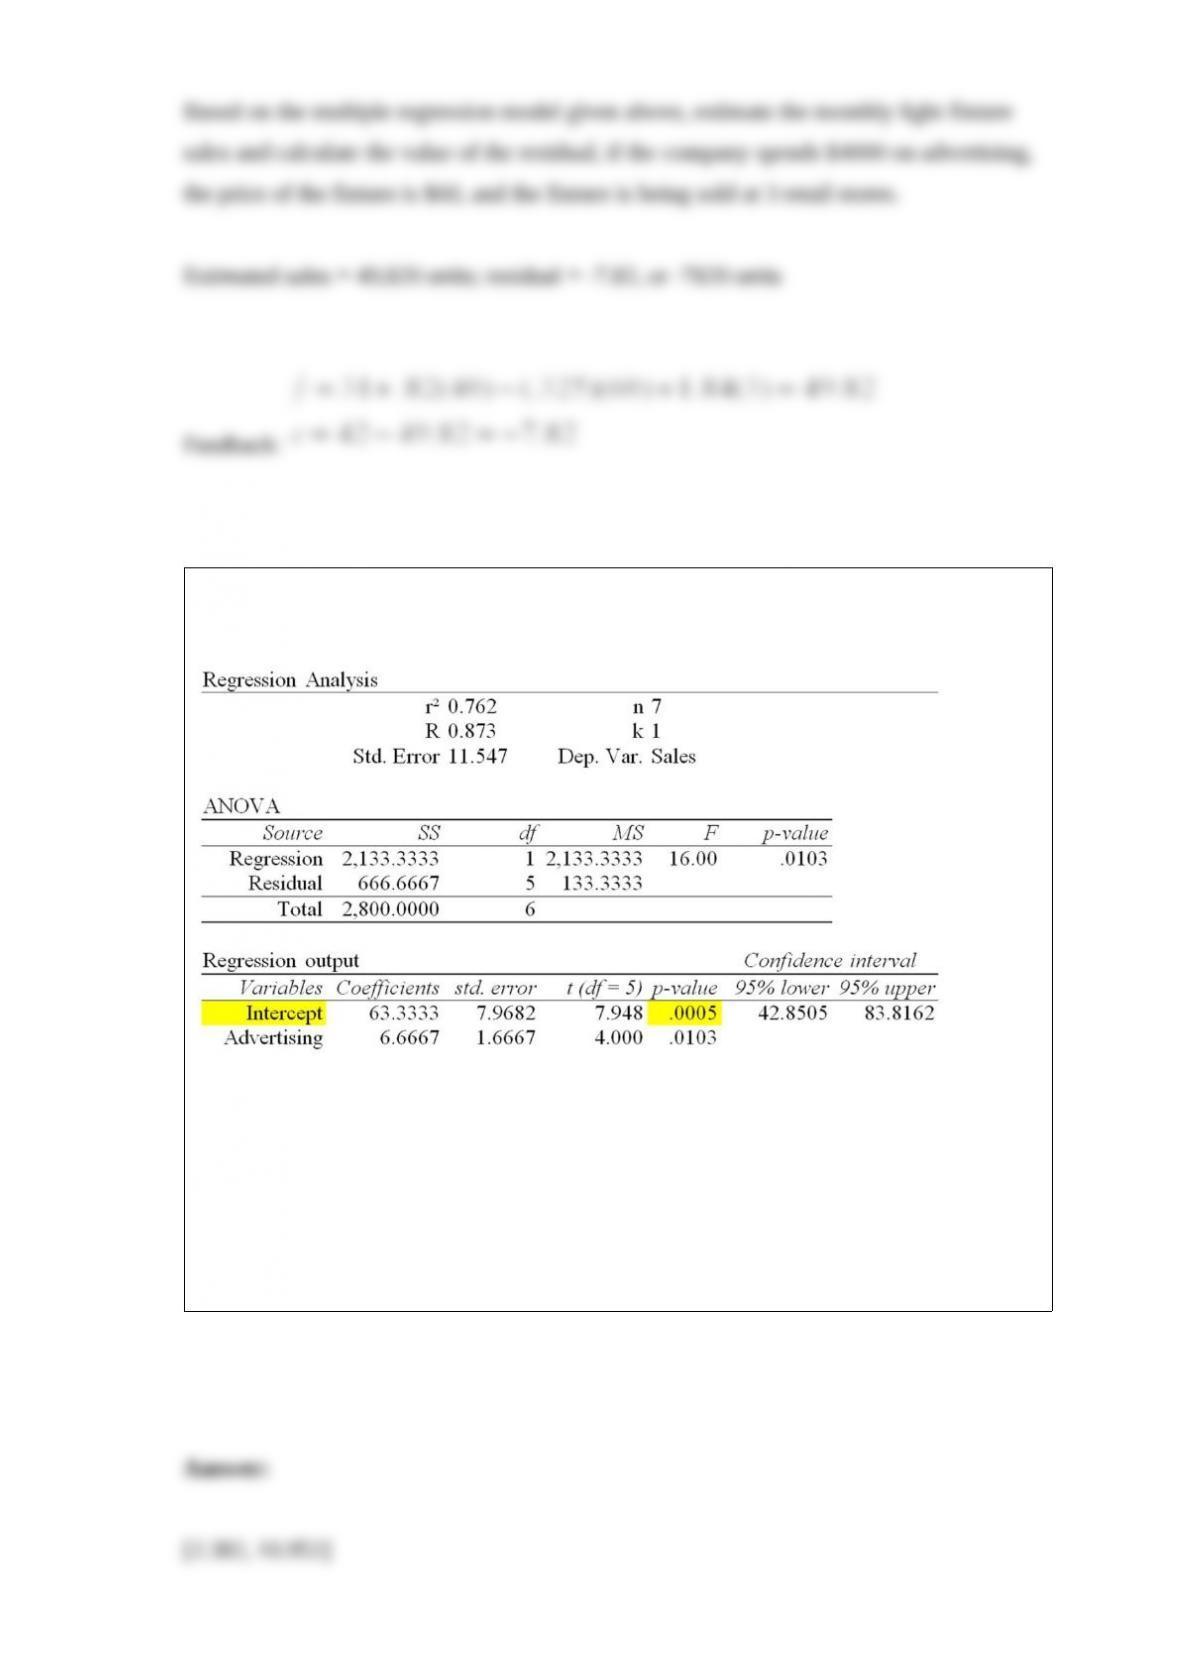
The local grocery store wants to predict its daily sales in dollars. The manager believes
that the amount of newspaper advertising significantly affects sales. He randomly
selects 7 days of data consisting of daily grocery store sales (in thousands of dollars)
and advertising expenditures (in thousands of dollars). The Excel/MegaStat output
given above summarizes the results of the regression model.
What are the limits of the 95 percent confidence interval for the population slope?
In a one-way analysis of variance with three treatments, each with five measurements,
in which a completely randomized design is used, compute the F statistic where the
sum of squares treatment is 17.0493 and the sum of squares error is 8.028.