Rational subgrouping allows us to detect changes ____________ subgroups.
A. Within
B. Between
C. In the sizes of
D. None of these
The chi-square goodness of fit is _________ a one-tailed test with the rejection region
in the right tail.
A. always
B. sometimes
C. never
Which of the following is not an assumption for one-way analysis of variance?
A. The p populations of values of the response variable associated with the treatments
have equal variances.
B. The samples of experimental units associated with the treatments are randomly
selected.
C. The experimental units associated with the treatments are independent samples.
D. The number of sampled observations must be equal for all p treatments.

E. The distribution of the response variable is normal for all treatments.
A manufacturing company produces part 2205 for the aerospace industry. This
particular part can be manufactured using 3 different production processes. The
management wants to know if the quality of the units of part 2205 is the same for all
three processes. The production supervisor obtained the following data: Process 1 had
29 defective units in 240 items, Process 2 produced 12 defective units in 180 items, and
Process 3 manufactured 9 defective units in 150 items. At a significance level of .05, we
performed a chi-square test to determine whether the quality of the items produced
appears to be the same for all three processes. What is the null hypothesis?
A. H0: The number of defectives produced is independent of the production process
used.
B. H0: The row and column variables are associated with each other.
C. H0: The proportion of defective units produced by the three production processes is
the same.
D. Both H0: The number of defectives produced is independent of the production
process used and H0: The proportion of defective units produced by the three
production processes is the same are correct or at least acceptable ways of stating the
null hypothesis.
E. H0: The number of defectives produced is independent of the production process
used, H0: The row and column variables are associated with each other, and H0: The
proportion of defective units produced by the three production processes is the same are
all acceptable ways of stating the null hypothesis.

An investigator hired by a client suing for sex discrimination has developed a multiple
regression model for employee salaries for the company in question. In this multiple
regression model, the salaries are in thousands of dollars. For example, a data entry of
35 for the dependent variable indicates a salary of $35,000. The indicator (dummy)
variable for gender is coded as X1 = 0 if male and X1 = 1 if female. The computer
output of this multiple regression model shows that the coefficient for this variable (X1)
is -4.2. The t test showed that X1 was significant at α = 0.1. This result implies that for
male and female workers of the company,
A. On the average, females earn $4200 less.
B. On the average, males earn $4200 less.
C. On the average, salaries do not differ.
D. On the average, males have 4.2 more years of experience.
E. On the average, females have 4.2 more years of experience.
Given the regression model y = β0 + β1x1 + β2x2 + β3x12 + β4x22 + ε, if we wish to test
the significance of higher-order terms (x12 and x22), we would use the following test.
A. Overall F test
B. Durbin-Watson test
C. Partial F test
D. t test
E. Cook’s distance measure
For a manufacturing process, = 10 inches, = .4 inches, and the subgroup sample
size is 6 units. Calculate the standard control limits for the R chart.
A. 0 and .846
B. 0 and .802
C. 0 and .77
D. 0 and 1.0
E. -.09 and .89
The ____________ assumption requires that all variation around the regression line
should be equal at all possible values (levels) of the independent variable.
A. Normality
B. Control variation
C. Constant variance
D. Independence
In multiple regression analysis, the mean square regression divided by mean square
error yields the _________.
A. Standard error
B. F statistic
C. R2
D.
E. t statistic
If successive values of the residuals are close together, then there is a ___________
autocorrelation, and the value of the Durbin-Watson statistic is _________.
A. Negative, large
B. Positive, small
C. Negative, small
D. Positive, large
When computing individual confidence intervals using the t statistic, for all possible
pairwise comparisons of means, the experimentwise error rate will be:
A. Equal to α.
B. Less than α.
C. Greater than α.
A ______________________ measures the strength of the relationship between a
dependent variable (Y) and an independent variable (X).
A. Coefficient of determination
B. Correlation coefficient
C. Slope
D. Standard error
In regression analysis, the standard error (s) is _________ greater than the standard
deviation of y (the dependent variable).
A. Always
B. Sometimes
C. Never

How well a product or service performs in the marketplace is called:
A. Process capability.
B. Quality of conformance.
C. Quality of performance.
D. Quality of design.
E. Process control.
All of the following are assumptions of the error terms in the simple linear regression
model except:
A. Errors are normally distributed.
B. Error terms have a mean of zero.
C. Error terms have a constant variance.
D. Error terms are dependent on each other.
The ____________________ is the proportion of the total variation in the dependent
variable explained by the regression model.
A. Coefficient of determination

B. Correlation coefficient
C. Slope
D. Standard error
The Durbin-Watson test statistic ranges from:
A. -4 to 4
B. 0 to 4
C. 0 to 3
D. -1 to 1
E. 0 to 1
The least squares regression line minimizes the sum of the:
A. Differences between actual and predicted Y values.
B. Absolute deviations between actual and predicted Y values.
C. Absolute deviations between actual and predicted X values.
D. Squared differences between actual and predicted Y values.
E. Squared differences between actual and predicted X values.

A systematic method for analyzing process data in which we monitor process variation
is called ______________.
A. control charting
B. sigma level capability
C. statistical process control
D. rational subgrouping
The primary use of stepwise regression is to identify the most important ___________
that should be included in the multiple regression model.
A. Independent variables
B. Dependent variables
C. Dummy variables
D. Quadratic variables

How well a product or a service performs in the marketplace is called the quality of
______________.
A. performance
B. conformance
C. design
D. control
In using a regression model, if a new independent variable is added, the value of R2 (the
coefficient of multiple determination) will ___________ decrease.
A. Always
B. Sometimes
C. Never
Which one of the following is not an assumption of one-way analysis of variance?
A. Random selection of samples from each population.
B. Equality of the population variances.
C. Equality of the population means.
D. Samples selected from each treatment population all have normal distributions.

In simple regression analysis, if the correlation coefficient is a positive value, then:
A. The Y intercept must also be a positive value.
B. The coefficient of determination can be either positive or negative, depending on the
value of the slope.
C. The least squares regression equation could either have a positive or a negative
slope.
D. The slope of the regression line must also be positive.
E. The standard error of estimate can have either a positive or a negative value.
In multiple regression analysis, a desirable residual plot has what type of appearance?
A. Curved
B. Cyclical
C. Fanning out
D. Funneling in
E. Horizontal band
If the Durbin-Watson statistic is greater than (4 – dL), then we conclude that:
A. There is significant positive autocorrelation.
B. There is significant negative autocorrelation.
C. There is significant autocorrelation, but we cannot identify whether it is positive or
negative.
D. The test result is inconclusive.
A powder metal manufacturing company is producing sleeves for a locking mechanism.
The target (nominal) value for the inside diameter is 1 inch. The inside diameter
specifications are 1 .005 inches. Assume that the process is in statistical control with
= 1.0002 inches, = .003 inches, and subgroup size of 5. Calculate the control
limits for the chart.
A. .99781 to 1.00219
B. .99801 to 1.00238
C. .99830 to 1.00713
D. .99847 to 1.00193
E. .995 to 1.005

Dummy variables take on the values of _________ and are used to model the effects of
different levels of qualitative variables.
A. 1 or -1
B. 1 or 2
C. 0 or 2
D. 0 or 1
How well the design of a product or service meets and exceeds the needs and
expectations of the customer is called:
A. Process capability.
B. Quality of conformance.
C. Quality of performance.
D. Quality of design.
E. Process control.
The ___________ the r2, and the __________ the s (standard error), the stronger the
relationship between the dependent variable and the independent variable.
A. Higher, lower
B. Lower, higher
C. Lower, lower
D. Higher, higher
An experiment consists of 400 observations and four mutually exclusive groups. If the
probability of a randomly selected item being classified into any of the four groups is
equal, then the expected number of items that will be classified into group 1 is _____.
A. 25
B. 100
C. 125
D. 150
A powder metal manufacturing company is producing sleeves for a locking mechanism.
The target (nominal) value for the inside diameter is 1 inch. The inside diameter
specifications are 1 .005 inches. Assume that the process is in statistical control with
= 1.0002 inches, = .003 inches, and subgroup size of 5. What is the sigma level
capability for this process?
A. 3.0
B. 3.72
C. 1.6
D. 1.0
E. 2.72
Which of the following is a violation of the independence assumption?
A. Negative autocorrelation
B. A pattern of cyclical error terms over time
C. Positive autocorrelation
D. A pattern of alternating error terms over time
E. All of these
An acceptable residual plot exhibits:
A. Increasing error variance.
B. Decreasing error variance.
C. Constant error variance.
D. A curved pattern.
E. A mixture of increasing and decreasing error variance.
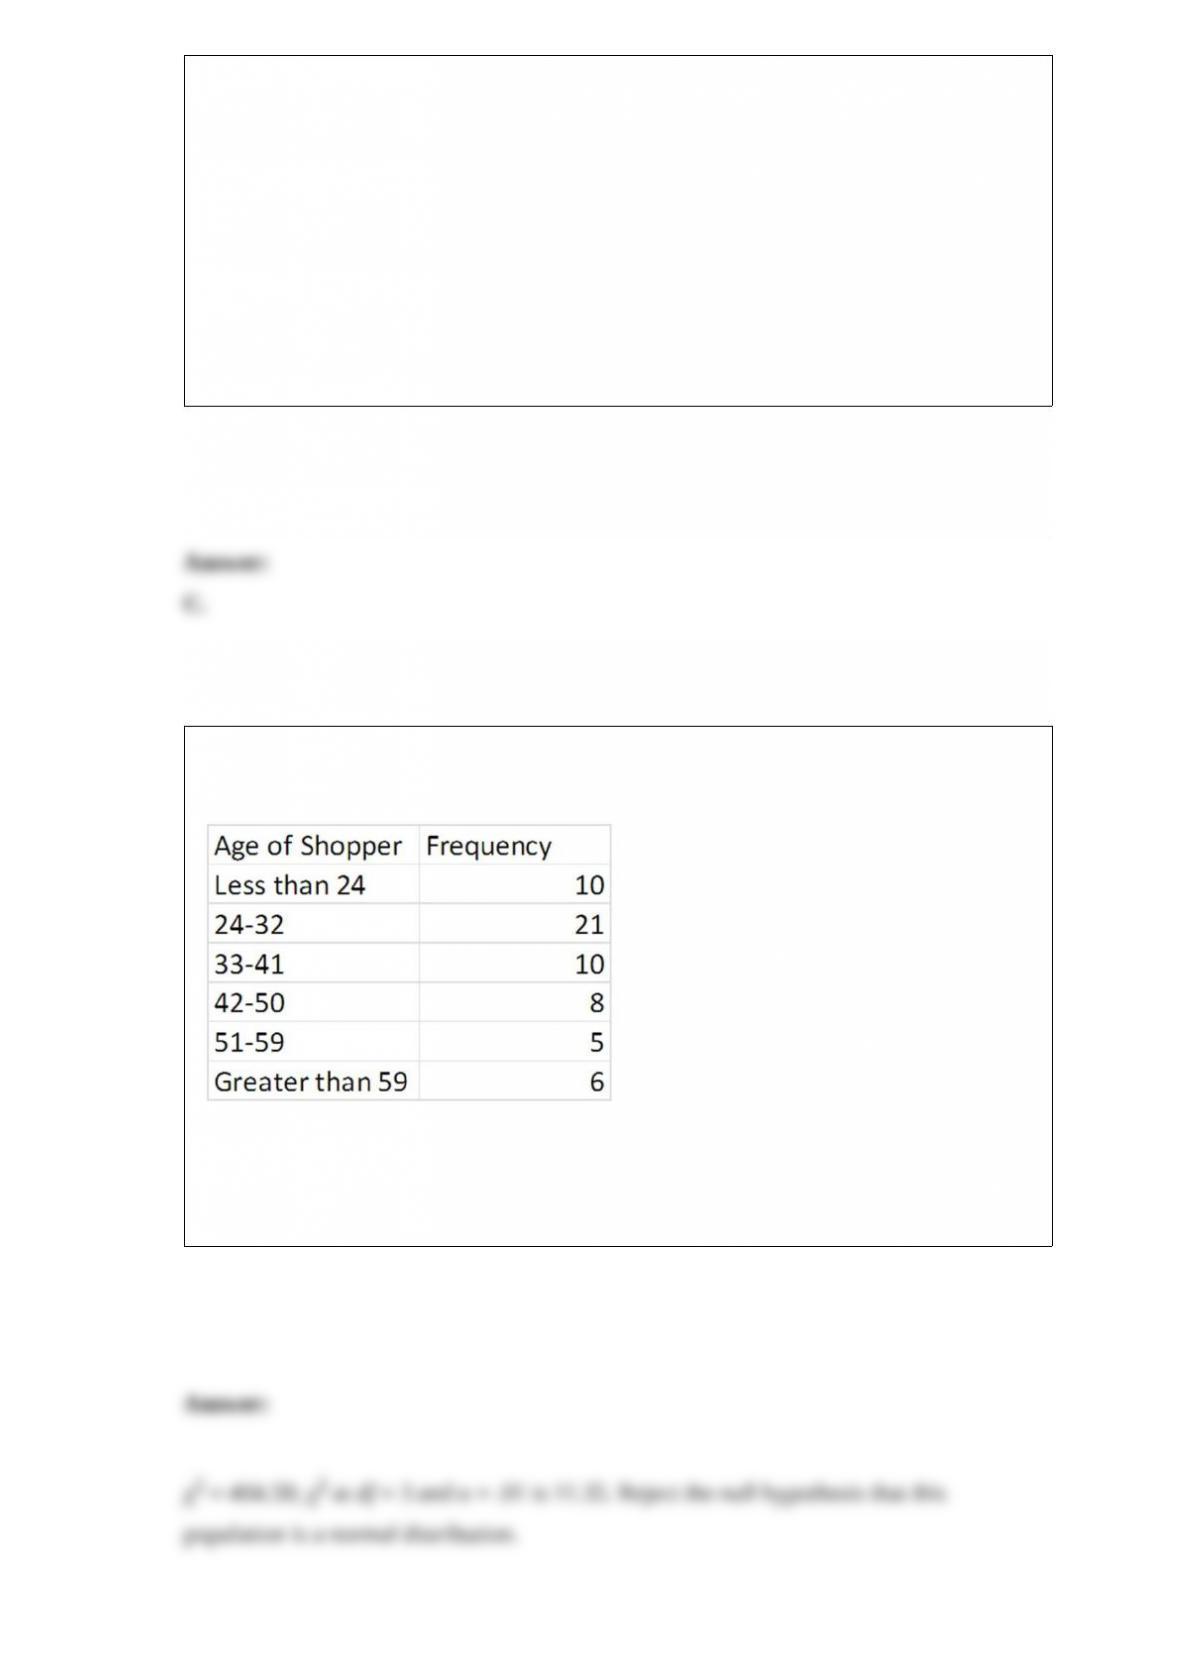
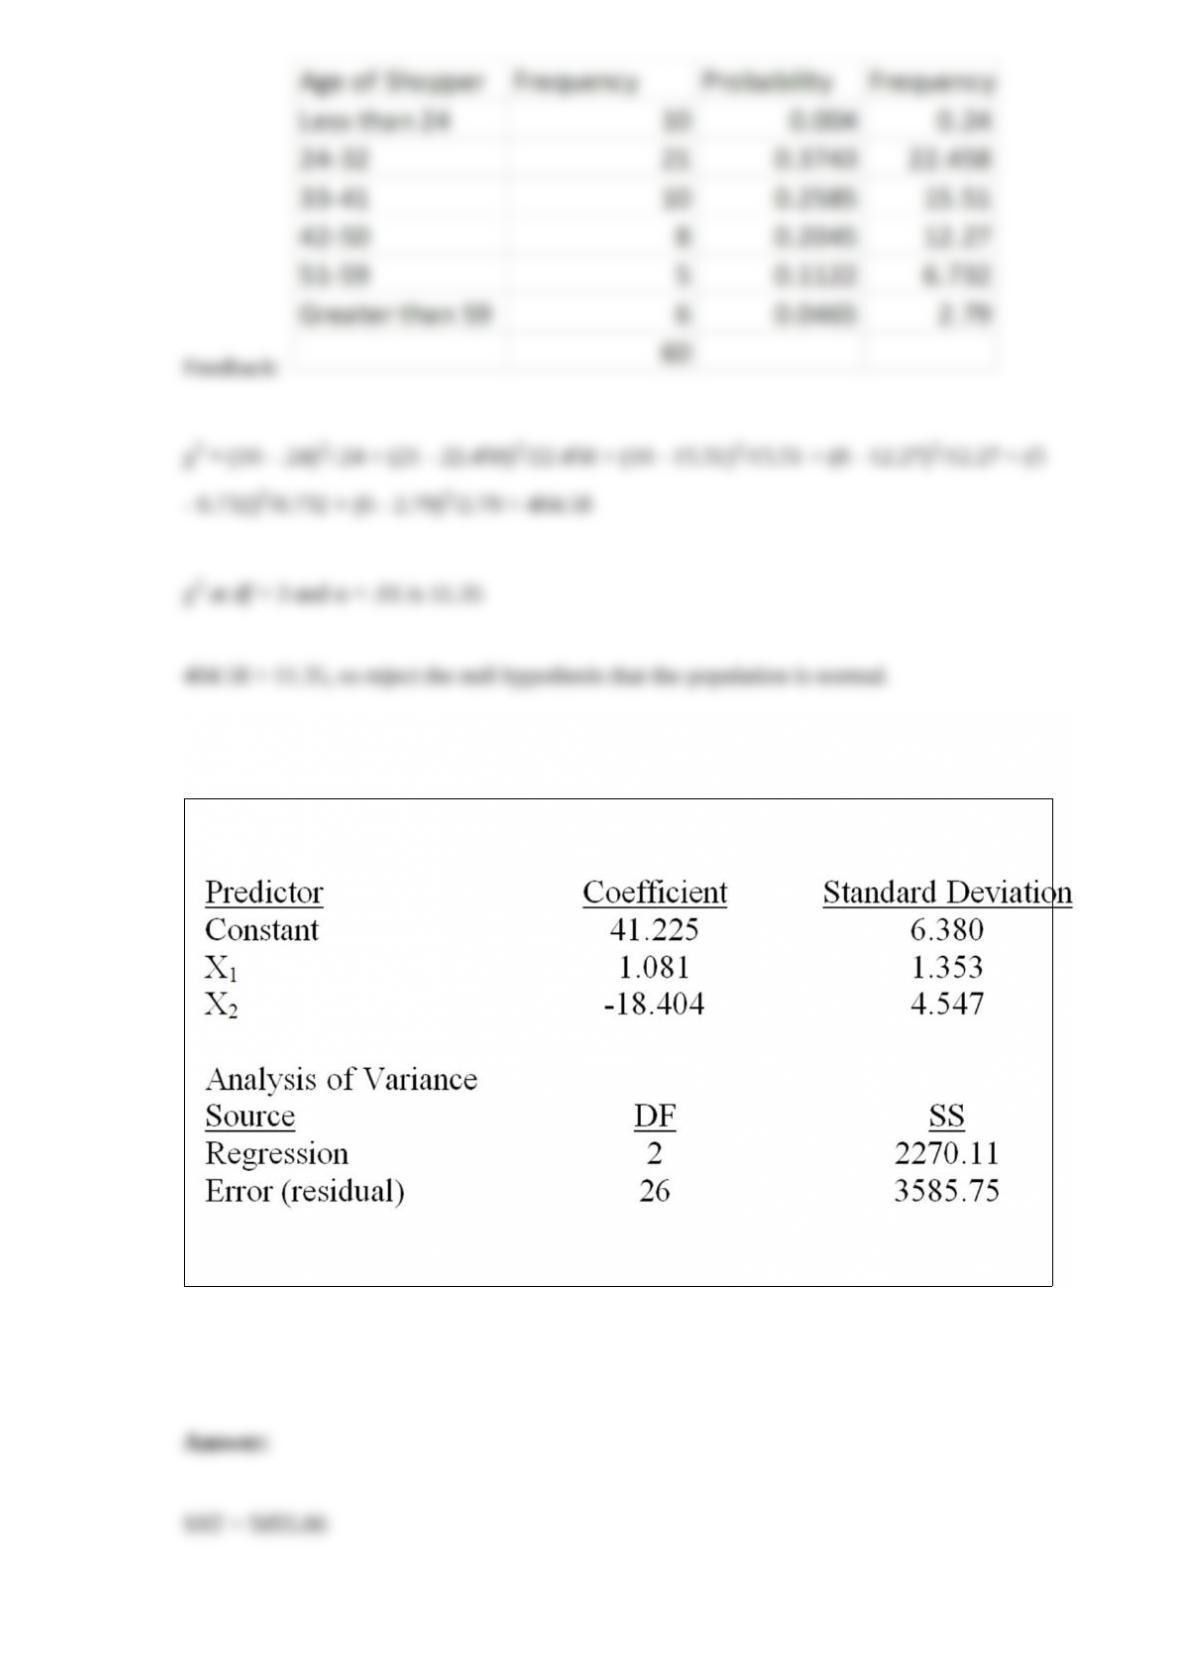
The following frequency table summarizes the ages of 60 shoppers at the local grocery
store.
The estimated mean is 36.25, and the estimated standard deviation is 13.57. It is desired
to test whether these measurements came from a normal population. At a significance
of .01, test H0: the sample of 60 shoppers came from a normal population.
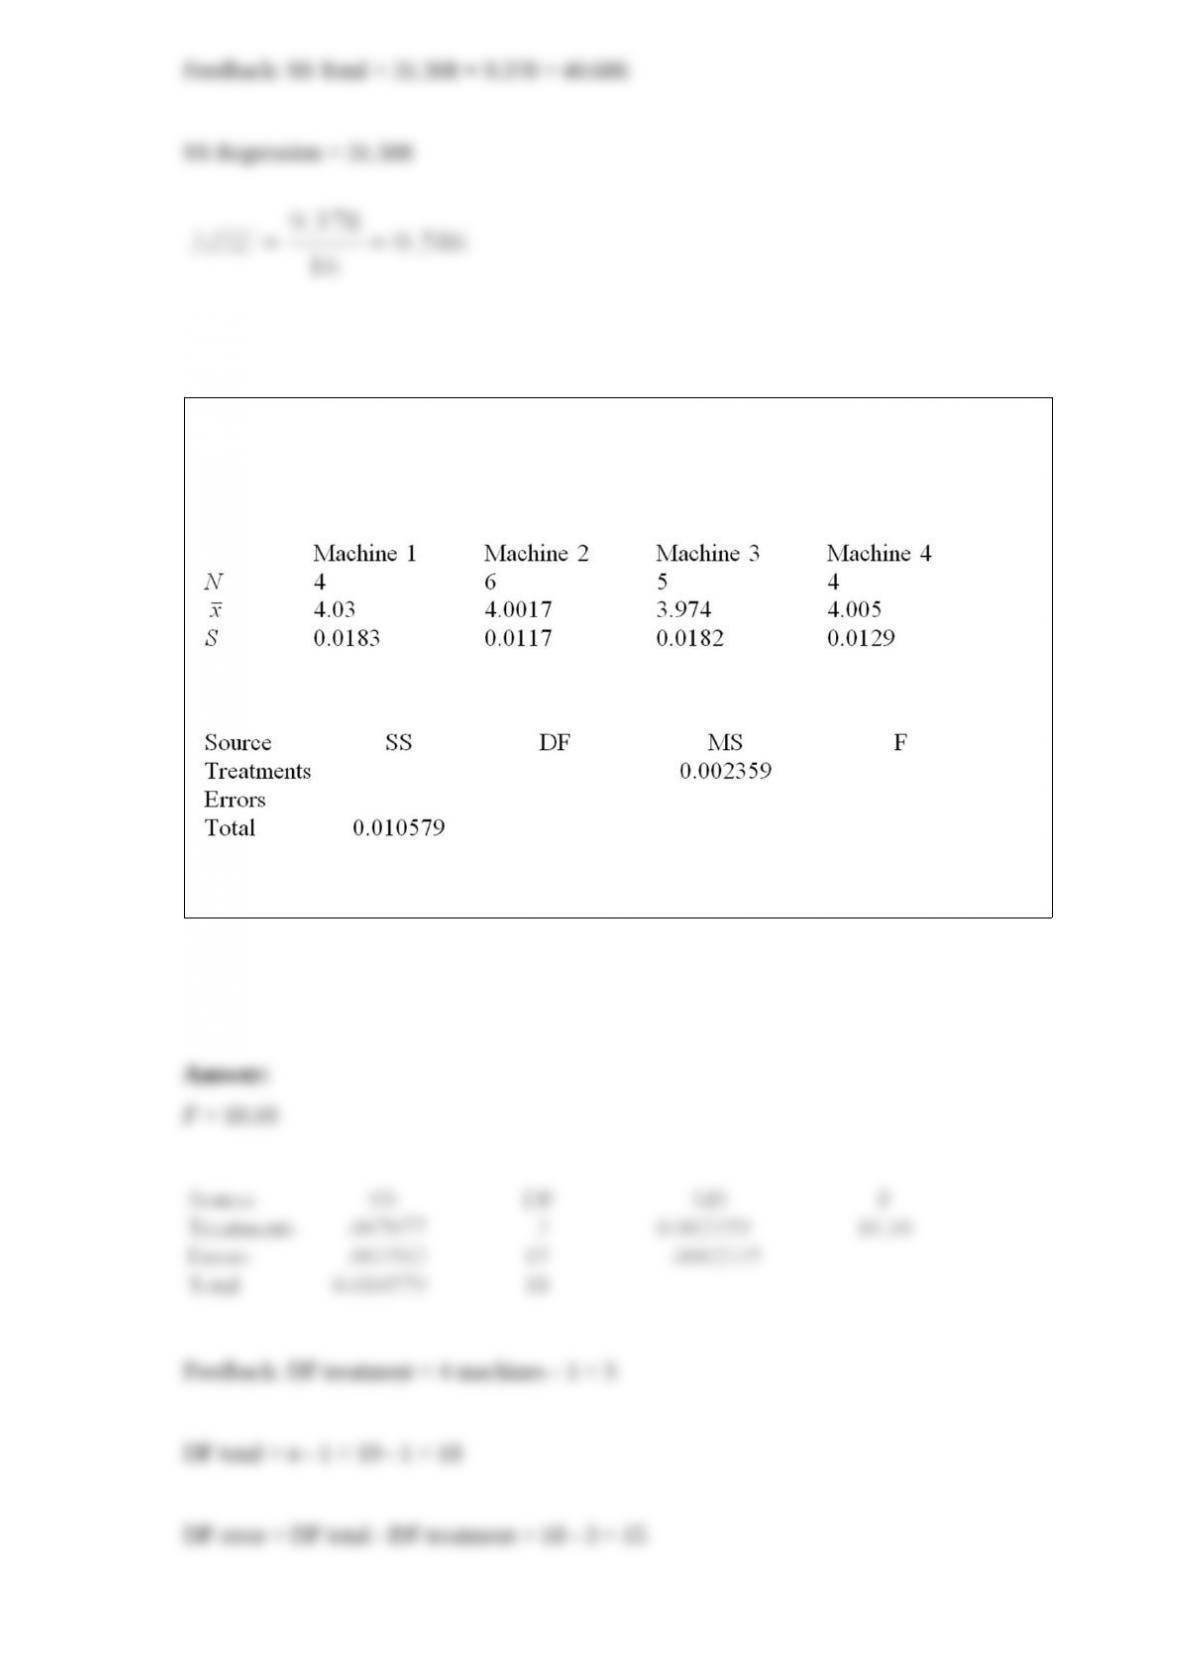
Consider the following partial computer output for a multiple regression model.
What is the total sum of squares?
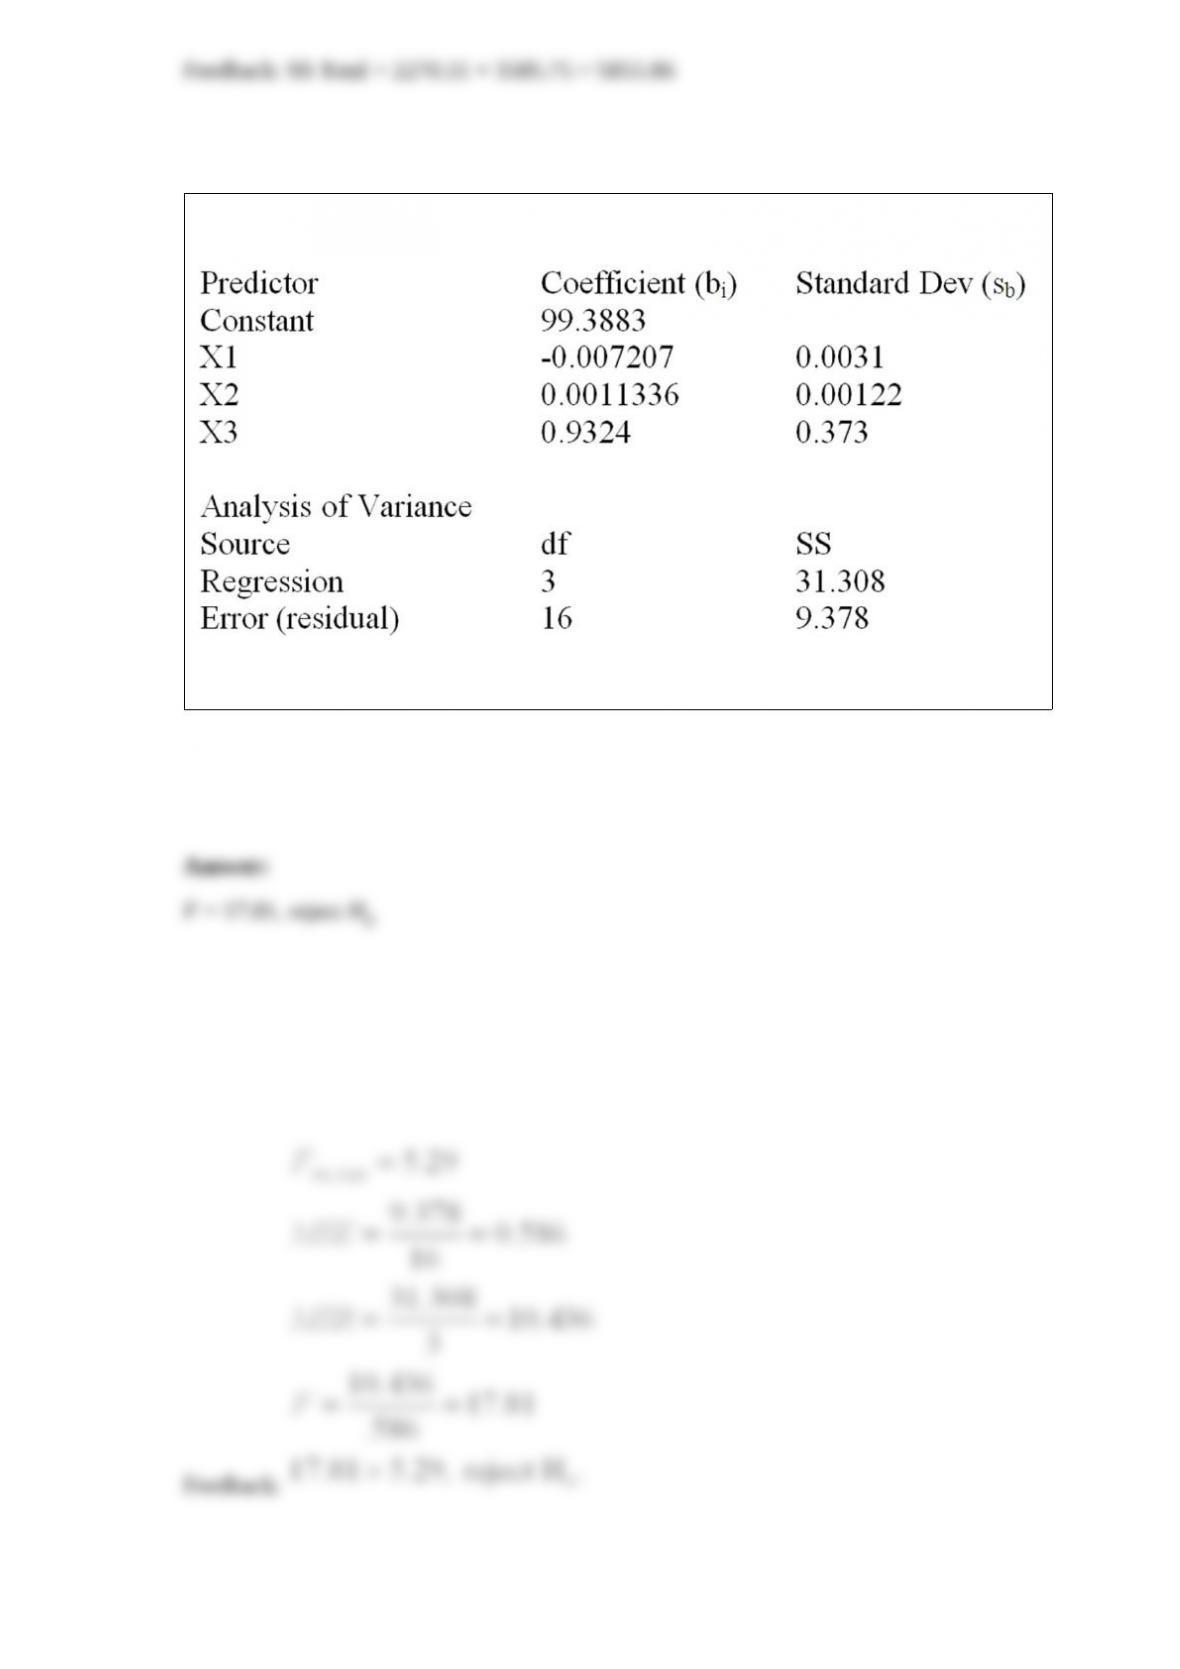
Consider the following partial computer output for a multiple regression model.
Test the overall usefulness of the model at α = .01. Calculate F and make your decision.
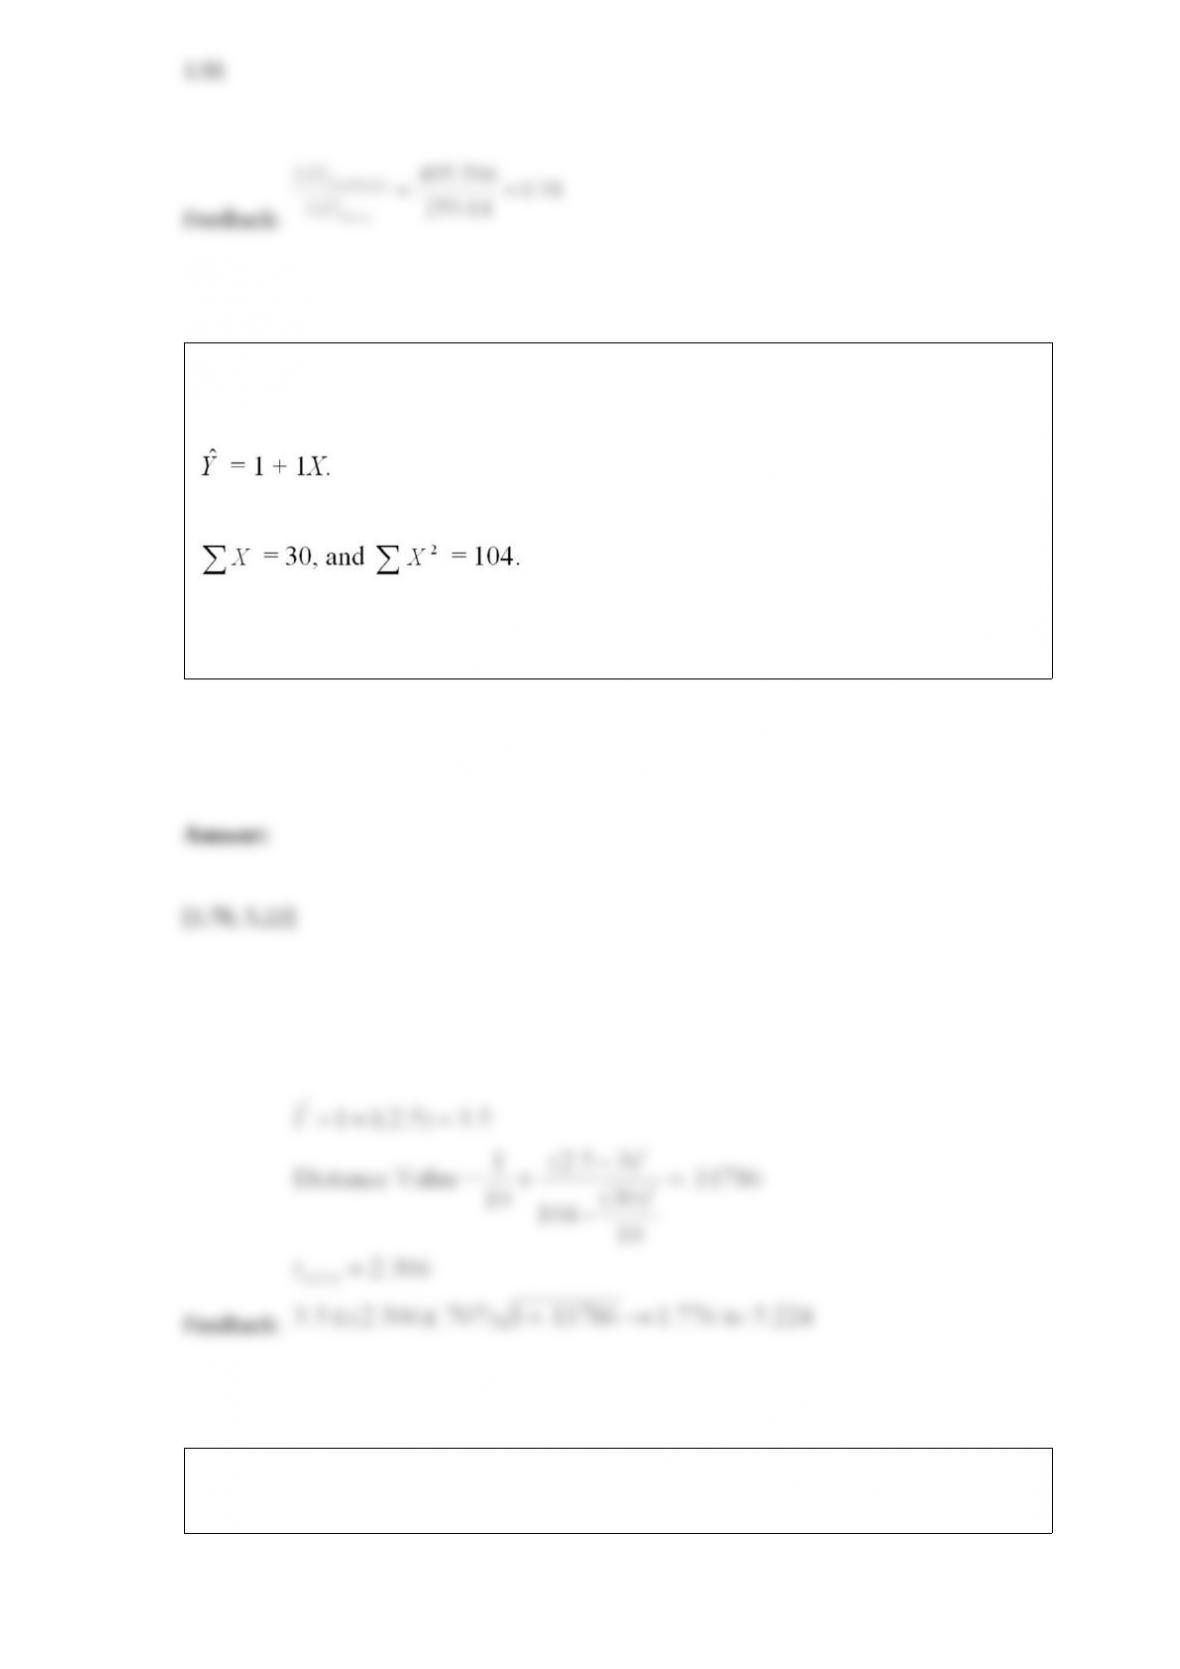
A U.S.-based Internet company offers an online proficiency course in basic accounting.
Completing this online course satisfies the Fundamentals of Accounting course
requirement in many MBA programs. In the first semester, 315 students have enrolled
in the course. The marketing research manager divided the country into seven regions
of approximately equal population. The course enrollment values for each of the seven
regions are given below. The management wants to know if there is equal interest in the
course across all regions.
Assume that H0: p1 = p2 = p3 = p4 = p5 = p6 = p7 is not rejected, and state a
one-sentence managerial conclusion.
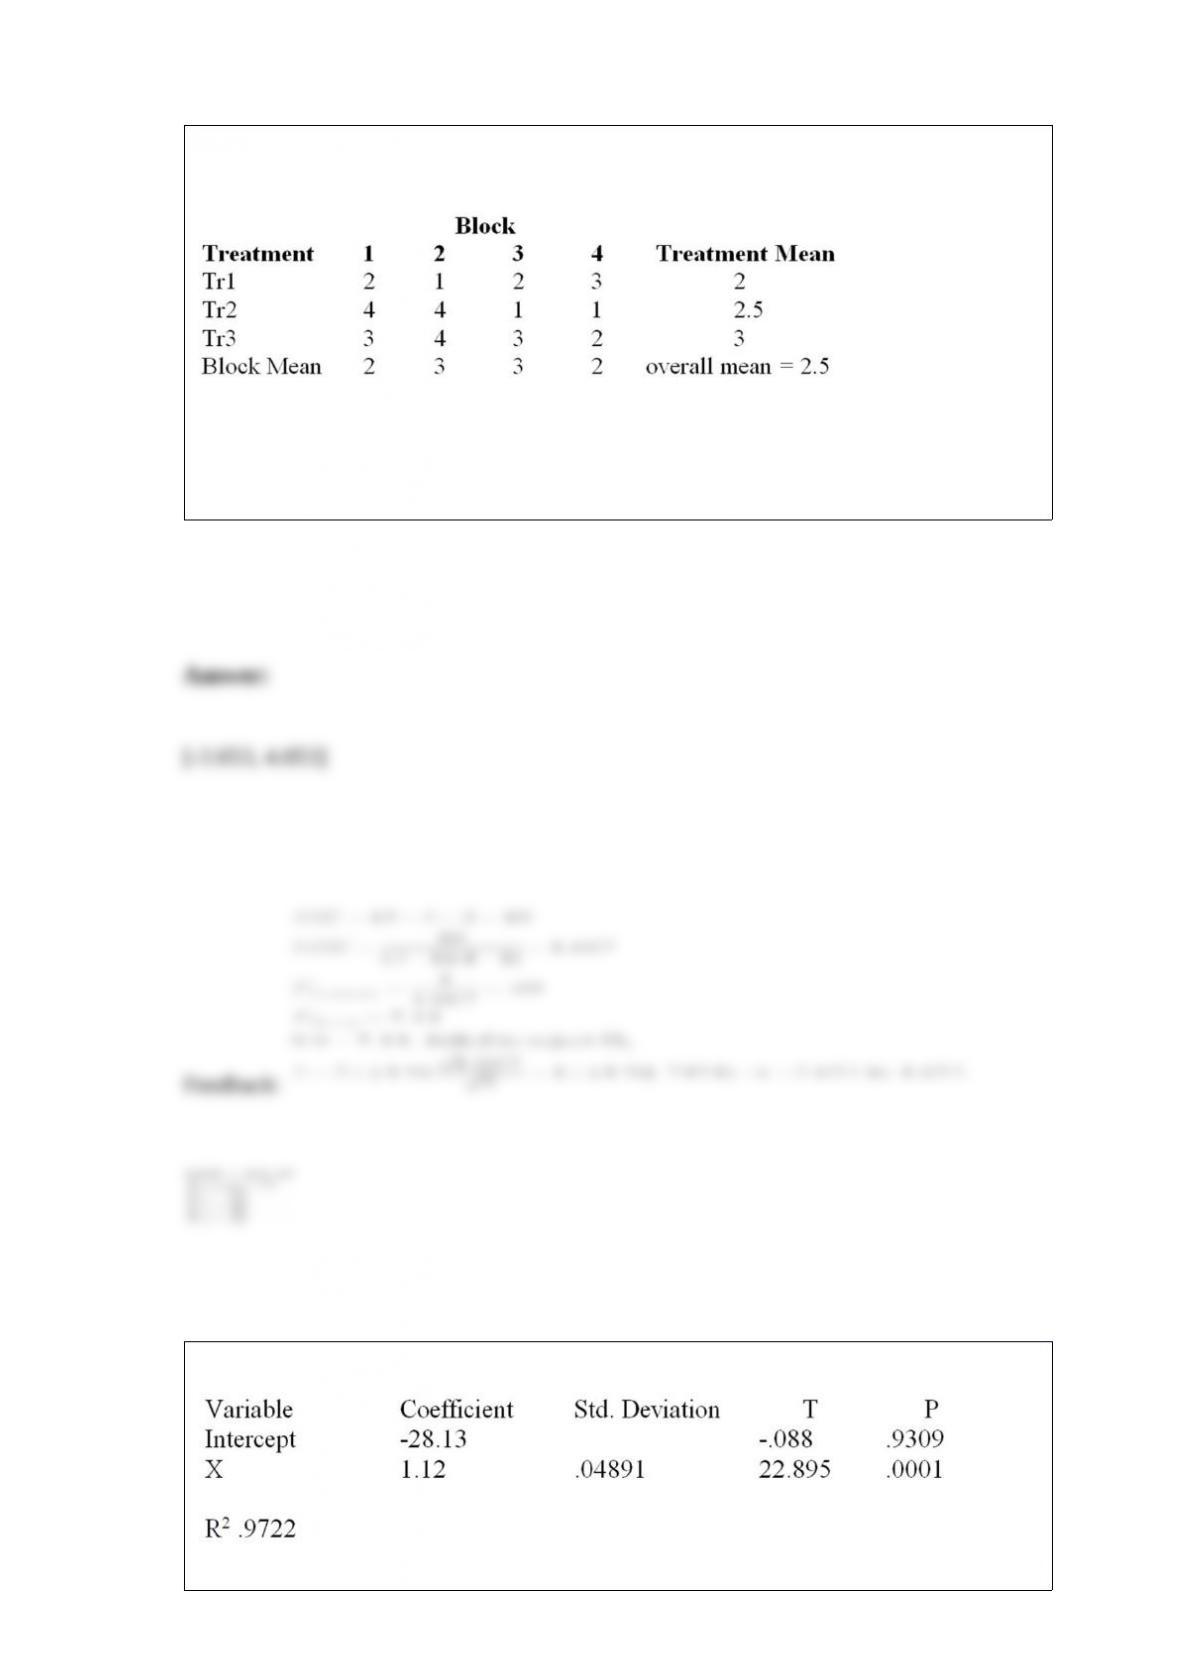
Consider the following partial analysis of variance table from a randomized block
design with 10 blocks and 6 treatments.
What is the calculated F statistic for treatment?
An experiment was performed on a certain metal to determine if the strength is a
function of heating time. Partial results based on a sample of 10 metal sheets are given
below. The simple linear regression equation is
The time is in minutes, the strength is measured in pounds per square inch, MSE = 0.5,
Determine the 95 percent prediction interval for the strength of a metal sheet when the
average heating time is 2.5 minutes.
Consider a two-way analysis of variance experiment with treatment factors A and B.
The results are summarized below.
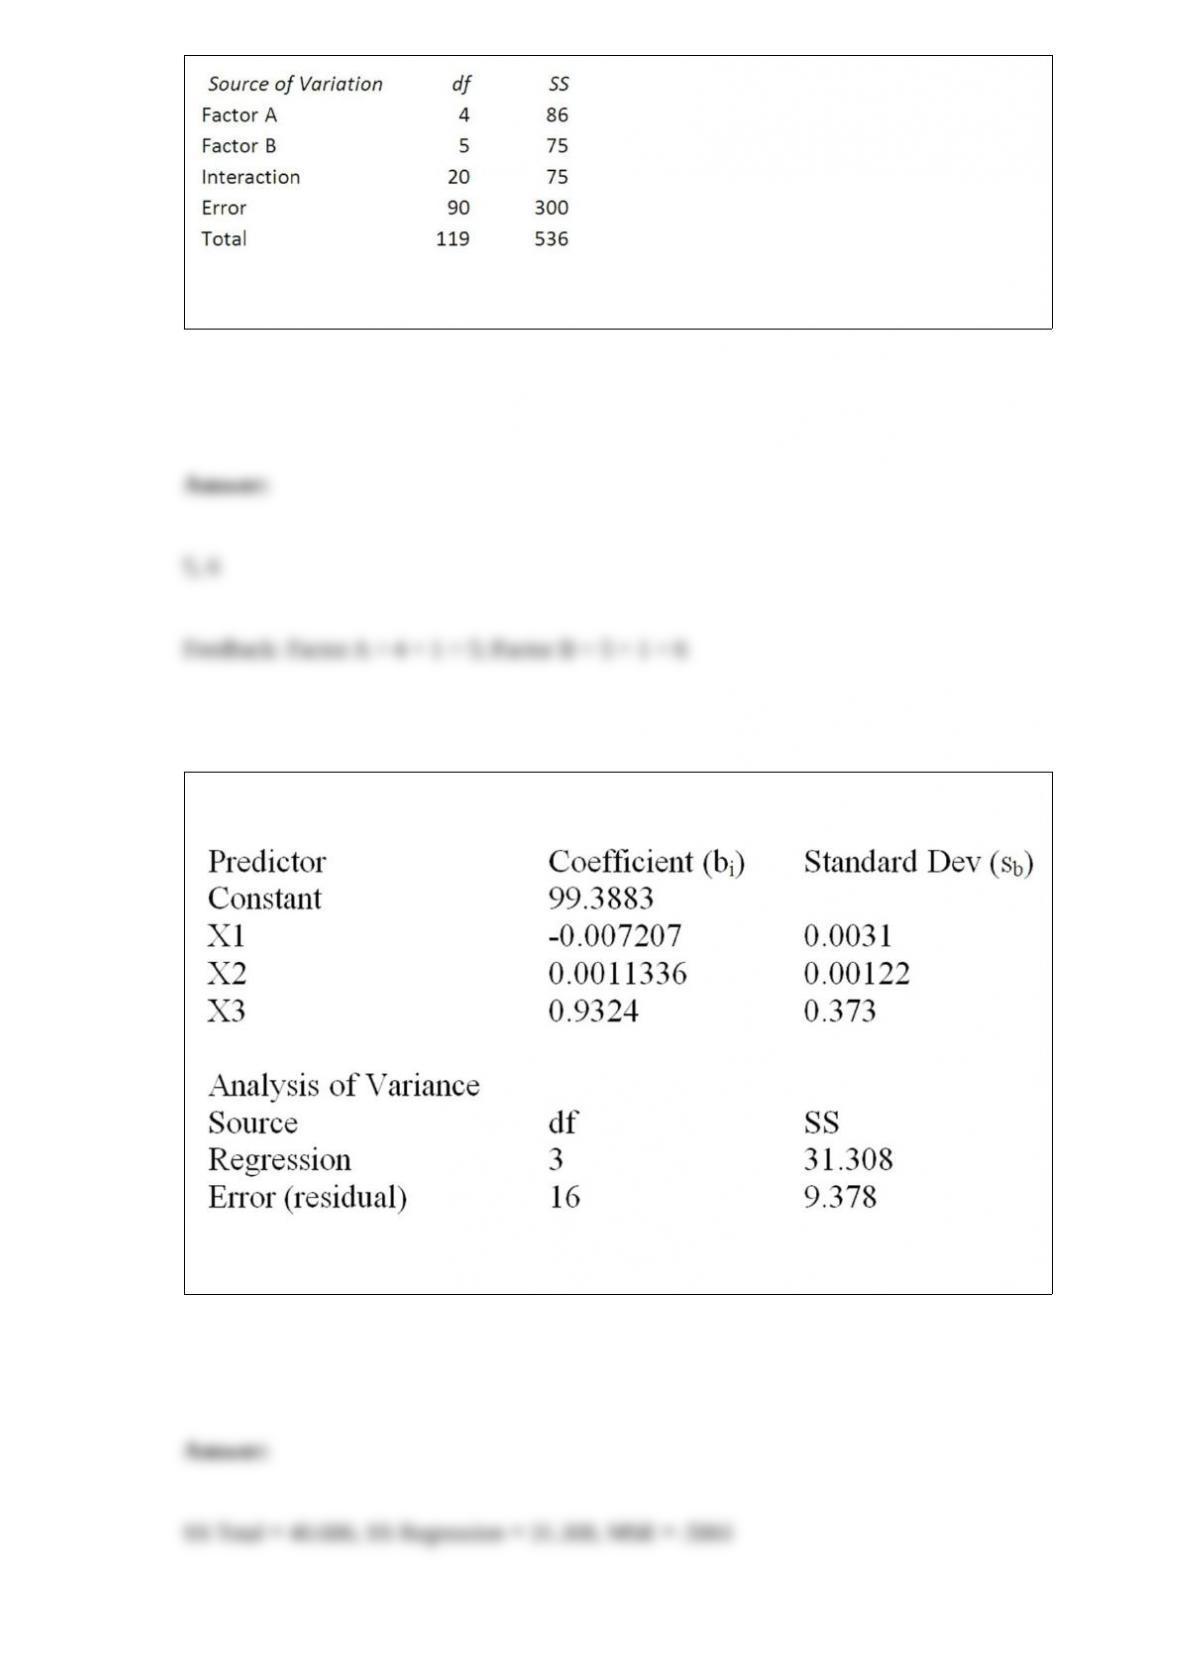
What are the levels of Factor A and Factor B?
Consider the following partial computer output for a multiple regression model.
What is the total sum of squares, explained variation, and mean square error?
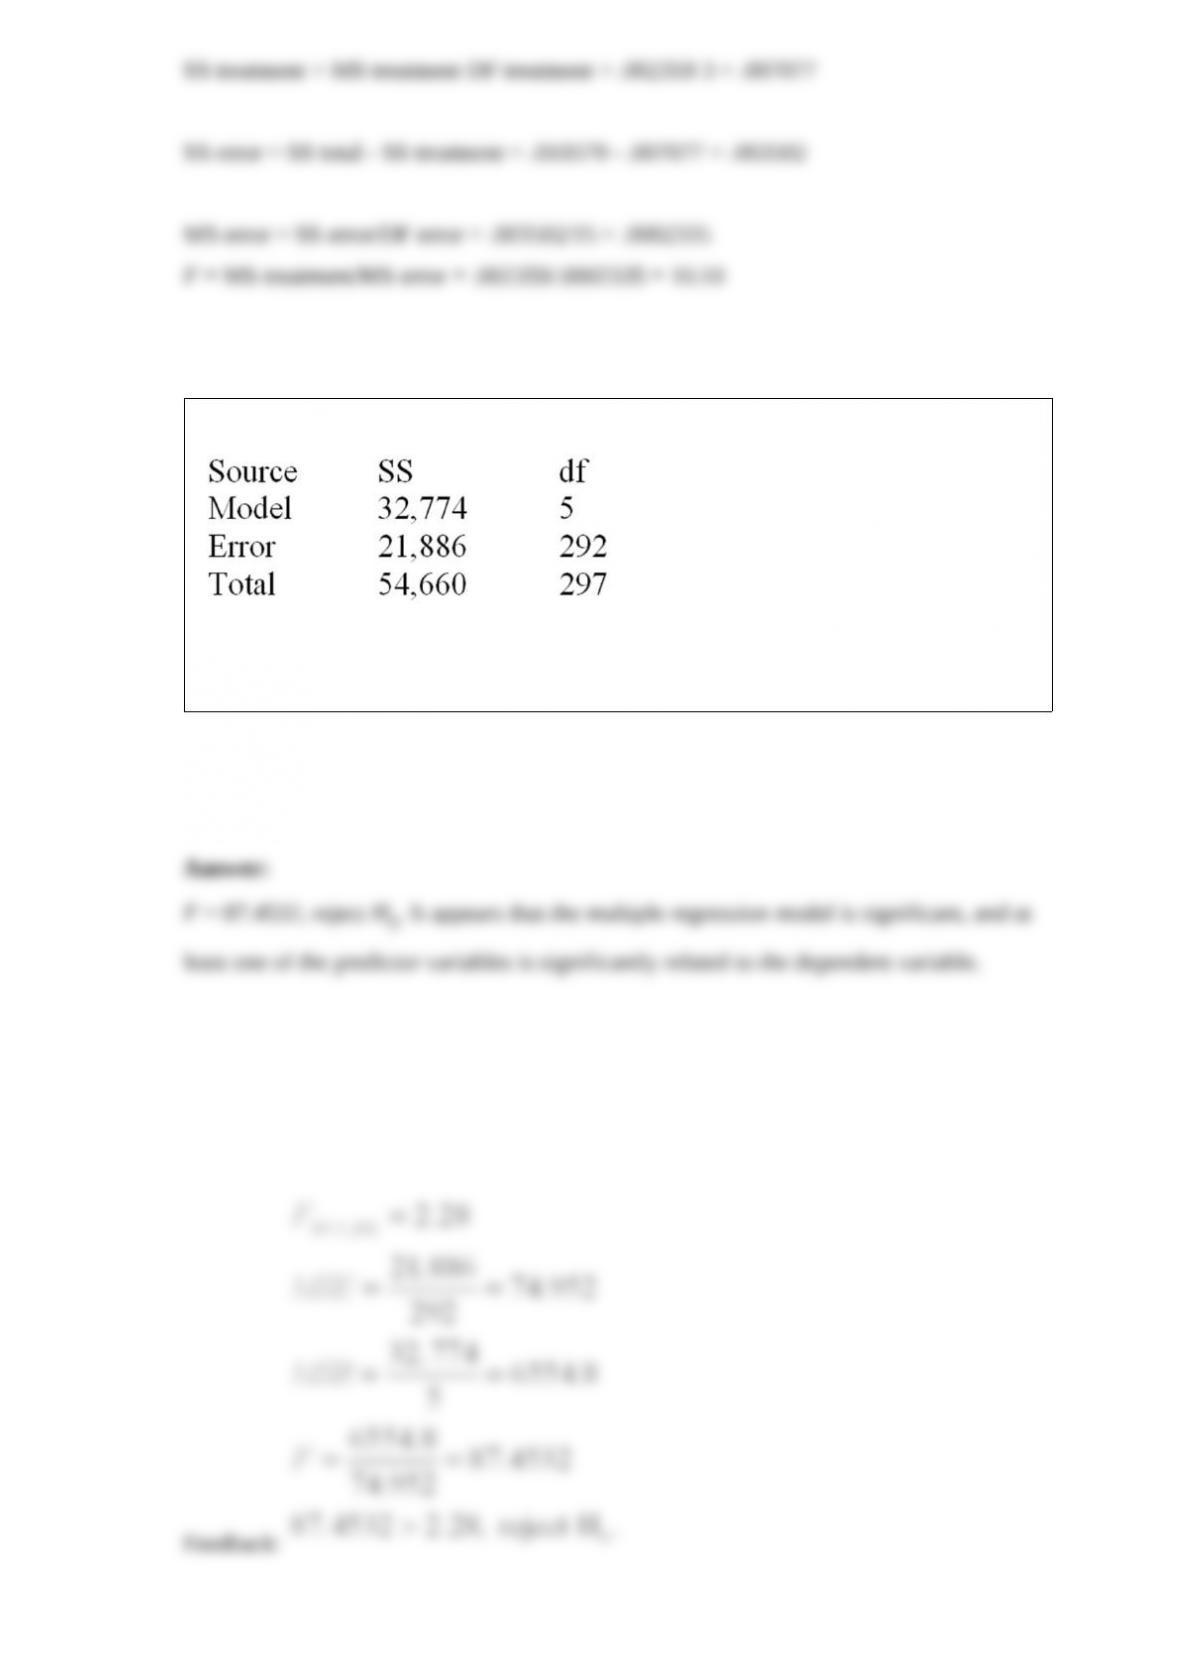
A company that fills gallon containers of water has four machines. The quality control
manager needs to determine whether the average fill for these machines is the same.
Looking at 19 one-gallon containers, we have the following data of fill measures (x) in
quarts.
And the following partial ANOVA table.
Complete the ANOVA table and calculate F.
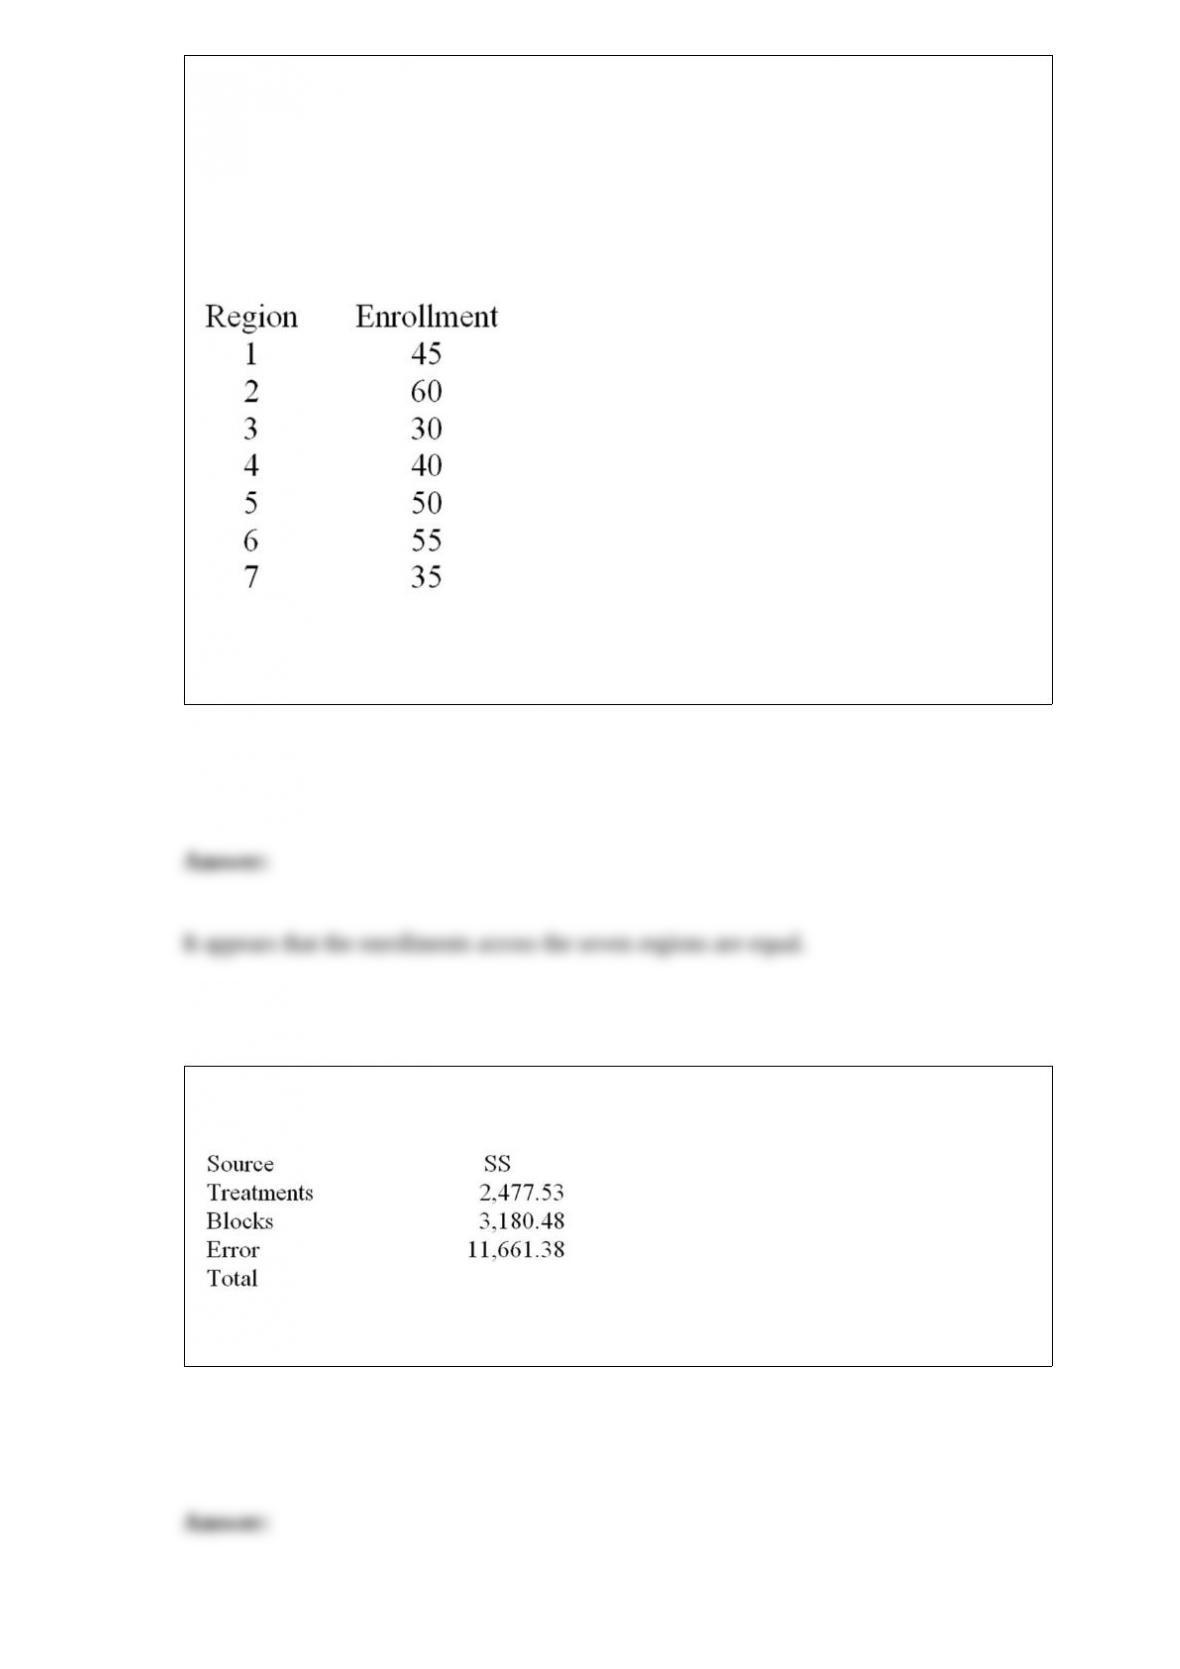
Below is a partial multiple regression computer output.
Test the overall usefulness of the model at α = .01. Calculate the F statistic and make
your decision.
Consider the randomized block design with 4 blocks and 3 treatments given above.
Find the Tukey simultaneous 95 percent confidence interval for the difference between
the means of block 2 and block 4.
Consider the following partial computer output from a simple linear regression analysis.
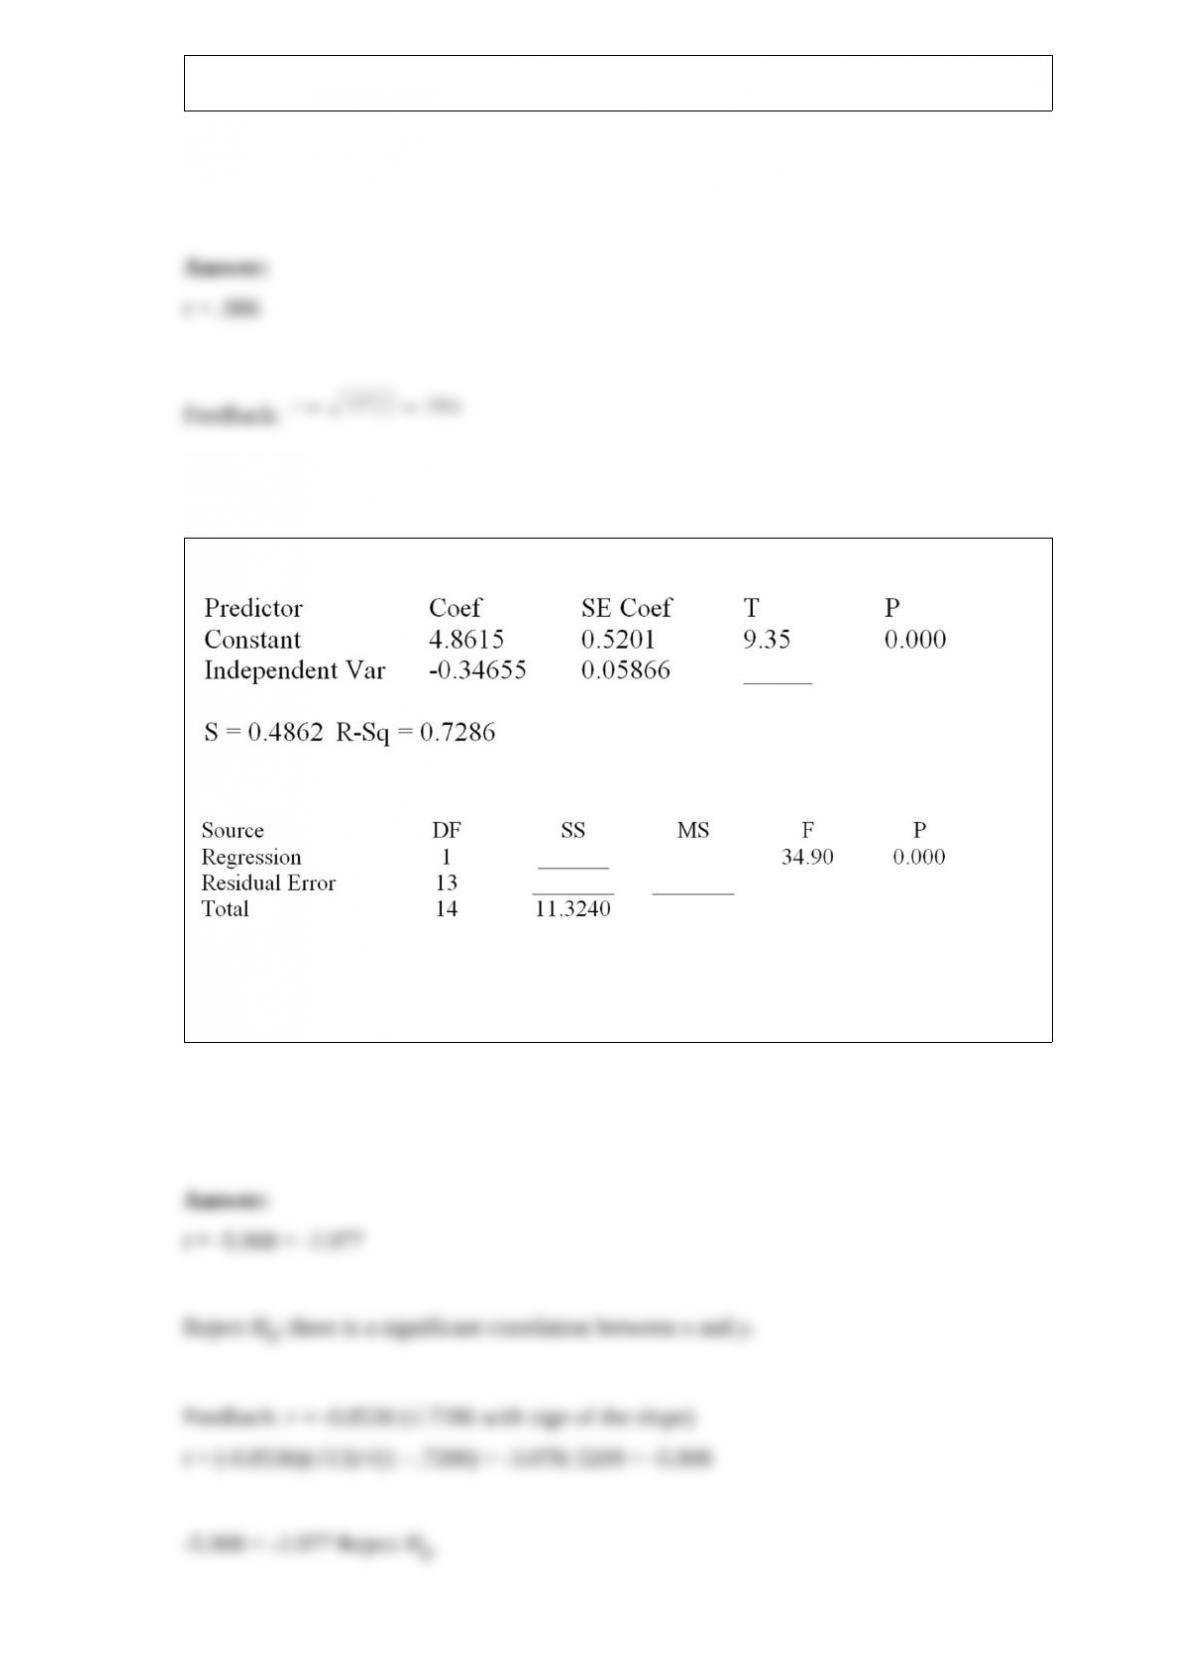
Calculate the correlation coefficient.
Consider the following partial computer output from a simple linear regression analysis.
Analysis of Variance
Test to determine if there is a significant correlation between x and y. Use H0: ρ = 0
versus Ha: ρ ≠ 0 with α = .01. Show the test statistic used in the decision.
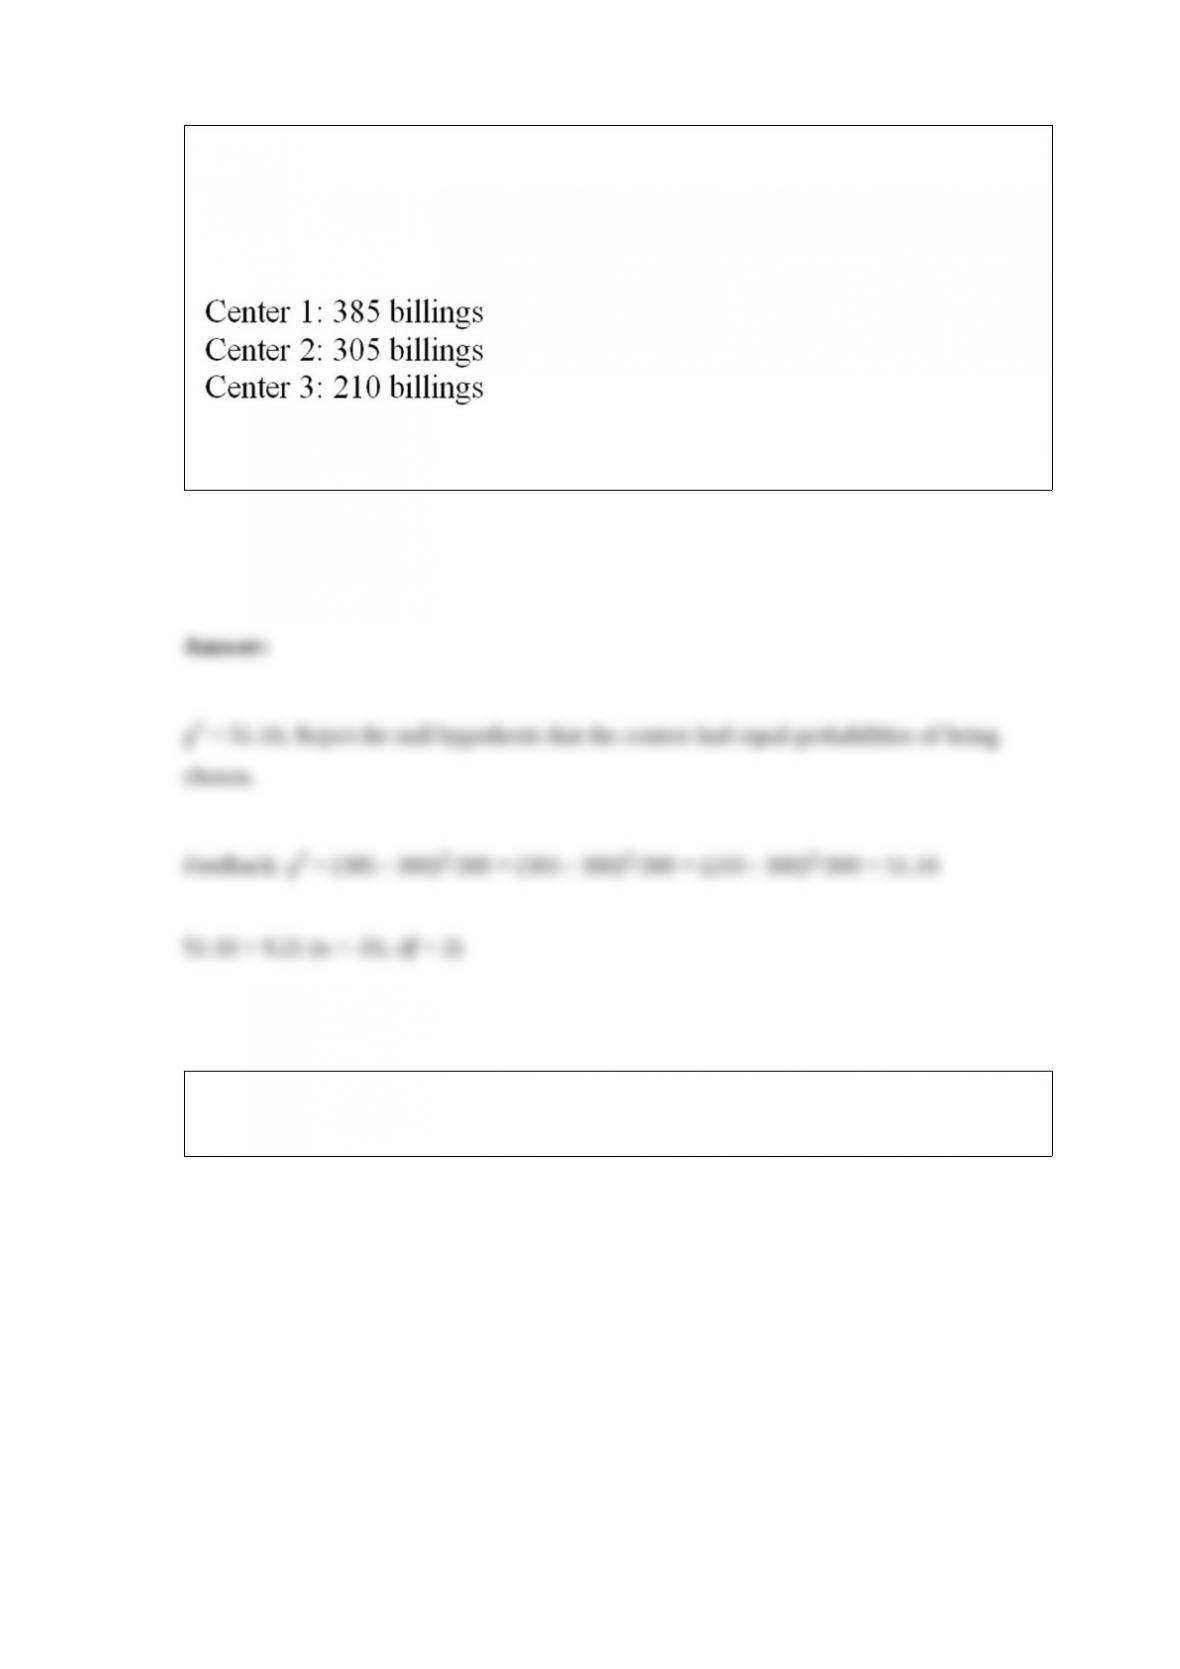
AAA Co. operates distribution centers in the Midwest. Three of their centers were
recently audited to determine if they are in compliance with company standard billing
procedures. According to the auditing firm, a billing had an equal probability of being
from each of the three centers. A random sample of the audited billings had the
following distribution:
Calculate the goodness of fit and determine whether H0 should be rejected at α = .01.
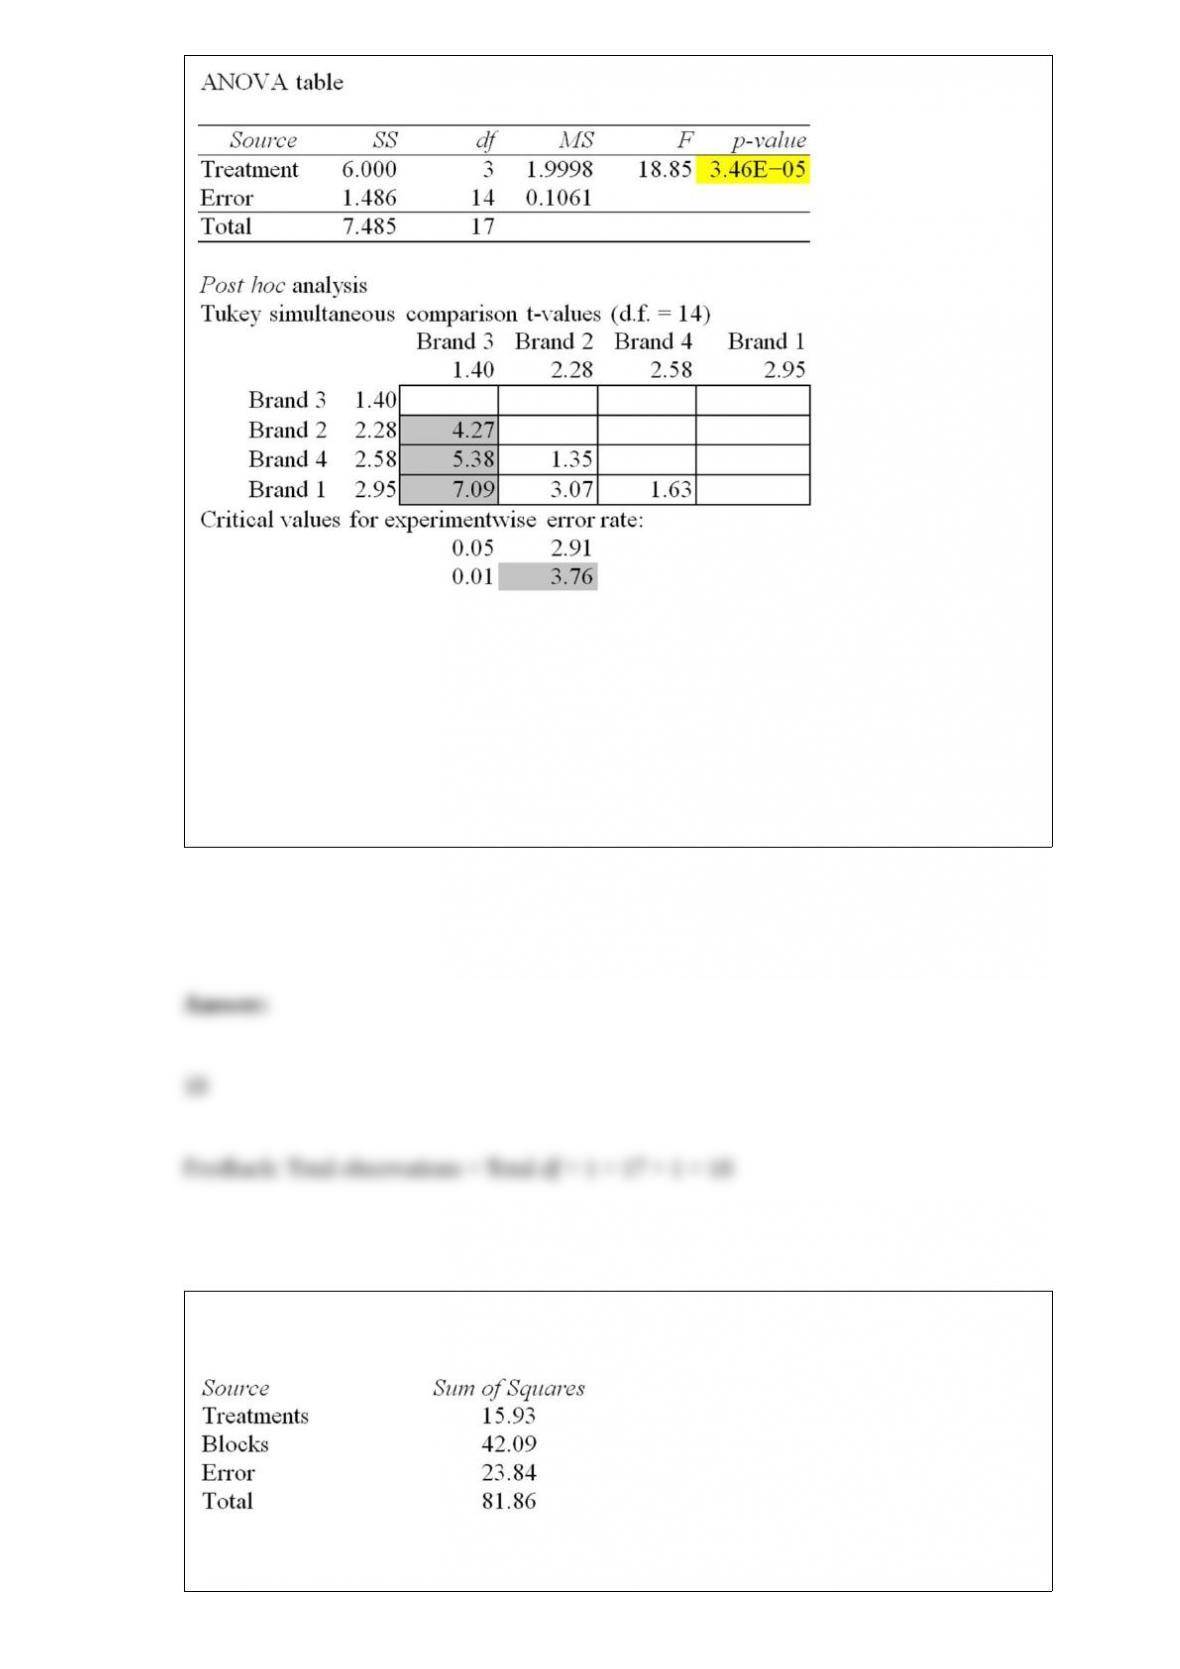
The Excel/MegaStat output given above summarizes the results of a one-way analysis
of variance in an attempt to compare the performance characteristics of four brands of
vacuum cleaners. The response variable is the amount of time it takes to clean a specific
size room with a specific amount of dirt.
What is the total number of observations for all brands of vacuum cleaners (total
sample size)?
Consider the following partial analysis of variance table from a randomized block
design with 6 blocks and 4 treatments.
What is the treatment mean square?
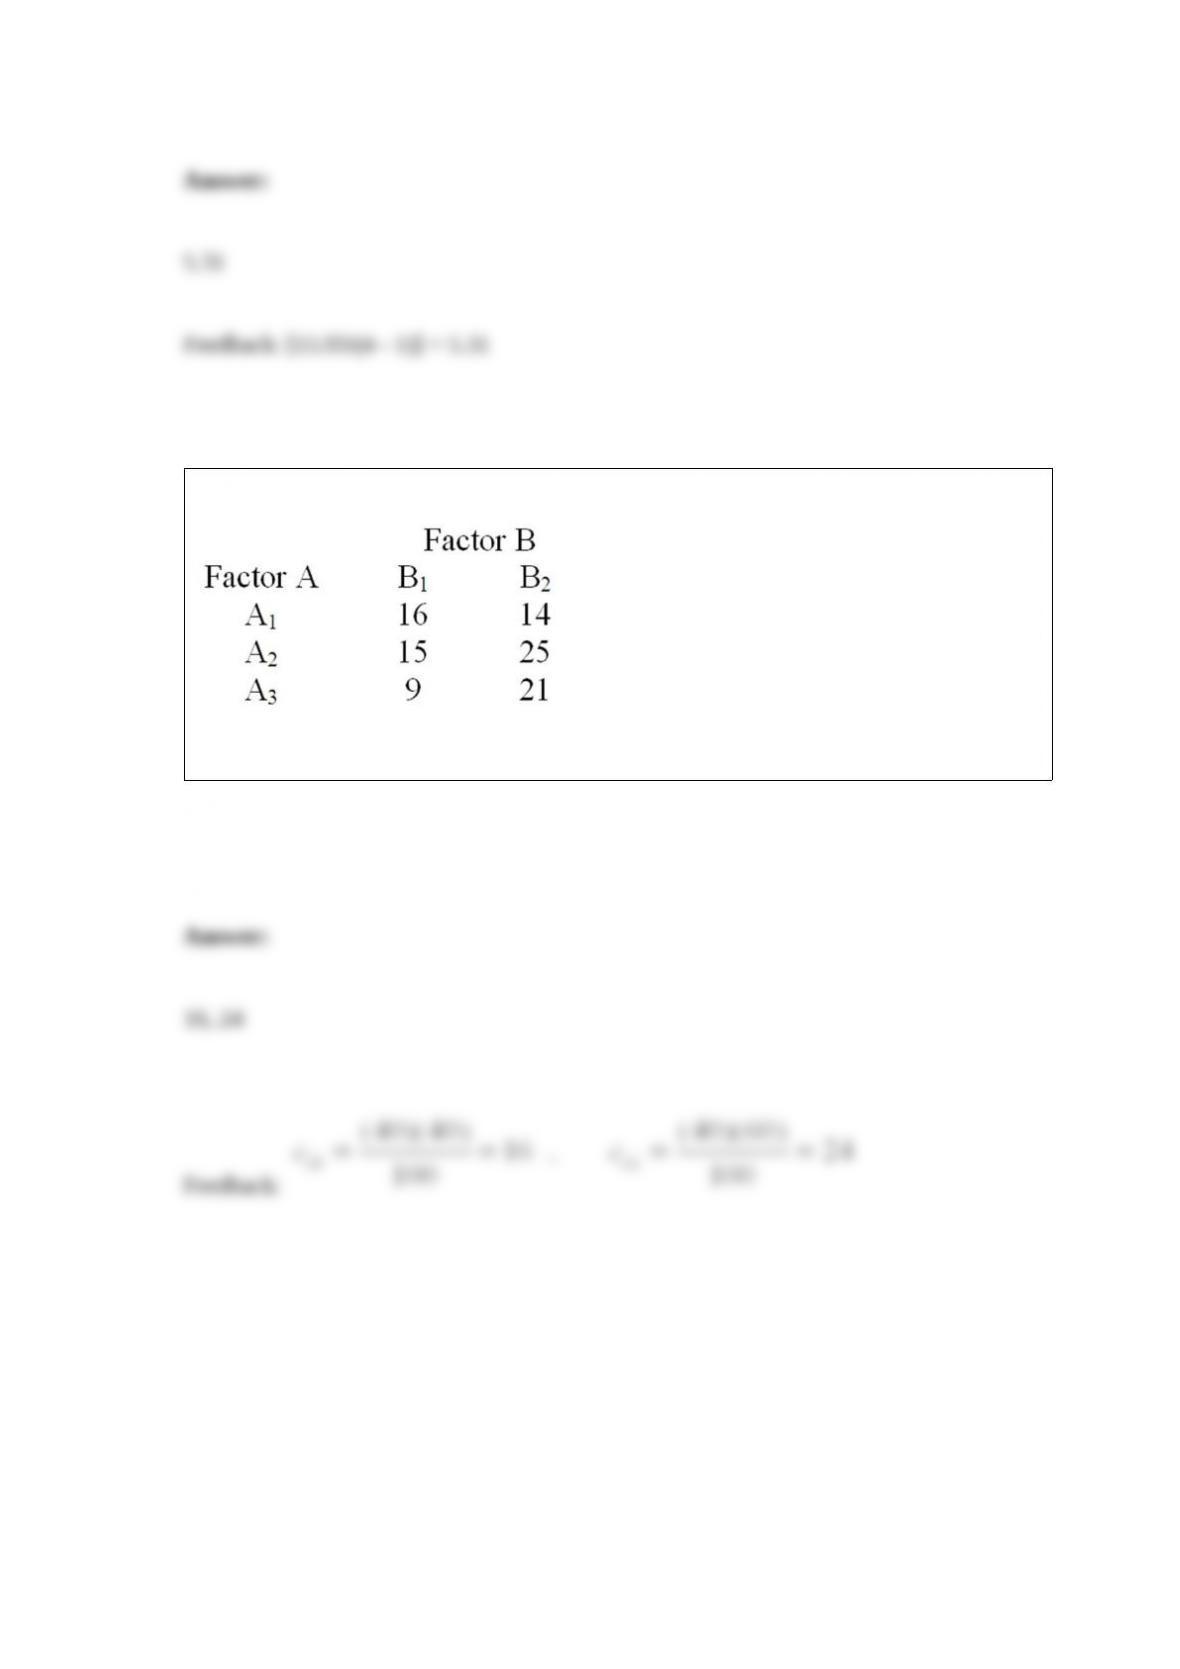
Consider the 3 2 contingency table below.
Compute the expected frequencies in row 2.