Chapter 04: Analysis of Financial Statements
Copyright Cengage Learning. Powered by Cognero.
Page 59
c. 3.77%
d. 3.43%
e. 4.19%
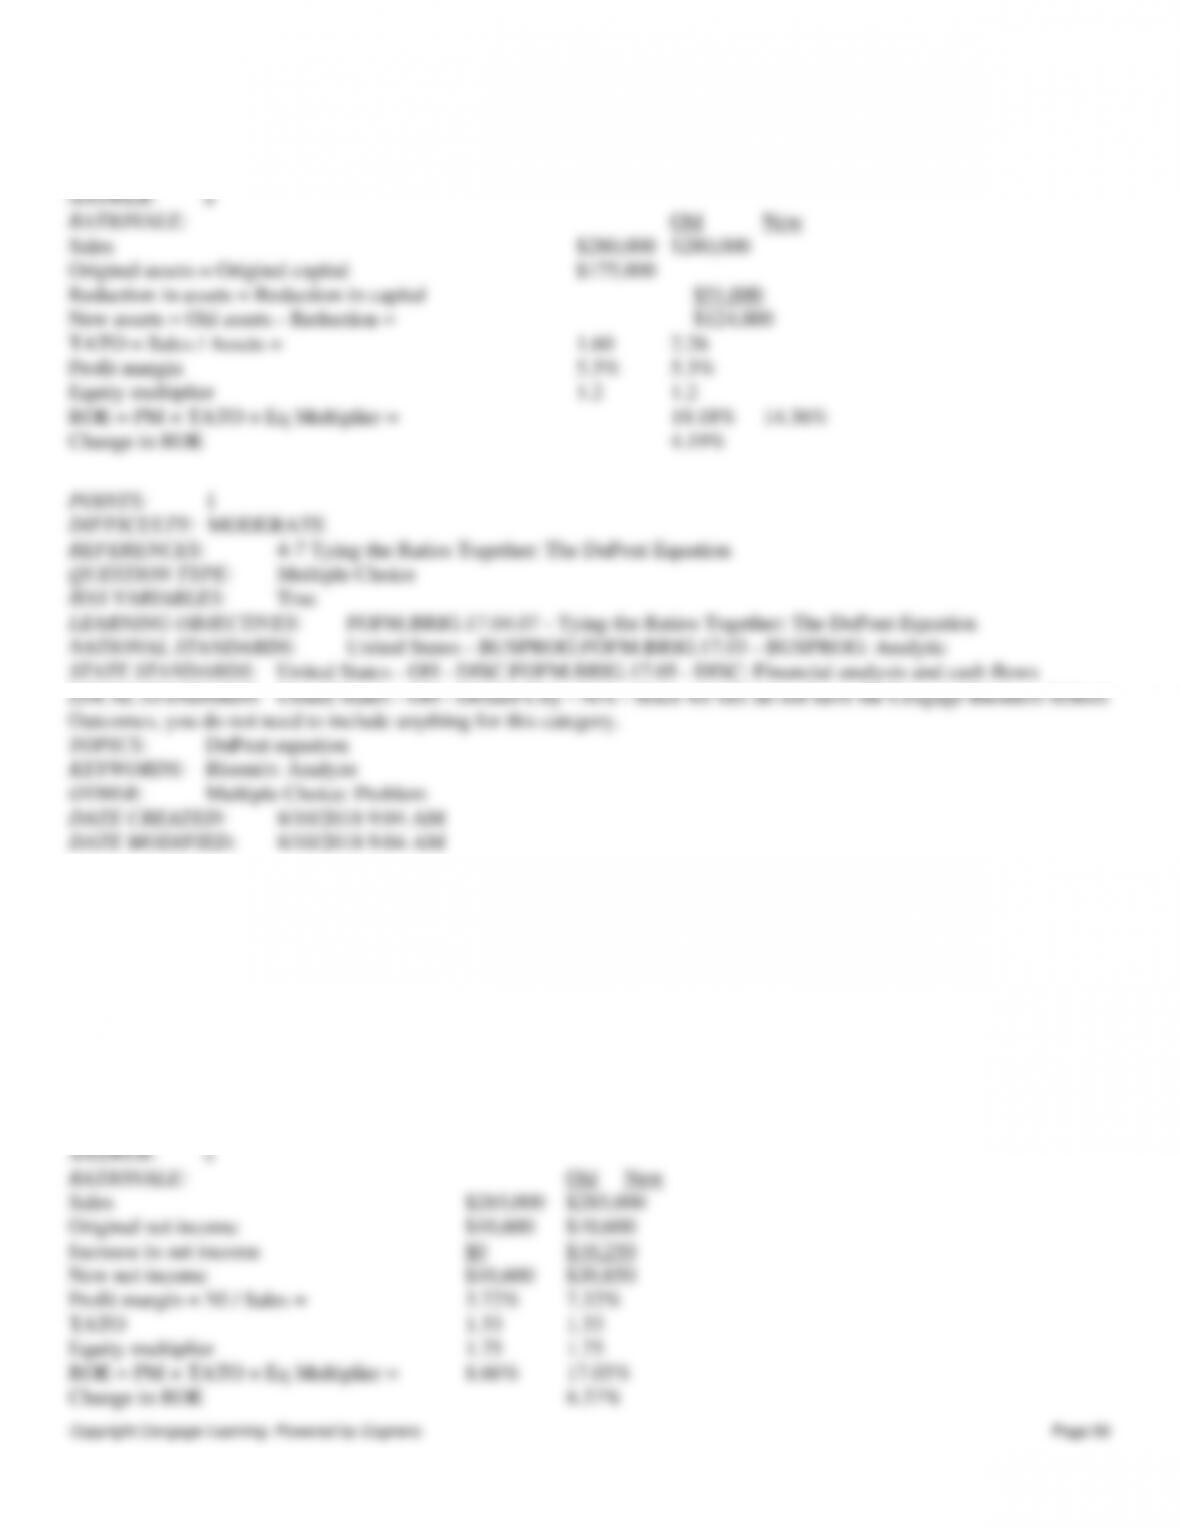
109. Last year Blease Inc had a total assets turnover of 1.33 and an equity multiplier of 1.75. Its sales were $285,000 and
its net income was $10,600. The firm finances using only debt and common equity, and its total assets equal total invested
capital. The CFO believes that the company could have operated more efficiently, lowered its costs, and increased its net
income by $10,250 without changing its sales, assets, or capital structure. Had it cut costs and increased its net income by
this amount, how much would the ROE have changed? Do not round your intermediate calculations.
a. 6.95%
b. 9.54%
c. 9.71%
d. 10.13%
e. 8.37%
Chapter 04: Analysis of Financial Statements
Copyright Cengage Learning. Powered by Cognero.
Page 62
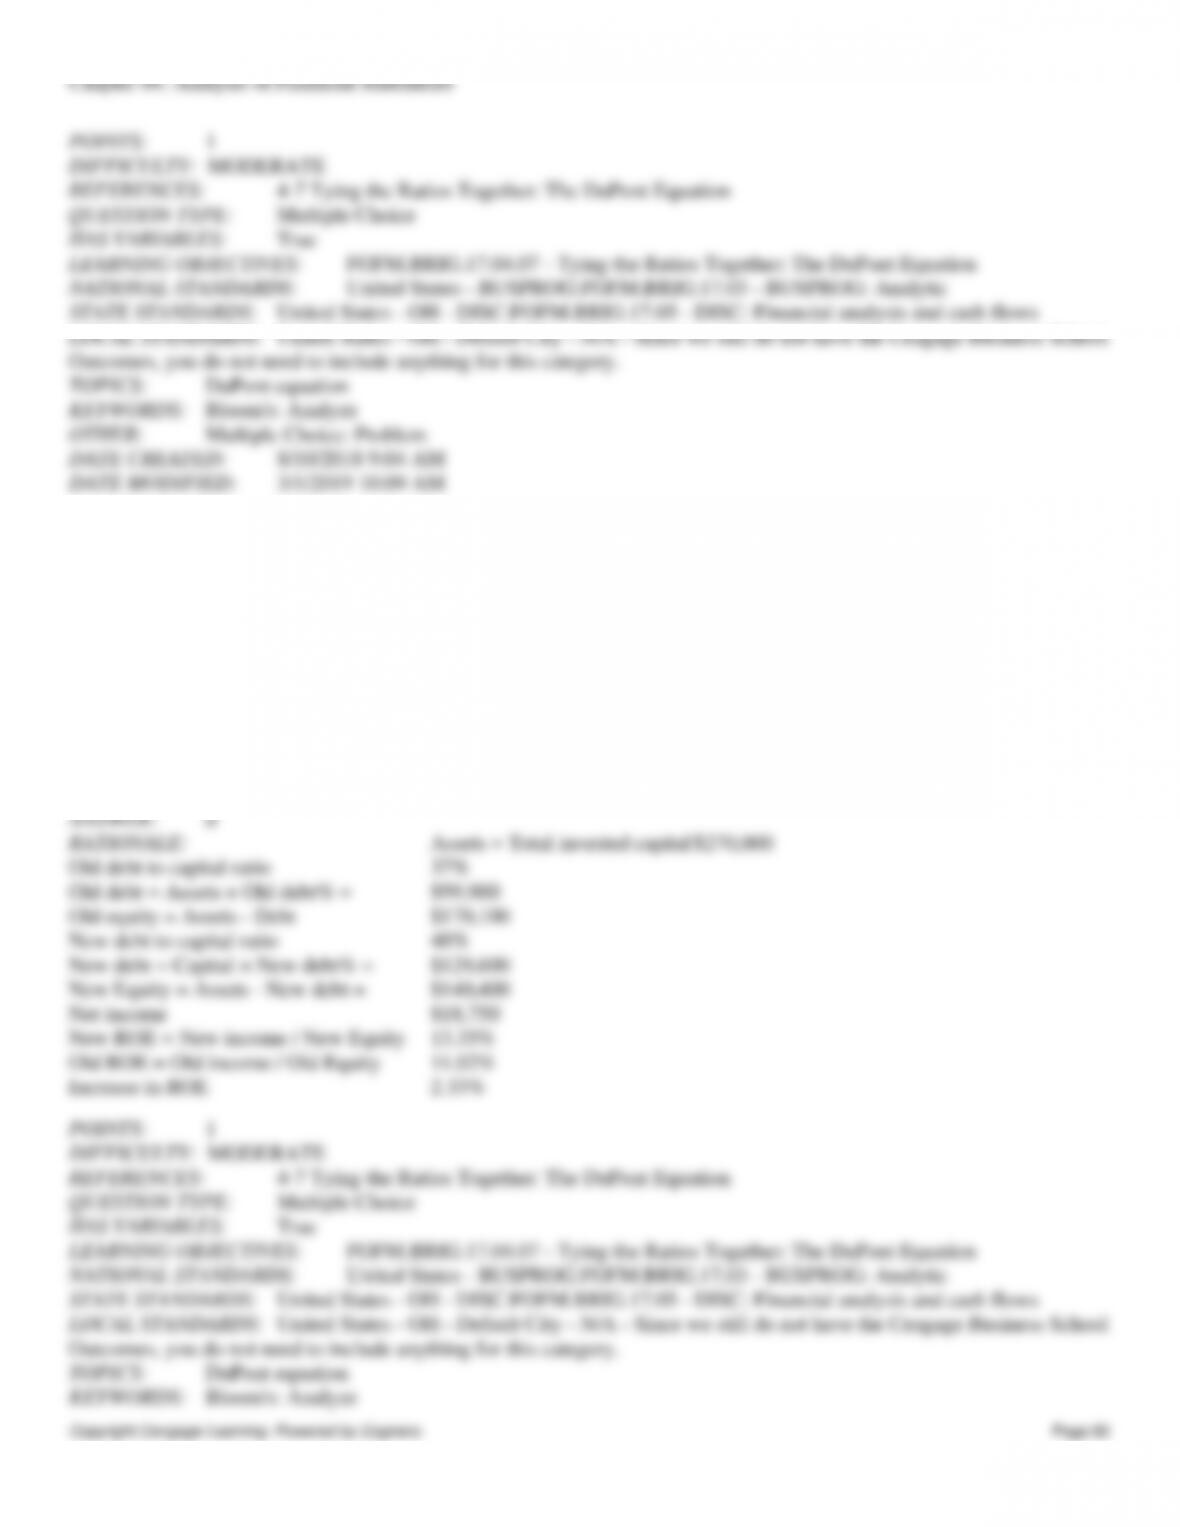
The new CFO thinks that inventories are excessive and could be lowered sufficiently to cause the current ratio to equal the
industry average, 2.70, without affecting either sales or net income. Assuming that inventories are sold off and not
replaced to get the current ratio to the target level, and that the funds generated are used to buy back common stock at
book value, by how much would the ROE change? Do not round your intermediate calculations.
a. 15.25%
b. 13.75%
c. 11.63%
d. 13.50%
e. 12.50%
Chapter 04: Analysis of Financial Statements
Copyright Cengage Learning. Powered by Cognero.
Page 63
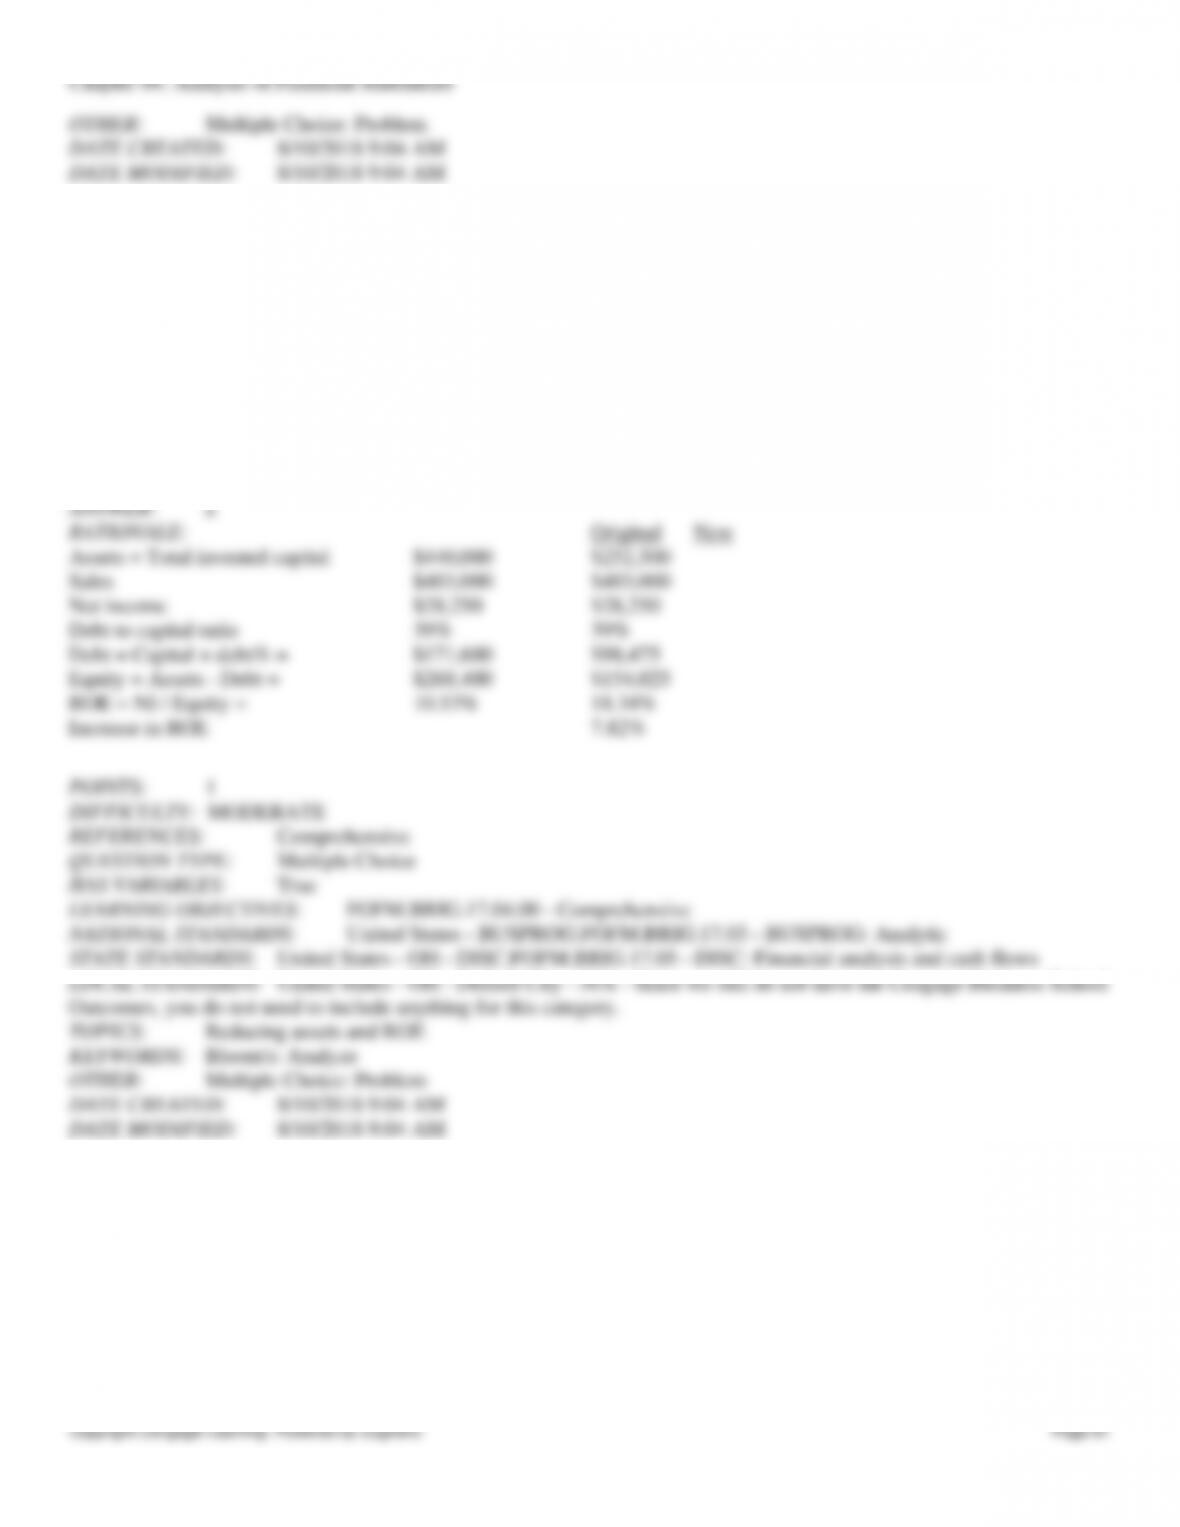
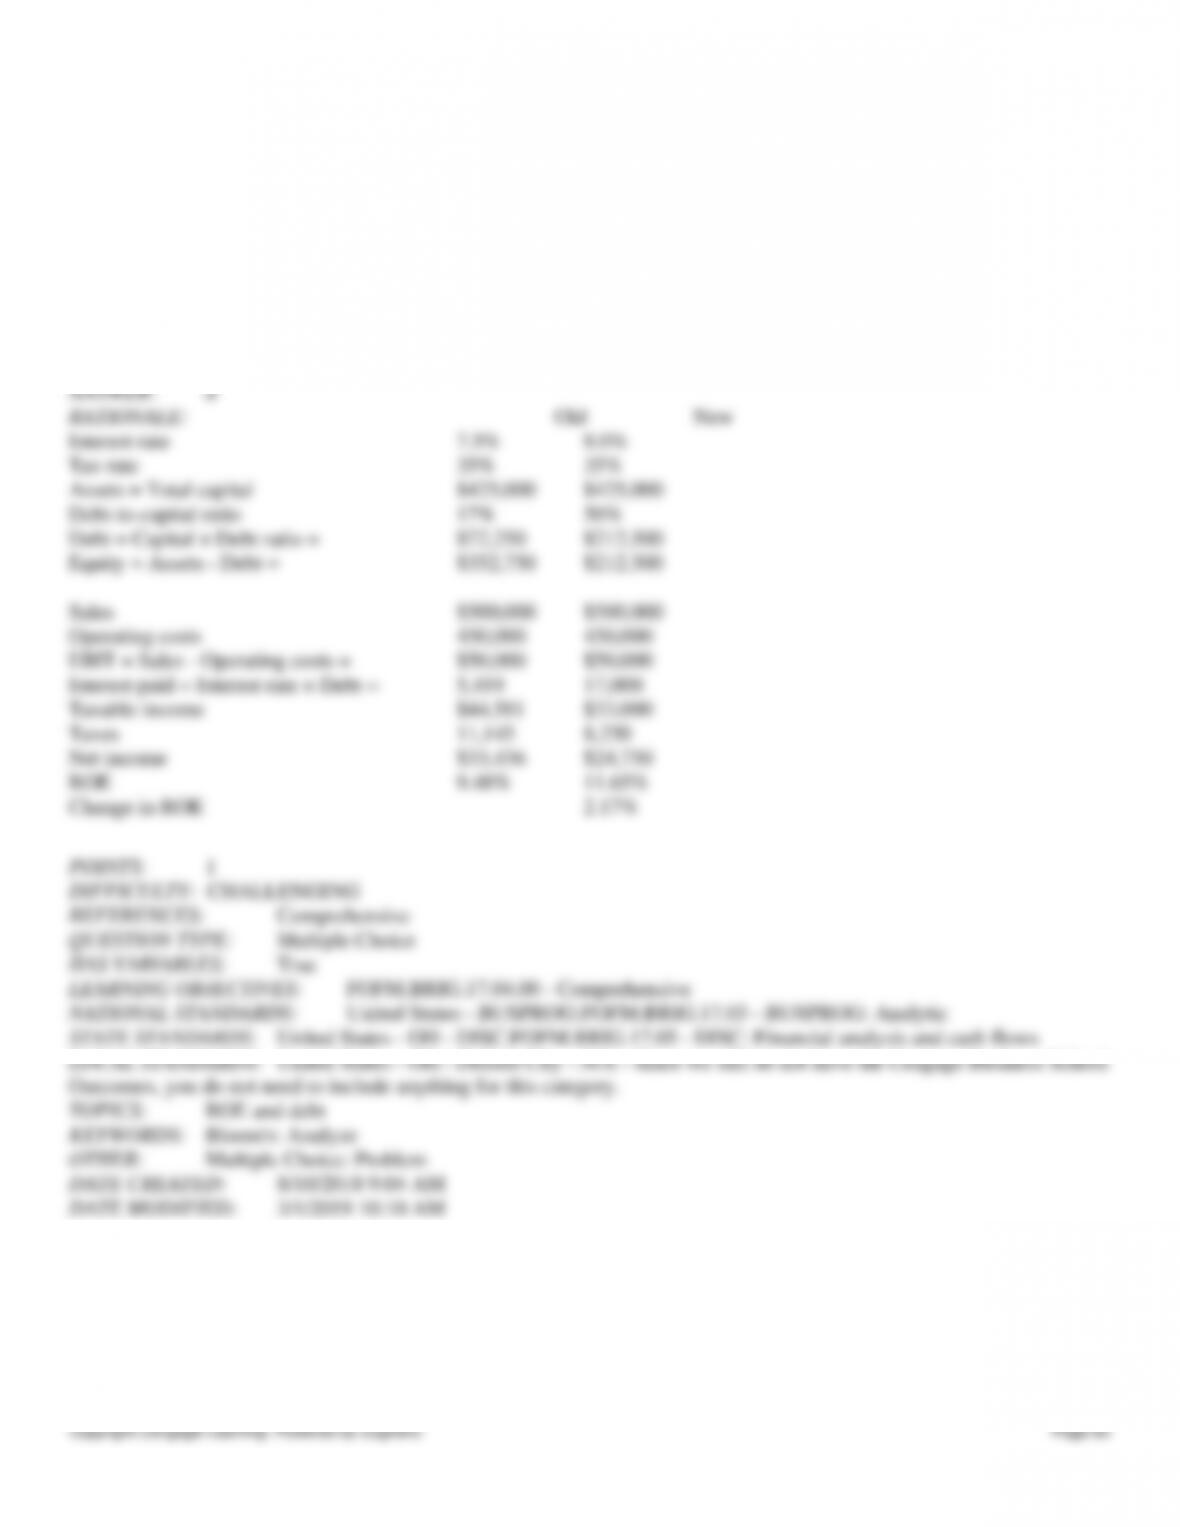
113. Last year Hamdi Corp. had sales of $500,000, operating costs of $450,000, and year-end assets (which is equal to its
total invested capital) of $425,000. The debt-to-total-capital ratio was 17%, the interest rate on the debt was 7.5%, and the
firm’s tax rate was 25%. The new CFO wants to see how the ROE would have been affected if the firm had used a 50%
debt-to-total-capital ratio. Assume that sales, operating costs, total assets, total invested capital, and the tax rate would not
be affected, but the interest rate would rise to 8.0%. By how much would the ROE change in response to the change in the
capital structure? Do not round your intermediate calculations.
a. 1.65%
b. 2.41%
c. 2.60%
d. 2.17%
e. 1.80%
114. Quigley Inc. is considering two financial plans for the coming year. Management expects sales to be $300,000,
operating costs to be $265,000, assets (which is equal to its total invested capital) to be $200,000, and its tax rate to be
25%. Under Plan A it would finance the firm using 25% debt and 75% common equity. The interest rate on the debt
would be 8.8%, but under a contract with existing bondholders the TIE ratio would have to be maintained at or above 3.9.
Under Plan B, the maximum debt that met the TIE constraint would be employed. Assuming that sales, operating costs,
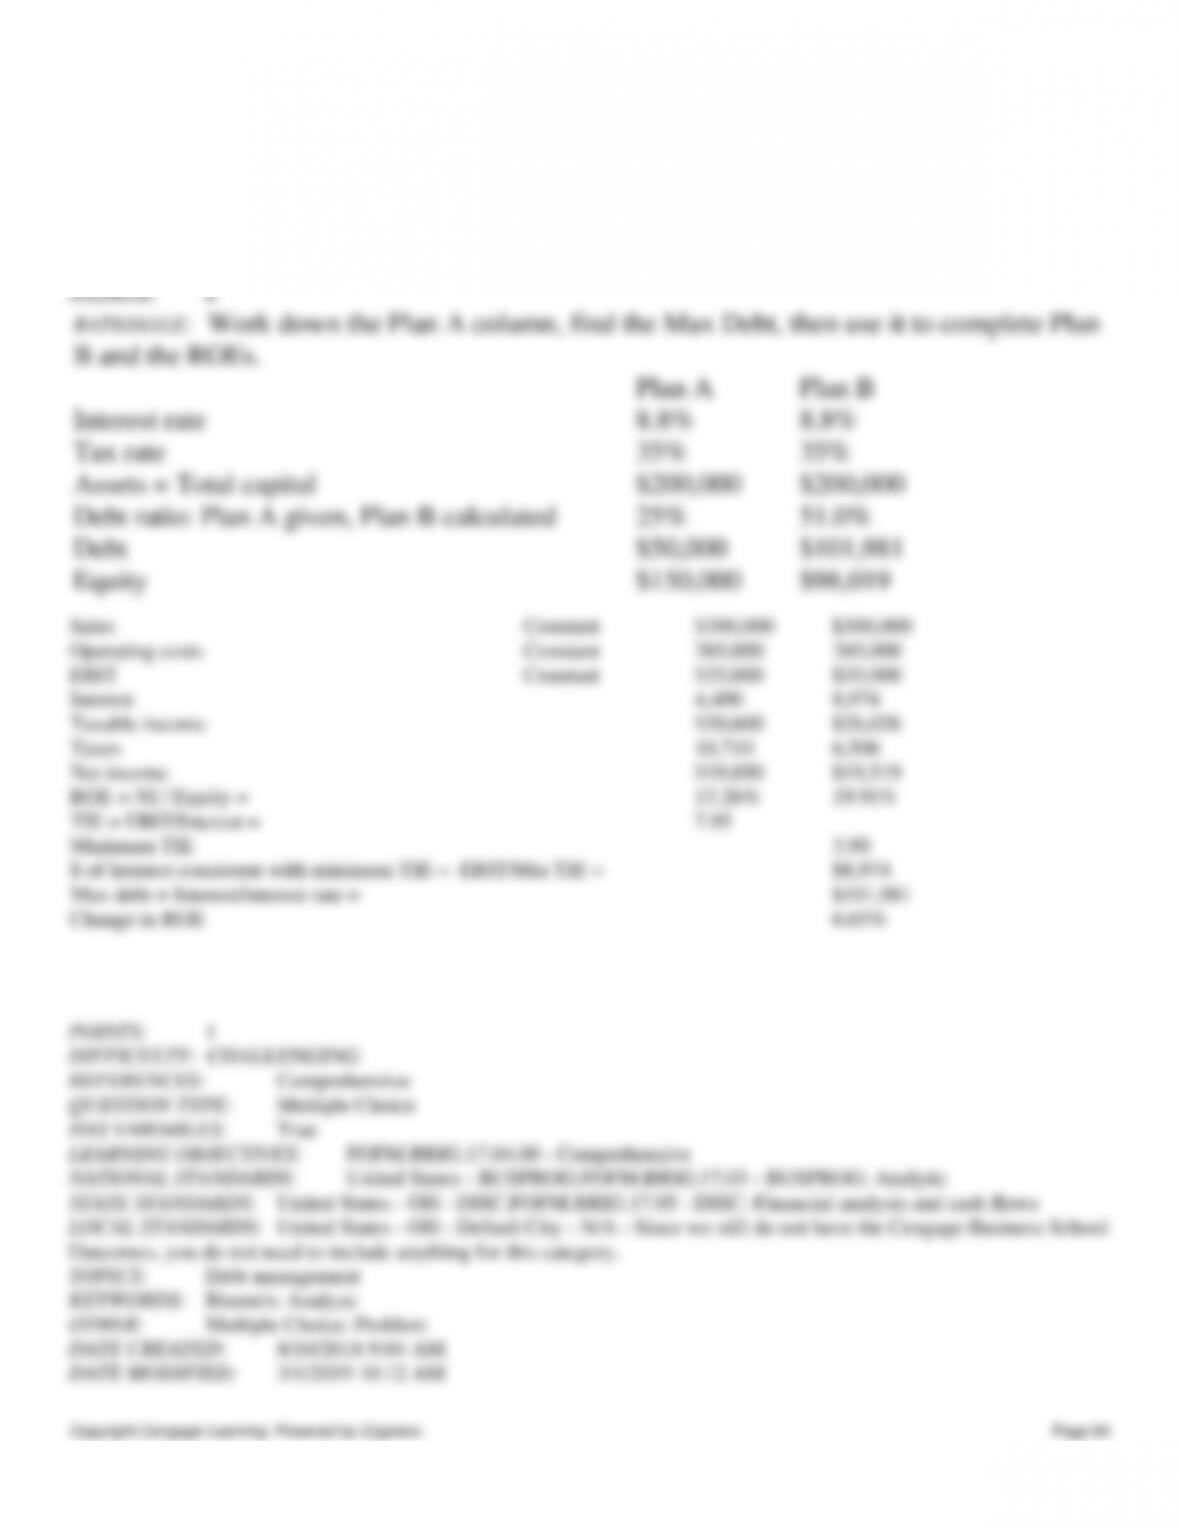
Chapter 04: Analysis of Financial Statements
Copyright Cengage Learning. Powered by Cognero.
Page 64
assets, total invested capital, the interest rate, and the tax rate would all remain constant, by how much would the ROE
change in response to the change in the capital structure? Do not round your intermediate calculations.
a. 5.99%
b. 6.65%
c. 7.85%
d. 7.39%
e. 5.79%
Chapter 04: Analysis of Financial Statements
Copyright Cengage Learning. Powered by Cognero.
Page 65
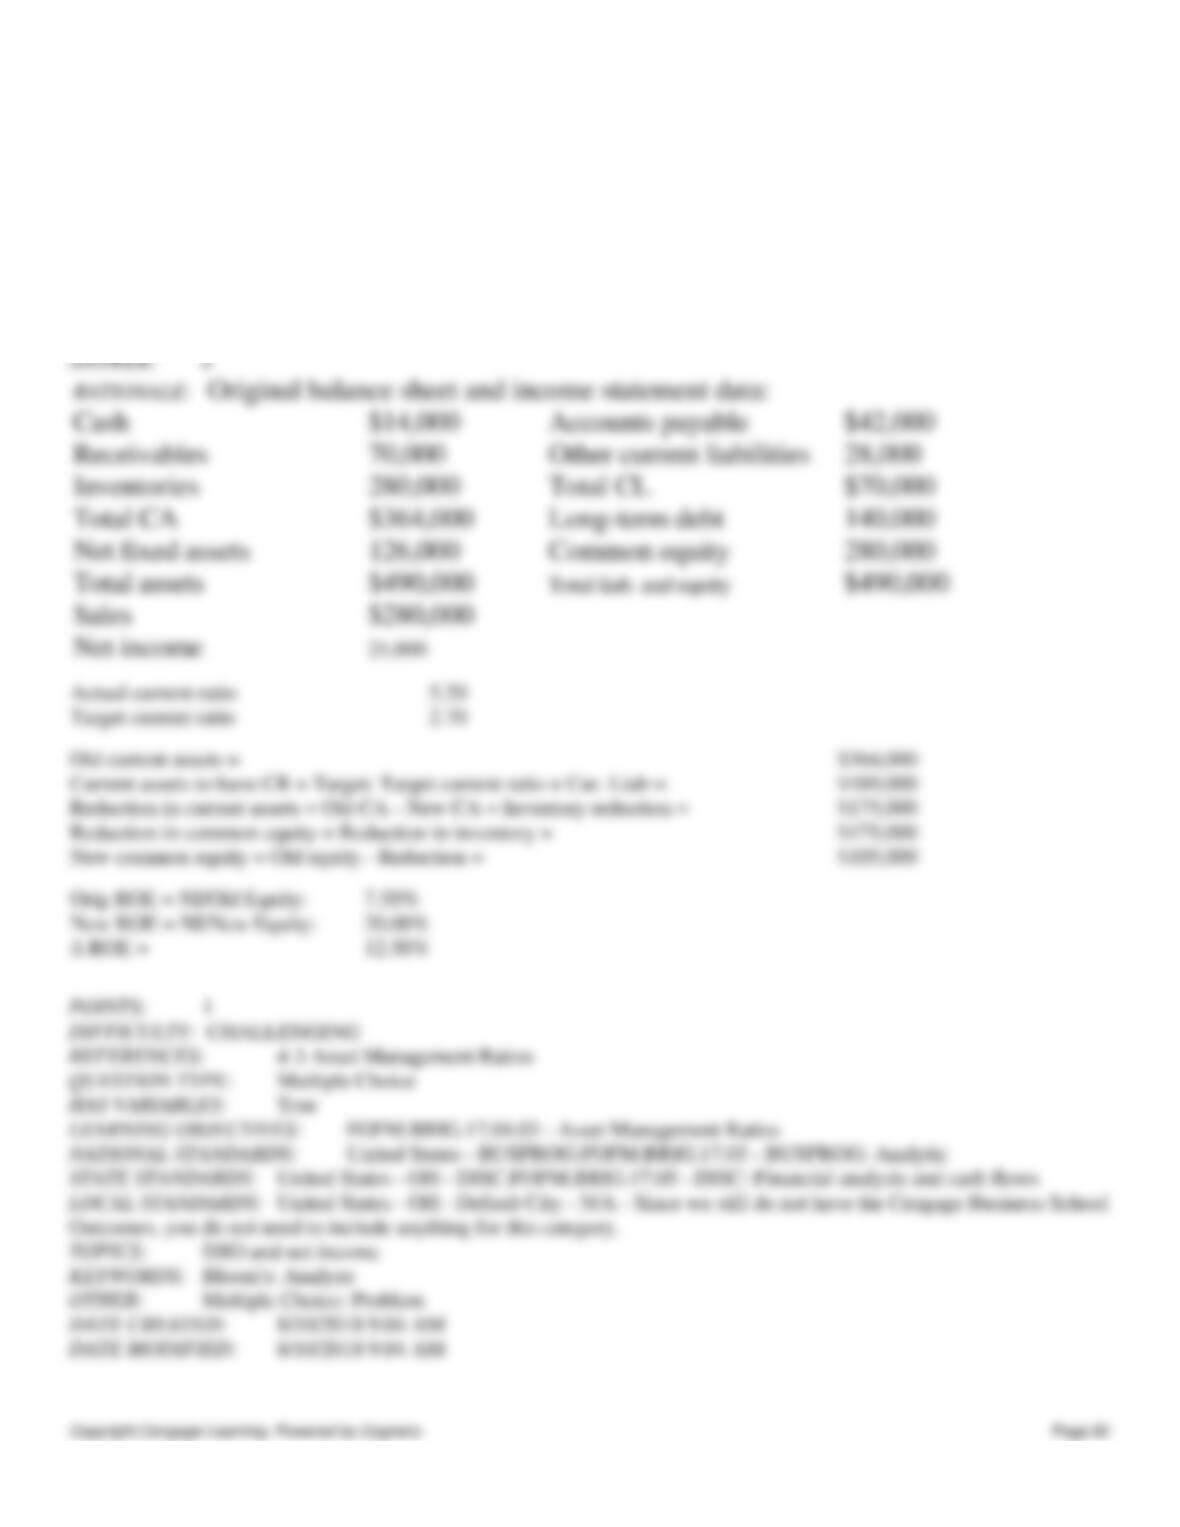
Exhibit 4.1
The balance sheet and income statement shown below are for Koski Inc. Note that the firm has no amortization charges, it
does not lease any assets, none of its debt must be retired during the next 5 years, and the notes payable will be rolled
over.
Balance Sheet (Millions of $)
Assets 2019
Cash and securities $4,200
Accounts receivable 17,500
Inventories 20,300
Total current assets $42,000
Net plant and equipment $28,000
Total assets $70,000
Liabilities and Equity
Accounts payable $22,509
Accruals 14,391
Notes payable 6,000
Total current liabilities $42,900
Long-term bonds $11,000
Total liabilities $53,900
Common stock $3,542
Retained earnings 12,558
Total common equity $16,100
Total liabilities and equity $70,000
Income Statement (Millions of $) 2019
Net sales $105,000
Operating costs except depreciation 97,650
Depreciation 2,100
Earnings before interest and taxes (EBIT) $5,250
Less interest 1,020
Earnings before taxes (EBT) $4,230
Taxes 1,058
Net income $2,538
Other data:
Shares outstanding (millions) 500.00
Common dividends (millions of $) $888.30
Int rate on notes payable & L-T bonds 6%
Federal plus state income tax rate 40%
Year-end stock price $60.91
115. Refer to Exhibit 4.1. What is the firm’s current ratio? Do not round your intermediate calculations.
a. 1.04
b. 0.85
c. 0.80
d. 0.98
e. 1.10
Copyright Cengage Learning. Powered by Cognero.
Page 71
126. Refer to Exhibit 4.1. What is the firm’s return on invested capital?
a. 9.52%
b. 7.33%
c. 7.71%
d. 7.23%
e. 7.61%
127. Refer to Exhibit 4.1. What is the firm’s operating margin? Do not round your intermediate calculations.
a. 4.65%
b. 3.90%
c. 5.60%
d. 3.80%
e. 5.00%

Chapter 04: Analysis of Financial Statements
Copyright Cengage Learning. Powered by Cognero.
Page 75