5-14
4. Bankruptcy analysis research has gone through many iterations, from univariate bankruptcy prediction
models to sophisticated logit models. However, after examining the results of the research there appear
to be a number of common factors that consistently explain bankruptcy. These factors can be grouped
into investment factors, financing factors, operating factors. For each of the three groups discuss
specific factors that have been found to significantly explain bankruptcy.
ANS:
Investment factors:
Financing factors:
Operating factors:
1. Relative level of profitability – Because profitable firms ultimately turn profits into cash, they are
5. The main ratio used by many financial analysts to examine a company’s short-term liquidity risk is the
current ratio. However, there are a number of problems that arise when this ratio is used to examine
short-term liquidity risk that may make the current ratio less useful than initially thought. Discuss the
interpretative problems of using the current ratio.
ANS:
There are a number of interpretative problems with using the current ratio as a measure of short-term
liquidity risk:
3. A very high current ratio may not be the result of prosperous business conditions, while a
6. One criticism of the interest and fixed charges coverage ratios as measures of long-term solvency risk
is that they use earnings rather than cash flows in the numerator. Detail how the interest coverage ratio
and fixed charges coverage ratio are calculated. In addition, discuss why using earnings in the
numerator is a problem and what method could be used to alleviate this problem.
ANS:
Net Income + Interest Expense
7. For each of the following scenarios, determine if it is an indicator of potential cash flow problems:
Potential future cash
flow problems
Yes/No
a. Growth in accounts receivable or inventories that is less the growth rate in sales.
b. Increases in accounts payable that exceed the increase in inventories.
c. Capital expenditures that substantially exceed cash flow from operations.
d. Sales of marketable securities are less than purchases of marketable securities.
e. Other operating current liabilities that grow at a lesser rate than sales.
f. A reduction or elimination of dividend payments
g. A substantial shift from long-term borrowing to short-term borrowing.
ANS:
Potential future cash
flow problems
5-16
© 2018 Cengage. May not be scanned, copied or duplicated, or posted to a publicly accessible website, in whole or in part.
PROBLEM
1. Given the following information, calculate for Year 2 the number of days of working capital financing
the firm will need to obtain from other sources?
Year 1 Year 2
Accounts Receivable, net $ 518 $ 562
Accounts Payable 203 192
Inventory 535 564
Credit Sales 3,205 3,636
Cost of Goods Sold 2,037 2,294
Selling and Admin. Expense 1,081 1,131
2. Refer to the financial statement data for Patriot Corp. for 2011 and 2010. Complete the table by
computing the ratios.
Patriot Corp.
Balance Sheet
As of December 31, 2011 2010
Assets:
Cash and Cash Equivalents $ 69,000 $ 55,250
Accounts Receivable 126,500 80,750
Inventory 92,000 63,750
Current Assets 287,500 199,750
Equipment 194,063 148,750
Less: Accumulated depreciation -38,813 -29,750
Equipment-Net 155,250 119,000
Land 132,250 106,250
5-17
Total assets: $575,000 $425,000
Liabilities:
Accounts Payable $ 69,000 $ 42,500
Accrued Salaries Payable 51,750 42,500
Rent Expense Payable 35,750 28,500
Income Tax Payable 4,788 1,250
Current Liabilities 161,288 114,750
Long-term note payable 172,500 102,000
Total Liabilities 333,788 216,750
Stockholders’ Equity:
Common stock 115,000 89,250
Retained earnings 126,212 119,000
Total liabilities and stockholders’ equity: $575,000 $425,000
Patriot Corp.
Income Statement
For the year ended December 31, 2011
Revenues $ 373,750
Cost of goods sold (224,250)
Gross Profit $149,500
Operating Expenses
Depreciation expense (9,062)
Salary expense (56,063)
Insurance Expense (44,850)
Rent Expense (18,688)
Interest Expense (6,120)
Total Operating Expenses (134,783)
Income from Operations 14,717
Income Tax Expense (4415)
Net income $ 10,302
Dividends paid to Common Shareholders $ 3,090
Financial Ratio to be calculated:
2011 2010
Current Ratio
Quick Ratio
Days Accounts Receivable N/A
Days Inventory N/A
Days Accounts Payable N/A
Net Days Working Capital N/A
Long-term Debt to Long-term Capital Ratio
Long-term Debt to Shareholders’ Equity ratio
5-18
Liabilities to Total Assets
Interest Coverage ratio N/A
N/A – Not Applicable for the given year
ANS:
2011 2010
3. Below is information from Darren Company’s 2012 financial statements.
As of Dec. 31, 2012 Dec. 31, 2011
Cash and short-term investments $ 958,245 $ 745,800
Accounts Receivable (net) 125,850 135,400
Inventories 195,650 175,840
Prepaid Expenses and other current assets 45,300 30,860
Total Current Assets $1,325,045 $1,087,900
Plant, Property and Equipment, net 1,478,320 1,358,700
Intangible Assets 125,600 120,400
Total Assets $2,928,965 $2,567,000
Short-term borrowings $ 25,190 $ 38,108
Current portion of long-term debt 45,000 40,000
Accounts payable 285,400 325,900
Accrued liabilities 916,722 705,891
Income taxes payable 125400 115600
Total Current Liabilities $1,397,712 $1,225,499
Long-term Debt 450,000 430,000
Total Liabilities $1,847,712 $1,655,499
Shareholders’ Equity $1,081,253 $911,501
Total Liabilities and Shareholders’ Equity $2,928,965 $2,567,000
Selected Income Statement Data – for the year ending December 31, 2012:
Net Sales $3,210,645
Cost of Goods Sold (2,310,210)
Operating Income 900,435
Net Income 324,850
Selected Statement of Cash Flow Data – for the year ending December 31, 2012:
Cash Flows from Operations $584,750
Interest Expense 42,400
Income Tax Expense 114,200
5-19
Using this information, calculate the following ratios:
2012 2011
Liabilities to Assets Ratio
Liabilities to Shareholders’ Equity Ratio
LT Debt to LT Capital Ratio
LT Debt to Shareholders’ Equity Ratio
Interest Coverage Ratio N/A
Operating Cash Flow to Total Liabilities Ratio N/A
ANS:
2012 2011
4. Falcon Corporation has current assets of $400,000 and current liabilities of $275,000.
Required:
Compute the effect of each of the following transactions on Falcon’s current ratio:
a. Refinanced a $60,000 long-term mortgage with a short-term note.
b. Purchasing $108,000 of merchandise inventory with short-term accounts payable.
c. Paying $50,000 of short-term accounts payable.
d. Collecting $90,000 of short-term accounts receivable.
ANS:
a. The refinancing of a $60,000 long-term mortgage with a short–term note would increase Falcon’s
5 A. Hammer Corporation wrote off $185,000 of obsolete inventory at December 31, 2011.
Required:
What effect did this write-off have on the company’s 2011 current and quick ratios?
ANS:
5-20
The write-off of obsolete inventory would decrease Hammer Corporation’s current assets, thus
5B. Assume that Hammer Company did not write off their inventory. How will this affect the
company’s financial position?
ANS: If a company keeps obsolete inventory on the books they are artificially pumping up their
6. Selected risk ratios are presented for 2011 and 2010 for Techtron Company. Also, refer to the
financial statement data for the company.
2011 2010
Revenues to Cash Ratio 6.8 7.7
Days Revenues Held in Cash 54 47
Current Ratio 1.5 1.5
Quick Ratio 1.1 1.1
Operating Cash Flow to Average Current Liabilities Ratio
47.3%
55.7%
Days Accounts Receivable 68 73
Days Inventory 51 68
Days Accounts Payable 47 49
Net Days Working Capital 72 91
Liabilities to Assets Ratio 0.559 0.621
Liabilities to Shareholders’ Equity Ratio 1.266 1.639
Long-Term Debt to Long-Term Capital Ratio 0.330 0.418
Long-Term Debt to Shareholders’ Equity Ratio 0.492 0.720
Operating Cash Flow to Total Liabilities Ratio 0.243 0.242
Interest Coverage Ratio 5.6 2.3
Financial Statements
INCOME STATEMENT (in millions)
Fiscal year end 2012 2011 2010
Sales $2,500 $ 3,139 $ 2,816
Cost of Goods Sold (1,252) (1,288) (1,099)
Selling, General & Admin. Exp.
Advertising (387) (364) (297)
Research and Development (157) (143) (154)
Royalty Expense (223) (248) (296)
Other Selling and Administrative (385) (799) (788)
5-21
Interest expense (32) (53) (78)
Income tax expense (64) (69) (29)
Net income $ 196 $ 175 $ 75
Balance Sheet
Fiscal year end 2012 2011 2010 2009
ASSETS (in millions)
Cash $ 625 $421 $ 496 $233
Accounts Receivable 579 607 555 572
Inventories 195 169 190 217
Prepayments 219 212 191 346
Total current assets $1,618 $1,409 $1,432 $1,368
Property, plant & equipment 207 200 213 236
Other Assets 1,416 1,554 1,498 1,765
Total assets $3,241 $3,163 $3,143 $3,369
LIABILITIES
Accounts payable $ 168 $ 159 $ 166 $ 123
Short-term borrowing 342 24 223 36
Other current liabilities 584 749 578 599
Total current liabilities $1,094 $ 939 $ 967 $ 758
Long-term debt 303 687 857 1,166
Other noncurrent liabilities 149 141 128 92
Total liabilities $1,546 $1,767 $1,952 $2,016
Common stock $ 105 $ 105 $ 105 $ 105
Additional Paid-in Capital 381 398 458 455
Retained earnings 1,776 1,558 1,430 1,622
Accumulated Other Comprehensive Income 82 30 (47) (68)
Treasury Stock (649) (695) (755) (761)
Total Shareholders’ equity $1,695 $1,396 $1,191 $1,353
Total Liabilities & Shareholders’ Equity $3,241 $3,163 $3,143 $3,369
STATEMENT OF CASH FLOWS (in millions)
Operations 2012 2011 2010
Net Income $ 196 $ 175 $ 75
Depreciation & Amortization 146 164 184
(Increase) Decrease Accounts Receivables 28 (52) 17
(Increase) Decrease Inventories (26) 21 27
(Increase) Decrease Prepayments 7 (21) 155
(Decrease) Increase Accounts Payable & Other
Current Liabilities
(90)
17
23
Net Addbacks and Subtractions from operations (147) 112 221
Cash flows from operations $ 195 $451 $480
Investing
Property Plant and Equipment acquired ($79) ($63) ($59)
Other Investing Transactions (6) (2) (3)
Cash Flows from Investing ($85) ($65) ($62)
5-22
Financing
Increase in Common Stock 0 0 0
Increase (Decrease) in Short-term Borrowing (318) 199 (187)
Increase (Decrease) in Long-term Borrowing (384) (170) 309
Acquisition of Common Stock (46) 60 (6)
Dividends (37) (21) (21)
Other Financing Transactions 879 243 (250)
Cash flow from Financing $94 ($311) ($155)
Change in Cash $204 $75 $263
Cash – Beginning of Year 421 496 233
Cash – End of Year $ 625 $ 421 $ 496
Required:
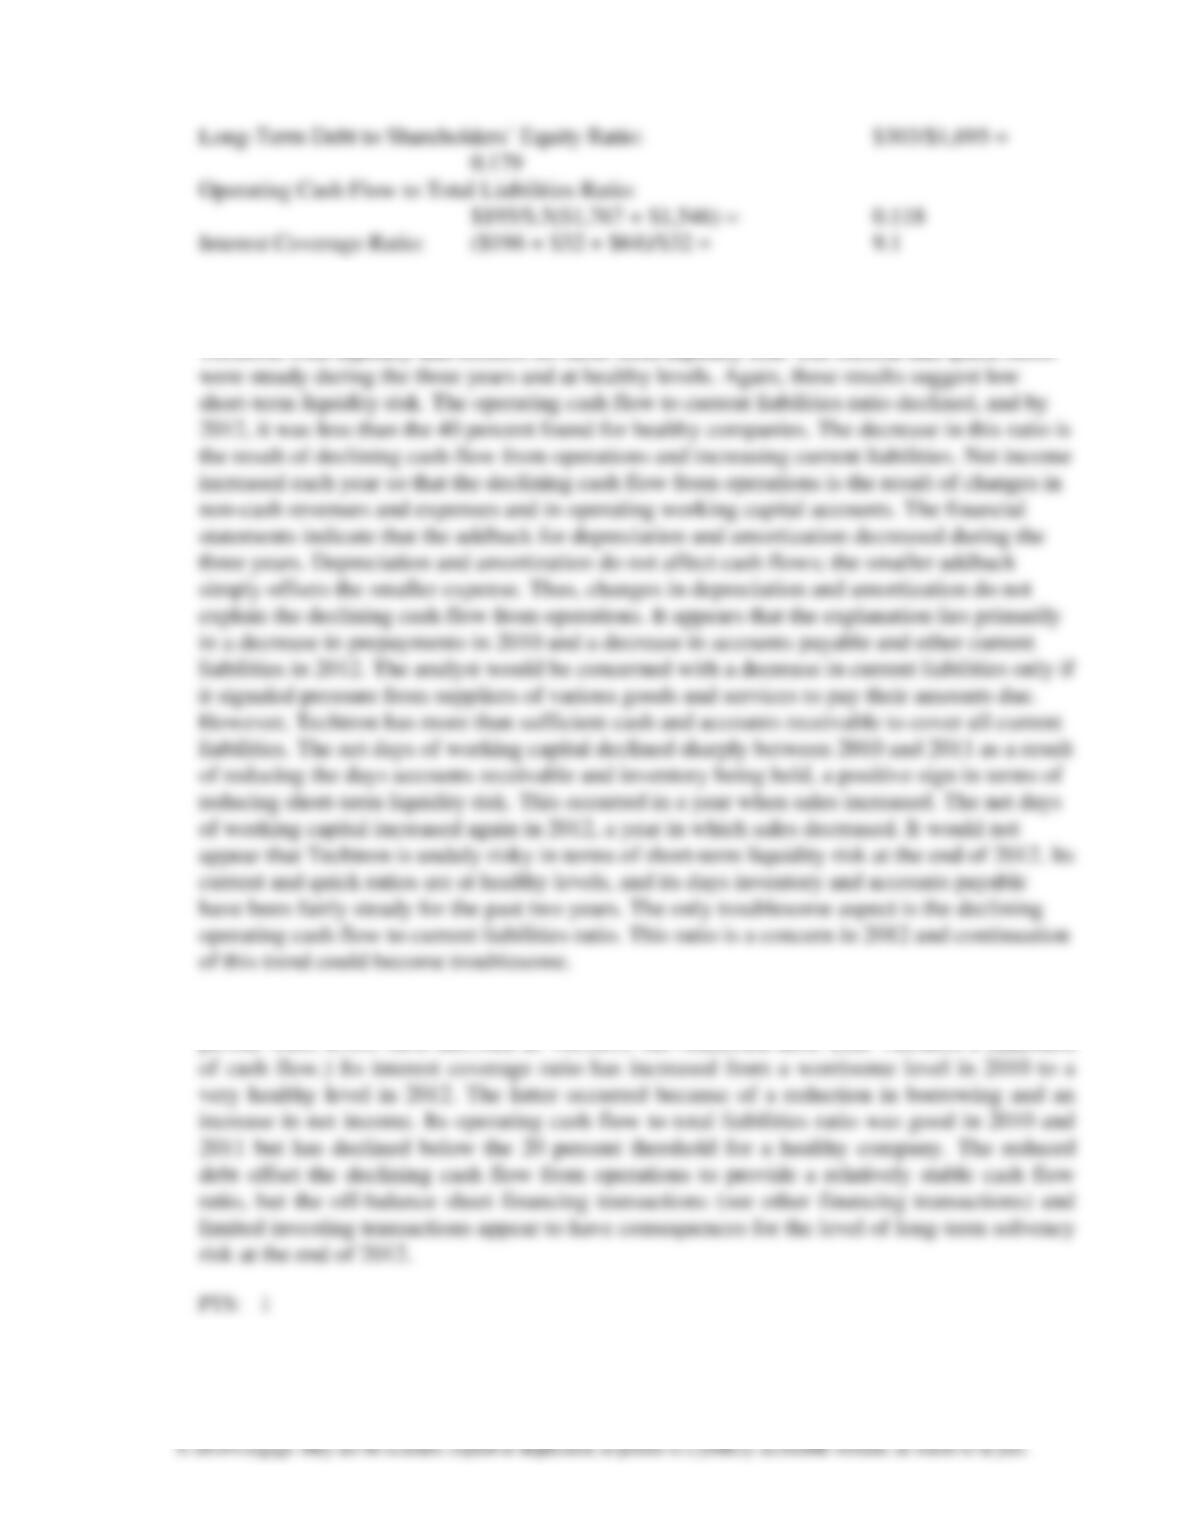
a. Calculate the amounts of these ratios for 2012.
b. Assess the changes in the short-term liquidity risk of Techtron between 2010 and
2012 and the level of that risk at the end of 2012.
c. Assess the changes in the long-term solvency risk of Techtron between 2010 and
2012 and the level of that risk at the end of 2012.
ANS:
a.
5-23
© 2018 Cengage. May not be scanned, copied or duplicated, or posted to a publicly accessible website, in whole or in part.
b.) The changes in the short-term liquidity risk ratios present mixed signals. Techtron has built
up its balance in cash so that it has more days of revenue held in cash. This trend provides
Techtron with liquidity and reduces its short-term liquidity risk. The current and quick ratios
c. Techtron’s long-term solvency risk has decreased significantly during the three-year
period. Debt levels have declined as Techtron has redeemed debt. (See Techtron’s statement
7. Below is selected data of Pronto Company:
5-24
Balance Sheet Data As of December 31:
2012 2011
Accounts receivable $671,000 $642,000
Allowance for doubtful accounts 31,000 22,000
Net accounts receivable $640,000 $620,000
Inventories – LCM $542,500 $642,500
Income Statement Data
Net credit sales $3,150,000 $3,000,000
Net cash sales 800,000 600,000
Net sales $3,950,000 $3,600,000
Cost of goods sold $2,370,000 $2,160,000
Selling, general and adm. expenses 475,000 350,000
Other 150,000 125,000
Total operating expenses $2,995,000 $2,635,000
Net income $ 955,000 $ 965,000
Required:
a. What is the accounts receivable turnover for 2012?
b. What is the inventory turnover for 2012?
8. On January 1, 2012, Deputron Company’s beginning inventory was $600,000. During 2012,
the company purchased $2,600,000 of additional inventory, and on December 31, 2012
Creek’s ending inventory was $565,000.
Required:
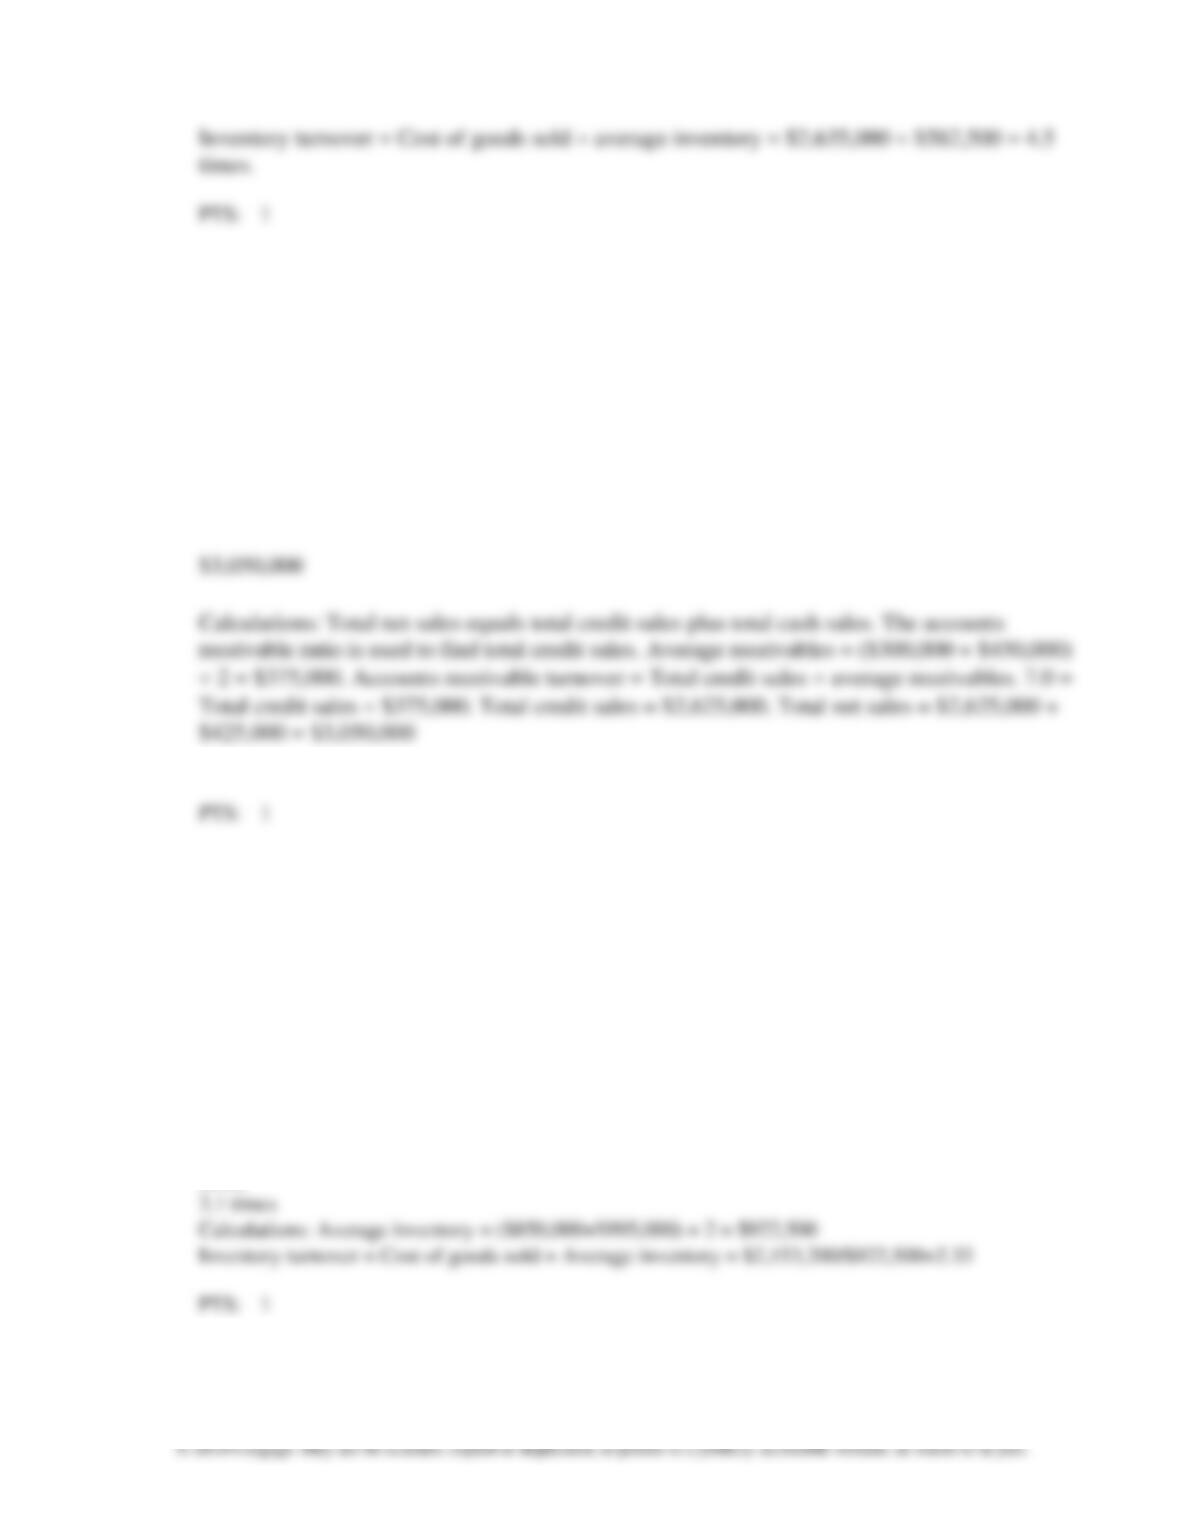
What was Deputron’s inventory turnover for 2012?
ANS:
5-25
© 2018 Cengage. May not be scanned, copied or duplicated, or posted to a publicly accessible website, in whole or in part.
Inventory turnover = Cost of goods sold average inventory = $2,635,000 $582,500 = 4.5
times.
PTS: 1
9. Caraway Company’s net accounts receivable was $300,000 at December 31, 2012 and
$450,000 at December 31, 2013. Net cash sales for 2008 were $425,000. The accounts
receivable turnover for 2013 was 7.0, and this turnover figure was computed from net credit
sales for the year.
Required:
What were Caraway’s total net sales for 2013?
ANS:
10. Foxmoor Company’s merchandise inventory and other related accounts for 2012 follow:
Sales $3,100,000
Cost of Goods Sold 2,153,200
Merchandise Inventory
Beginning of Year 850,000
End of Year 995,000
Required:
Calculate Foxmoor’s inventory turnover during 2012 assuming that the merchandise inventory buildup
was relatively constant during the year.
ANS:
11. Bragdon Company is consistently profitable. Its normal financial statement relationships are as
follows:
Current ratio 3.5:1
Inventory turnover 4.5 times
Liabilities to assets ratio 0.8: 1
Required: Determine whether each transaction or event that follows increased, decreased or had no
effect on each ratio.
1. Bragdon declared but did not pay a cash dividend.
2. Customers returned invoiced goods for which they had not paid.
3. Accounts payable were paid at year-end.
4. Bragdon recorded both a receivable from an insurance company and a loss on a building due to fire
damage.
5. Early in the year, Bragdon increased the selling price of one of its products because customer
demand far exceeded production capacity. The number of units sold this year was the same as last
year.
ANS:
1. Bragdon declared but did not pay a cash dividend:
3. Accounts payable were paid at year-end:
4. Bragdon recorded both a receivable from an insurance company and a loss on a building due to fire
damage:
5. Early in the year, Bragdon increased the selling price of one of its products because customer
demand far exceeded production capacity. The number of units sold this year was the same as last