Chapter 06 – Inventories
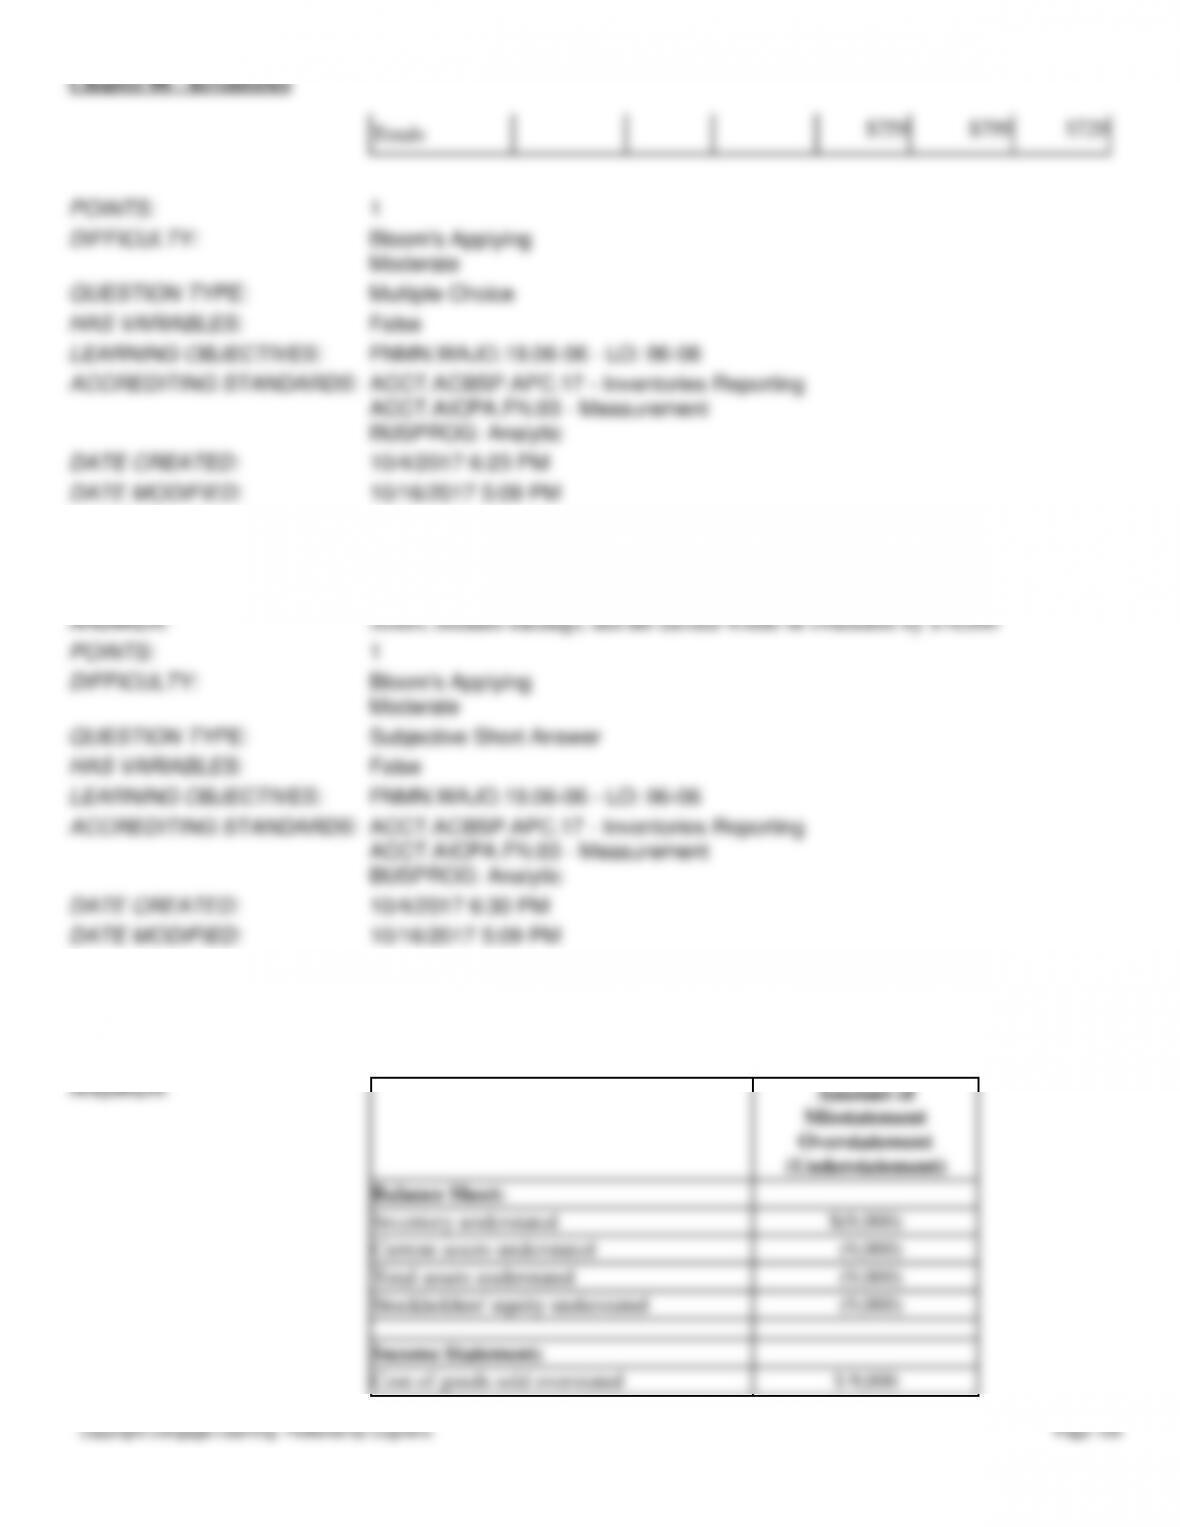
Gross profit:
Total sales
$56,975.00
Lesscost of goods sold
36,431,25
Gross profit
$20,543.75
POINTS:
1
DIFFICULTY:
Bloom’s Applying
Challenging
QUESTION TYPE:
Multiple Choice
HAS VARIABLES:
False
PREFACE NAME:
Brutus Corporation
LEARNING OBJECTIVES:
FNMN.WAJO.19.06-02 – LO: 06–02
ACCREDITING STANDARDS:
ACCT.ACBSP.APC.17 – Inventories Reporting
ACCT.AICPA.FN.03 – Measurement
BUSPROG: Analytic
DATE CREATED:
10/4/2017 5:03 PM
DATE MODIFIED:
10/16/2017 5:09 PM
214. Using the table provided, calculate total sales, cost of goods sold, gross profit, and ending inventory using each of the
average cost periodic inventory method. Round the average to the nearest cent.
a.
Total sales: $56,975.00
Cost of goods sold: $36,431.25
Gross profit: $20,543.75
Ending inventory: $19,981.2
b.
Total sales: $56,975.00
Cost of goods sold: $36,587.50
Gross profit: $20,387.50
Ending inventory: $19,825.00
c.
Total sales: $56,975.00
Cost of goods sold: $37,312.50
Gross profit: $19,662.50
Ending inventory: $19,573.25
d.
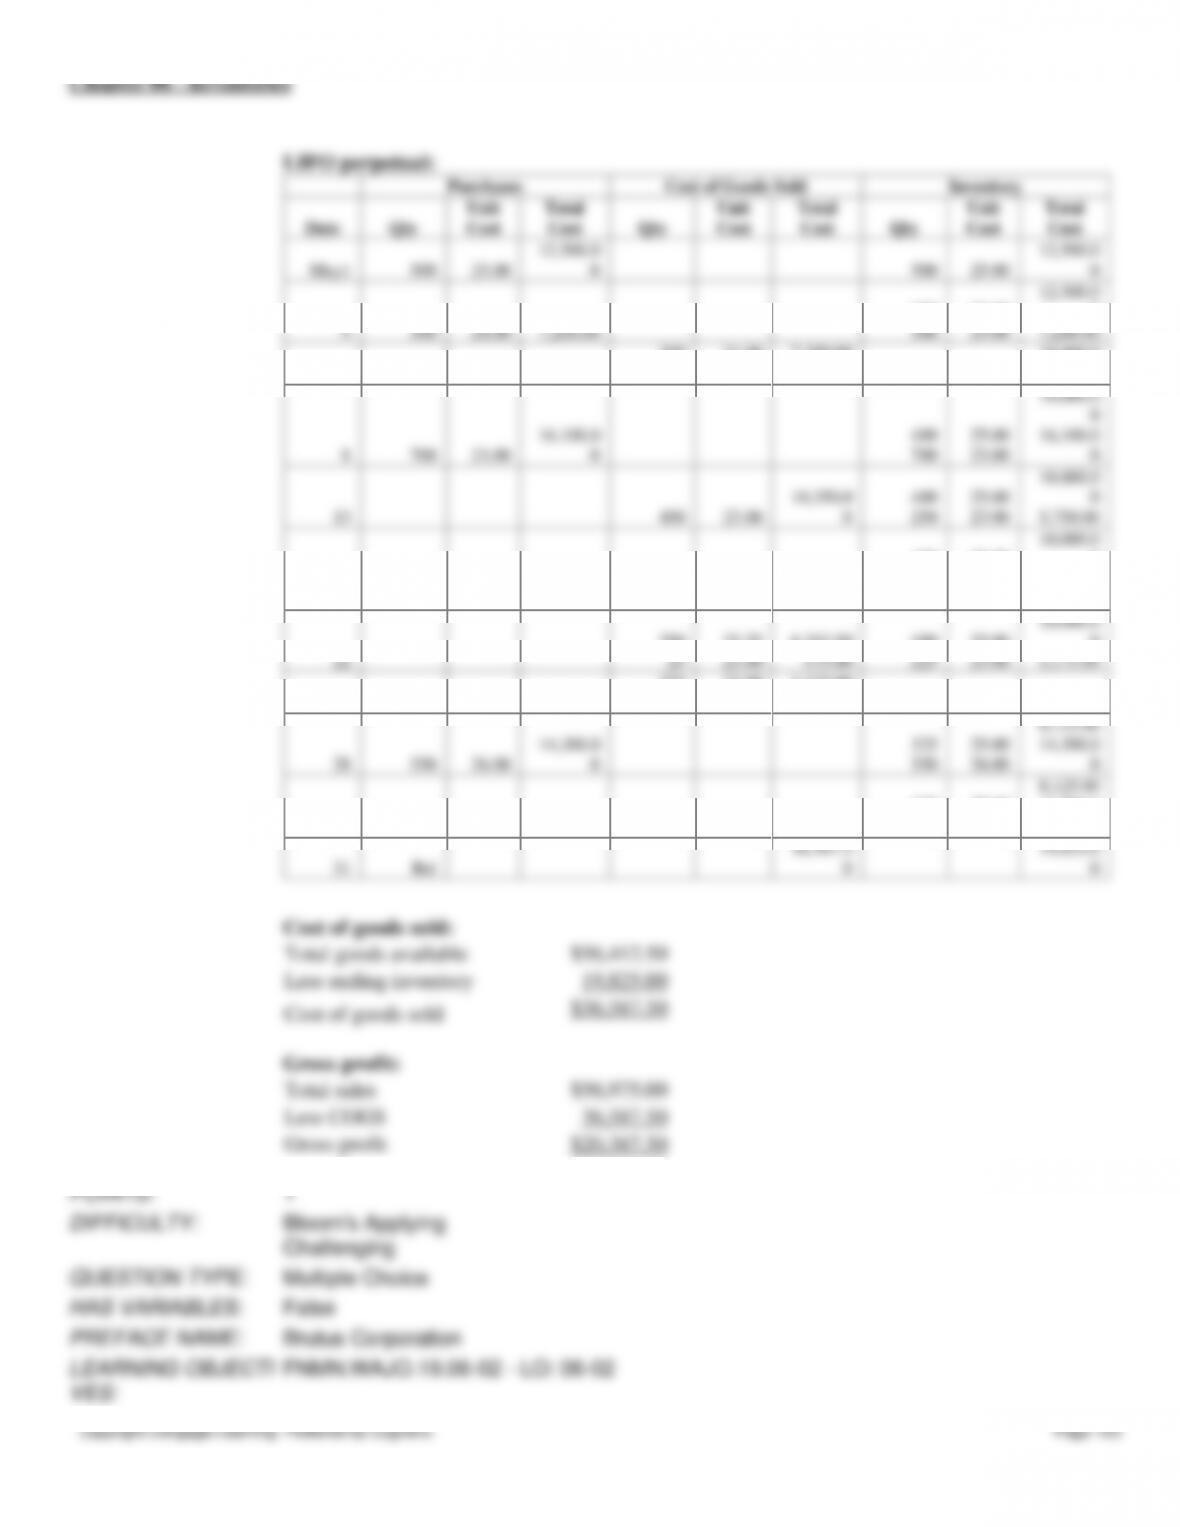
Total sales: $56,975.00
Cost of goods sold: $37,401.75
Gross profit: $19,573.25
Ending inventory: $19,010.75
ANSWER:
d
RATIONALE:
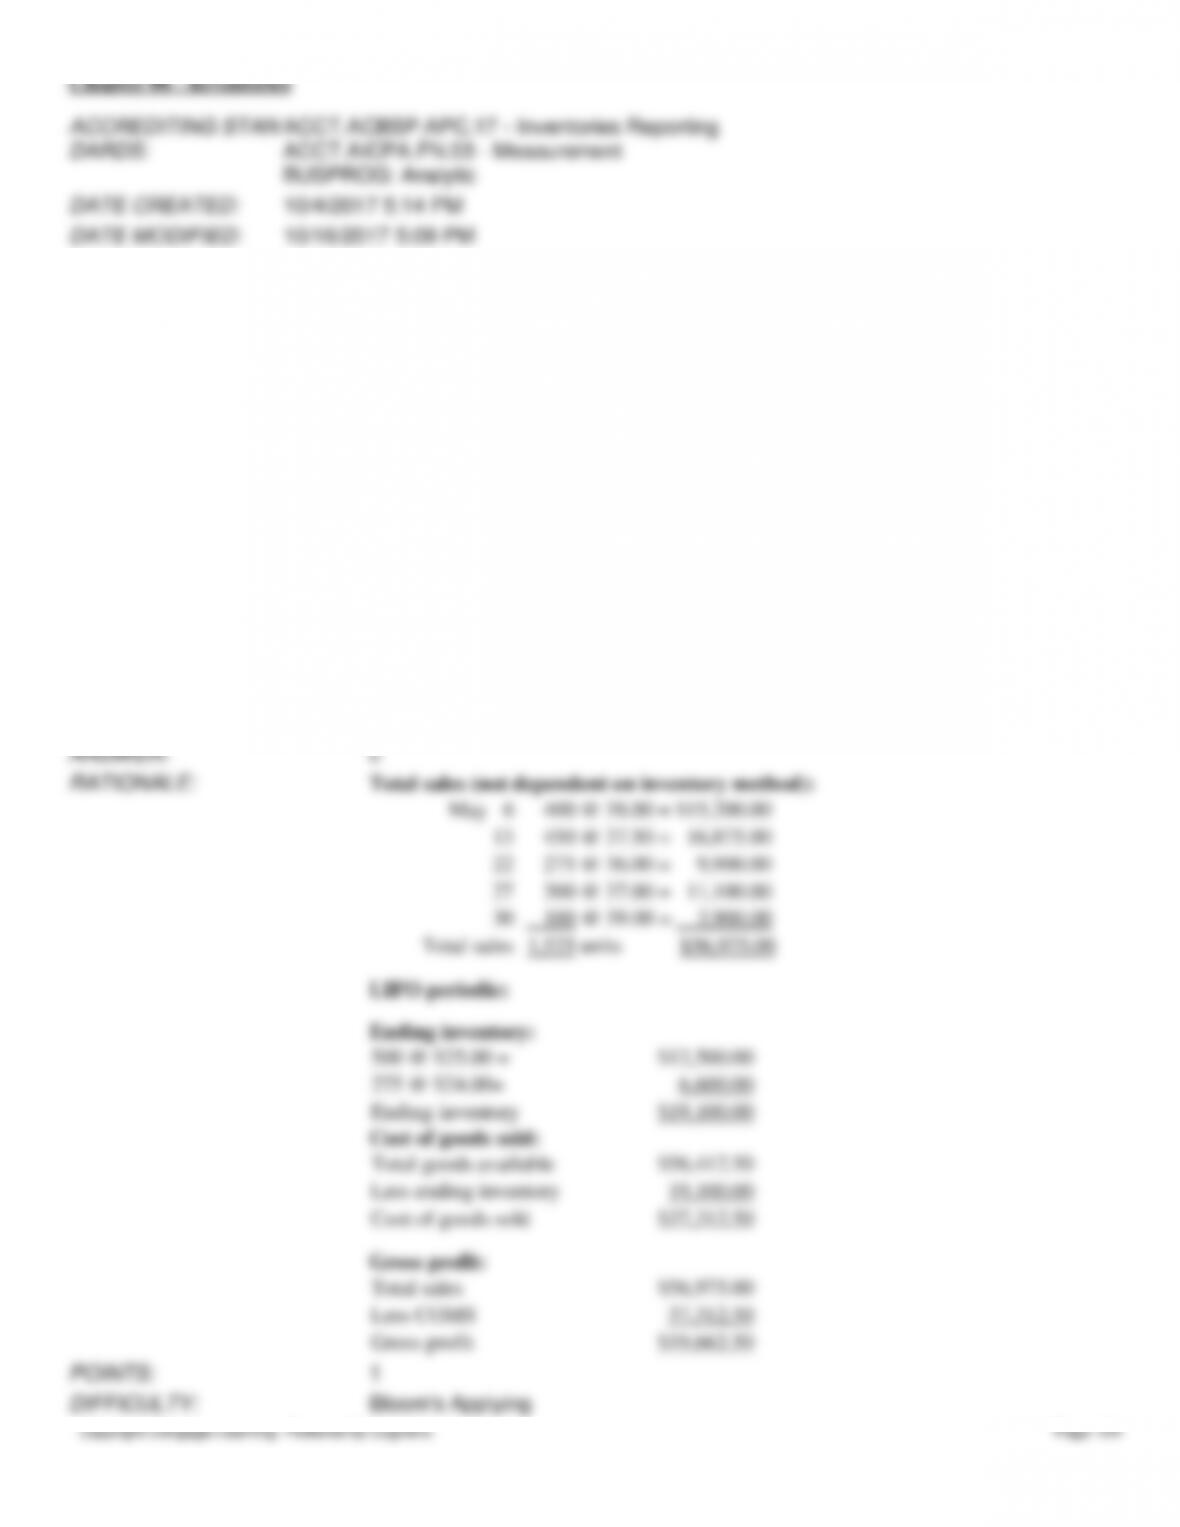
Total sales (not dependent on inventory method):
May 6
400 @ 38.00 = $15,200.00
13
450 @ 37.50 = 16,875.00
22
275 @ 36.00 = 9,900.00
27
300 @ 37.00 = 11,100.00
30
100 @ 39.00 = 3,900.00
Total sales
1,525 units $56,975.00
Chapter 06 – Inventories
Copyright Cengage Learning. Powered by Cognero.
Page 106
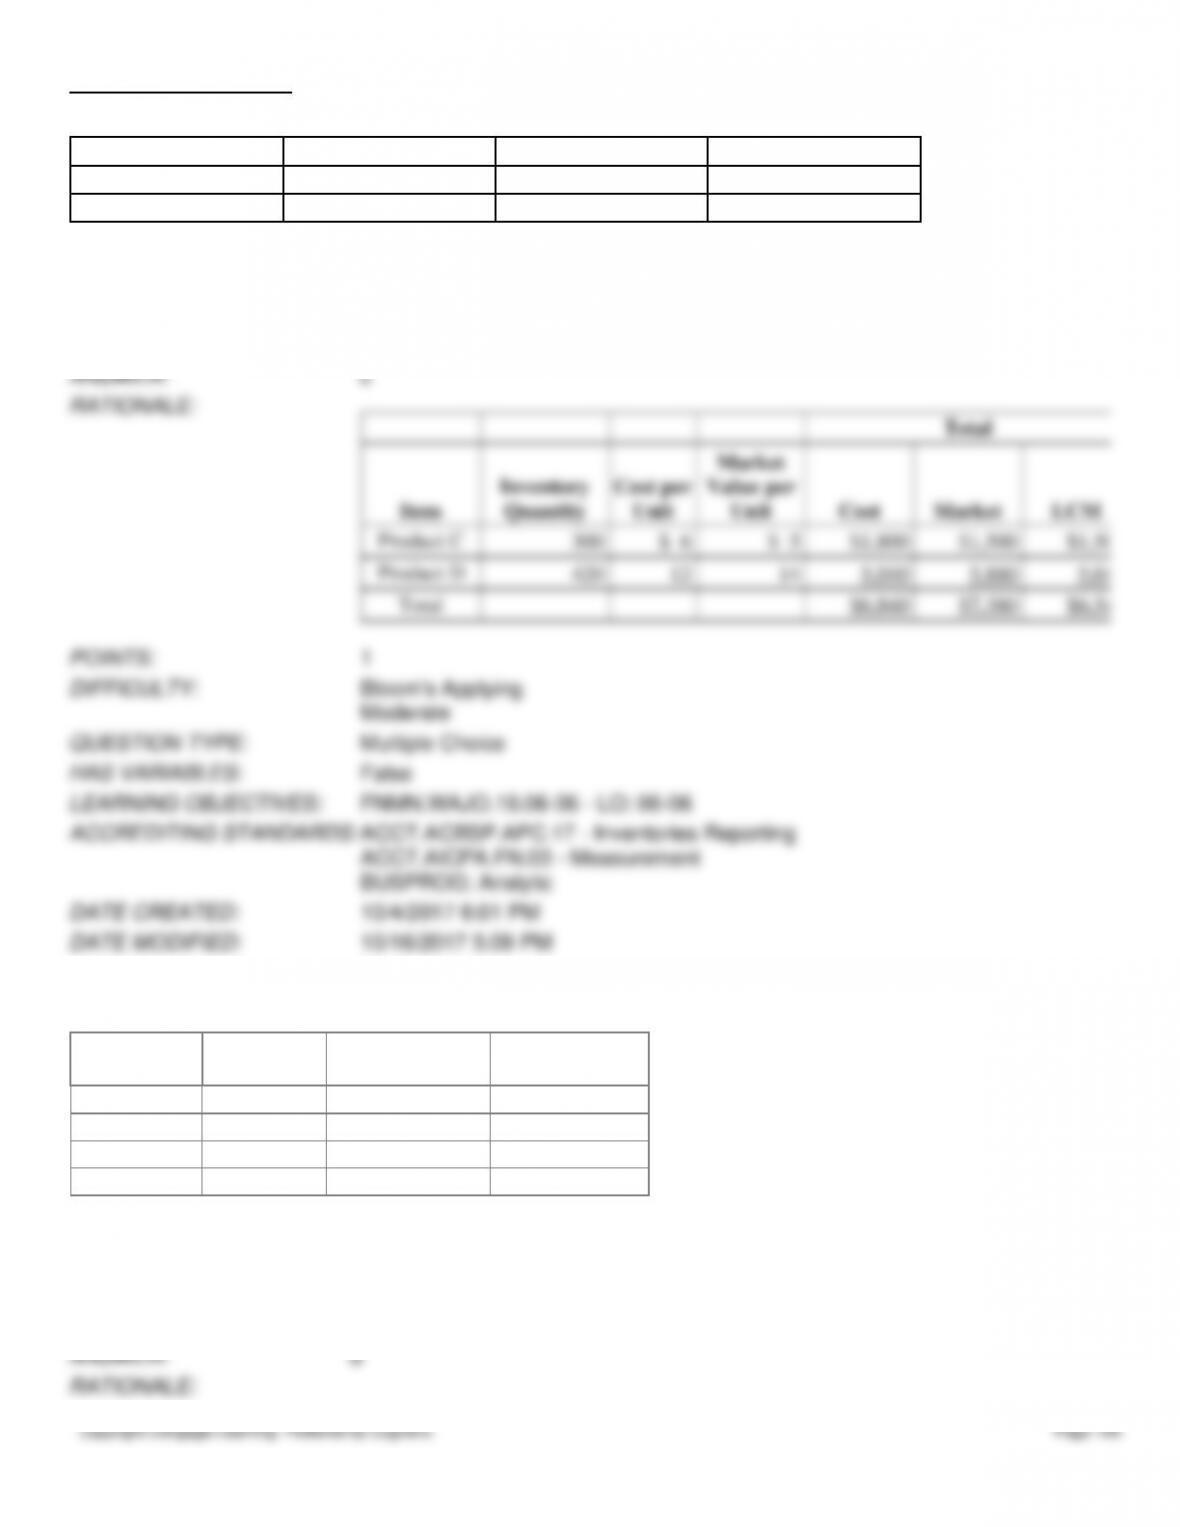
of cost or market to each inventory item.
Item
Inventory Quantity
Unit Cost Price
Unit Market Price
Product C
300
$ 6
$ 5
Product D
420
12
14
a.
$7,380
b.
$6,840
c.
$6,540
d.
$6,300
ANSWER:
c
RATIONALE:
Total
Item
Inventory
Quantity
Cost per
Unit
Market
Value per
Unit
Cost
Market
LCM
Product C
300
$ 6
$ 5
$1,800
$1,500
$1,500
Product D
420
12
14
5,040
5,880
5,040
Total
$6,840
$7,380
$6,540
POINTS:
1
DIFFICULTY:
Bloom’s Applying
Moderate
QUESTION TYPE:
Multiple Choice
HAS VARIABLES:
False
LEARNING OBJECTIVES:
FNMN.WAJO.19.06-06 – LO: 06–06
ACCREDITING STANDARDS:
ACCT.ACBSP.APC.17 – Inventories Reporting
ACCT.AICPA.FN.03 – Measurement
BUSPROG: Analytic
DATE CREATED:
10/4/2017 6:01 PM
DATE MODIFIED:
10/16/2017 5:09 PM
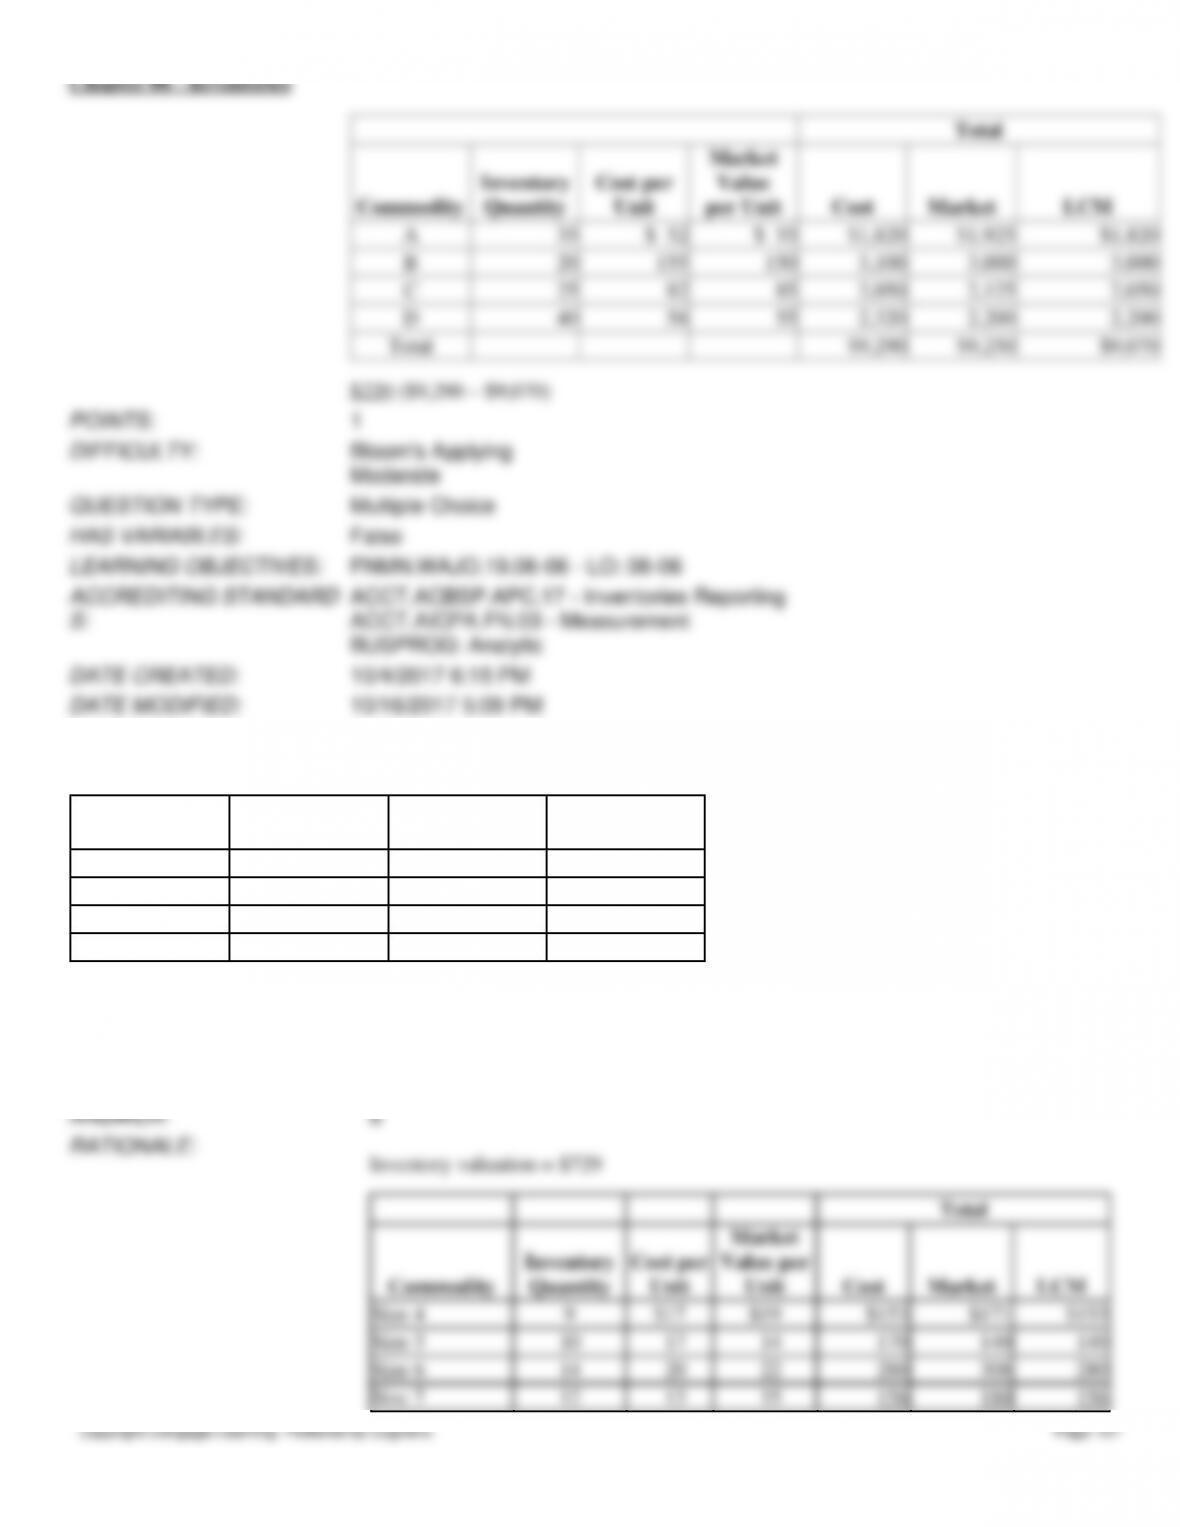
219. Basic inventory data for April 30 are presented below for a business that employs the lower-of-cost-or-market basis
of inventory valuation to each category.
Commodity
Inventory
Quantity
Cost per Unit
Market Value
per Unit
A
35
$ 52
$ 55
B
20
155
150
C
25
82
85
D
40
58
55
What is the amount of reduction in the inventory at April 30 attributable to market decline?
a.
$14
b.
$40
c.
$180
d.
$220
ANSWER:
d
RATIONALE:
Chapter 06 – Inventories
Copyright Cengage Learning. Powered by Cognero.
Page 110
sold; and (3) number of days’ sales in inventory for the current year? Use a 365-day year.
Item
Prior Year
Current Year
Cost of goods sold
$172,900
$215,000
Inventory
18,000
12,000
a.
(1) 14.33 times
(2) $589.04
(3) 24.5 days
b.
(1) 23.88 times
(2) $589.04
(3) 15.3 days
c.
(1) 13.43 times
(2) $597.22
(3) 26.8 days
d.
(1) 14.33 times
(2) $597.22
(3) 25.1 days
ANSWER:
a
RATIONALE:
(1)
$215,000 ÷[($18,000 + $12,000)/2]=
$215,000 ÷ $15,000 = 14.33 times
(2)
$215,000 ÷ 365 = $589.04
(3)
$15,000 ÷ $589.04 = 24.5 days
POINTS:
1
DIFFICULTY:
Bloom’s Applying
Moderate
QUESTION TYPE:
Multiple Choice
HAS VARIABLES:
False
LEARNING OBJECTIVES:
FNMN.WAJO.19.06-07 – LO: 06–07
ACCREDITING STANDARDS:
ACCT.ACBSP.APC.17 – Inventories Reporting
ACCT.AICPA.FN.03 – Measurement
BUSPROG: Analytic
DATE CREATED:
10/4/2017 6:42 PM
DATE MODIFIED:
10/16/2017 5:09 PM
225. The following data were taken from Castle, Inc.
Cost of goods sold
$894,000
Inventory, end of year
78,000
Inventory, beginning of the year
92,000
What is (1) the inventory turnover ratio and (2) the number of days’ sales in inventory for Castle Inc.
a.
(1) 11.46 times
(2) 31.85 days
b.
(1) 10.52 times
(2) 34.70 days
c.
(1) 9.72 times