Chapter 02 – Double-Entry Accounting
Copyright Cengage Learning. Powered by Cognero.
Page 109
HAS VARIABLES:
False
LEARNING OBJECTIVES:
FNMN.WAJO.19.02-04 – LO: 02–04
ACCREDITING STANDARDS:
ACCT.ACBSP.APC.05 – Accounting Cycle
ACCT.ACBSP.APC.09 – Financial Statements
ACCT.AICPA.FN.03 – Measurement
BUSPROG: – Analytic
DATE CREATED:
8/16/2017 5:53 PM
DATE MODIFIED:
10/16/2017 4:20 PM
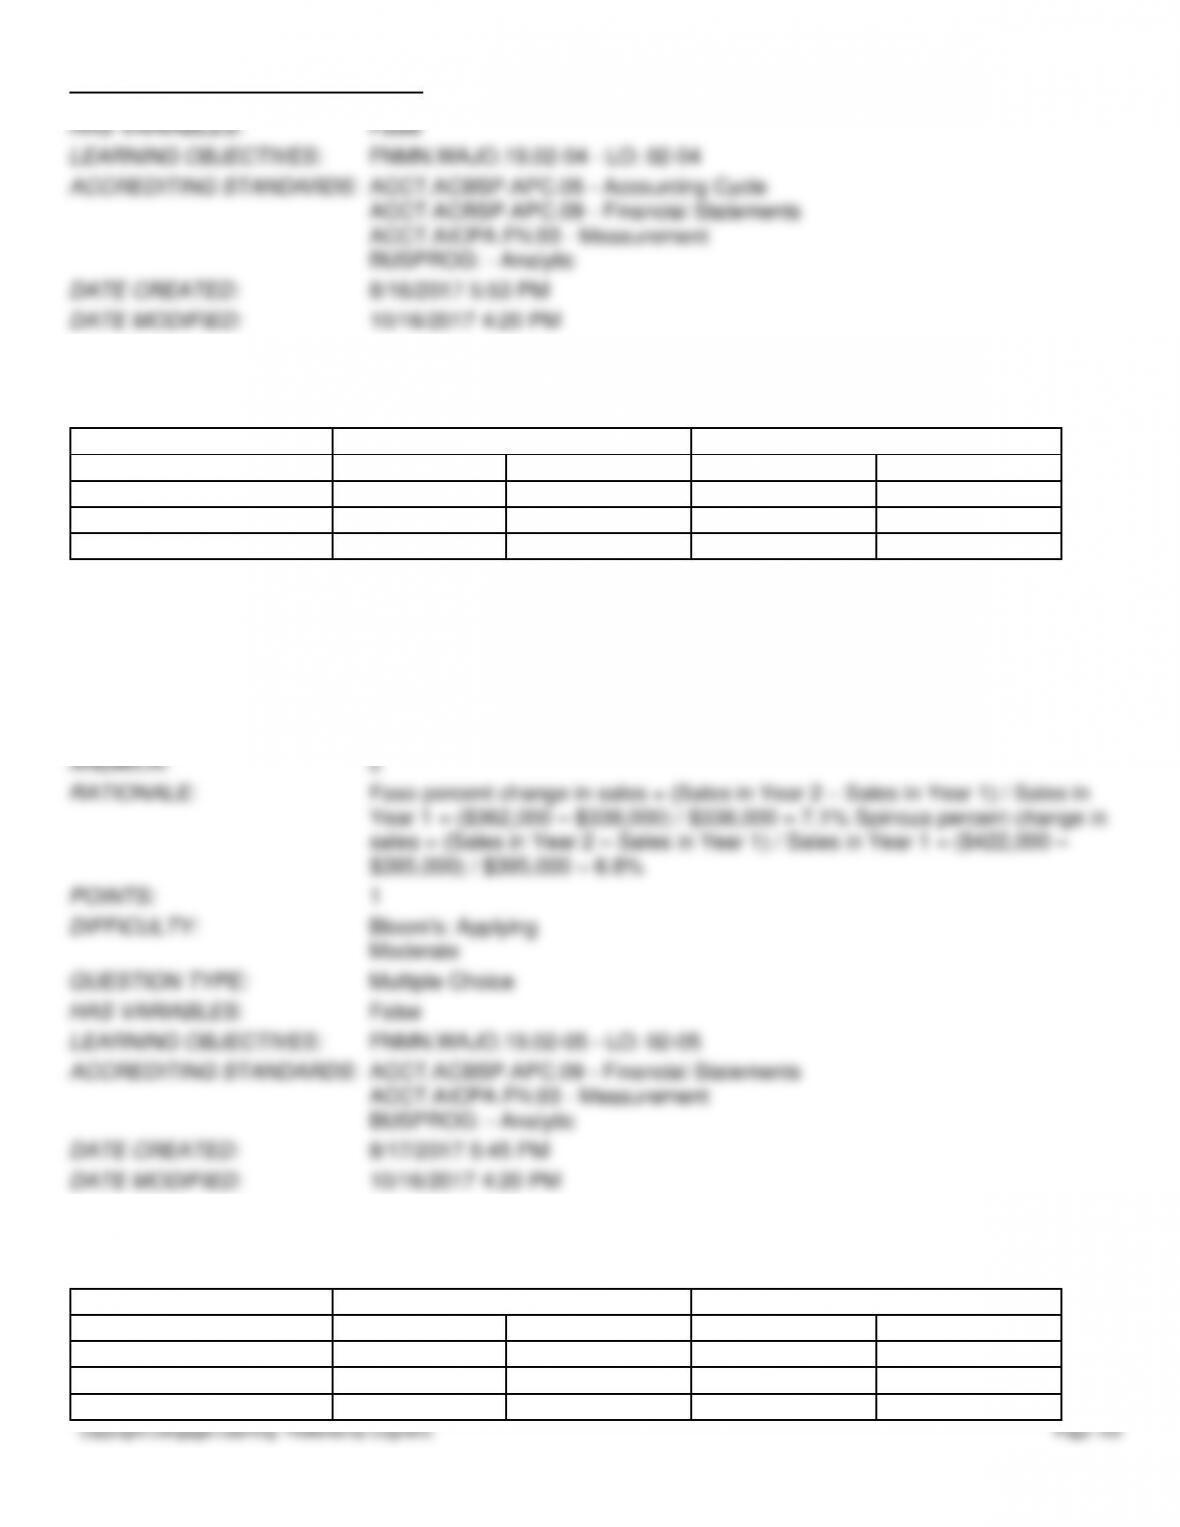
234. Faso Fabricating, Inc. and Spinoza Fabrication Corp. are in the same industry and are located in the same region of
the country. They have condensed income statements as shown.
Faso Fabricating, Inc.
Spinoza Fabrication Corp.
Year 2
Year 1
Year 2
Year 1
Sales
$362,000
$338,000
$422,000
$395,000
Total operating expenses
285,000
245,000
305,000
285,000
Net income
77,000
93,000
117,000
110,000
Using horizontal analysis, calculate the percent change for sales for each company. Round percentages to one decimal
place.
a.
Faso: 27.5%; Spinoza: 27.8%
b.
Faso: 6.6%; Spinoza: 6.4%
c.
Faso: 7.1%; Spinoza: 6.8%
d.
Faso: 16.3%; Spinoza: 7.0%
ANSWER:
c
RATIONALE:
Faso percent change in sales = (Sales in Year 2 – Sales in Year 1) / Sales in
Year 1 = ($362,000 – $338,000) / $338,000 = 7.1% Spinoza percent change in
sales = (Sales in Year 2 – Sales in Year 1) / Sales in Year 1 = ($422,000 –
$395,000) / $395,000 = 6.8%
POINTS:
1
DIFFICULTY:
Bloom’s: Applying
Moderate
QUESTION TYPE:
Multiple Choice
HAS VARIABLES:
False
LEARNING OBJECTIVES:
FNMN.WAJO.19.02-05 – LO: 02–05
ACCREDITING STANDARDS:
ACCT.ACBSP.APC.09 – Financial Statements
ACCT.AICPA.FN.03 – Measurement
BUSPROG: – Analytic
DATE CREATED:
8/17/2017 5:45 PM
DATE MODIFIED:
10/16/2017 4:20 PM
235. Faso Fabricating, Inc. and Spinoza Fabrication Corp. are in the same industry and are located in the same region of
the country. They have condensed income statements as shown.
Faso Fabricating, Inc.
Spinoza Fabrication Corp.
Year 2
Year 1
Year 2
Year 1
Sales
$362,000
$338,000
$422,000
$395,000
Total operating expenses
285,000
245,000
305,000
285,000
Net income
77,000
93,000
117,000
110,000
Chapter 02 – Double-Entry Accounting
Using horizontal analysis, calculate the percent change for net income for each company. Round percentages to one
decimal place.
a.
Faso: −17.2%; Spinoza: −6.4%
b.
Faso: −17.2%; Spinoza: 6.4%
c.
Faso: 17.2%; Spinoza: −6.4%
d.
Faso: 17.2%; Spinoza: 6.4%
ANSWER:
b
RATIONALE:
Faso percent change in net income = (Net income in Year 2 – Net income in
Year 1) / Net income in Year 1 = ($77,000 – $93,000) / $93,000 = –17.2%;
Spinoza percent change in net income = (Net income in Year 2 – Net income
in Year 1) / Net income in Year 1 = ($117,000 – $110,000) / $110,000 = 6.4%
POINTS:
1
DIFFICULTY:
Bloom’s: Applying
Moderate
QUESTION TYPE:
Multiple Choice
HAS VARIABLES:
False
LEARNING OBJECTIVES:
FNMN.WAJO.19.02-05 – LO: 02–05
ACCREDITING STANDARDS:
ACCT.ACBSP.APC.09 – Financial Statements
ACCT.AICPA.FN.03 – Measurement
BUSPROG – Analytic
DATE CREATED:
8/17/2017 5:50 PM
DATE MODIFIED:
10/16/2017 4:20 PM
236. Faso Fabricating, Inc. and Spinoza Fabrication Corp. are in the same industry and are located in the same region of
the country. They have condensed income statements as shown.
Faso Fabricating, Inc.
Spinoza Fabrication Corp.
Year 2
Year 1
Year 2
Year 1
Sales
$362,000
$338,000
$422,000
$395,000
Total operating expenses
285,000
245,000
305,000
285,000
Net income
77,000
93,000
117,000
110,000
(a) Prepare a horizontal analysis for the two companies.
(b) Analyze the changes from Year 1 to Year 2 for both companies.
ANSWER:
(a)
Faso Fabricating, Inc.
Spinoza Fabrication Corp.
Year 2
Year 1
Increas
e/
Decrea
Perce
nt
Year 2
Year 1
Increas
e/
Decrea
Perce
nt