Chapter 14 – Financial Statement Analysis
Sales on account
950,000
825,000
(a)
Assuming that credit terms on all sales are n/45, determine for each year (1) the accounts receivable
turnover and (2) the number of days’ sales in receivables.
Round intermediate calculations to whole numbers and final answers to two decimal places.
(b)
Comment on any significant trends revealed by the data.
ANSWER:
(a)
Current
Preceding
Year
Year
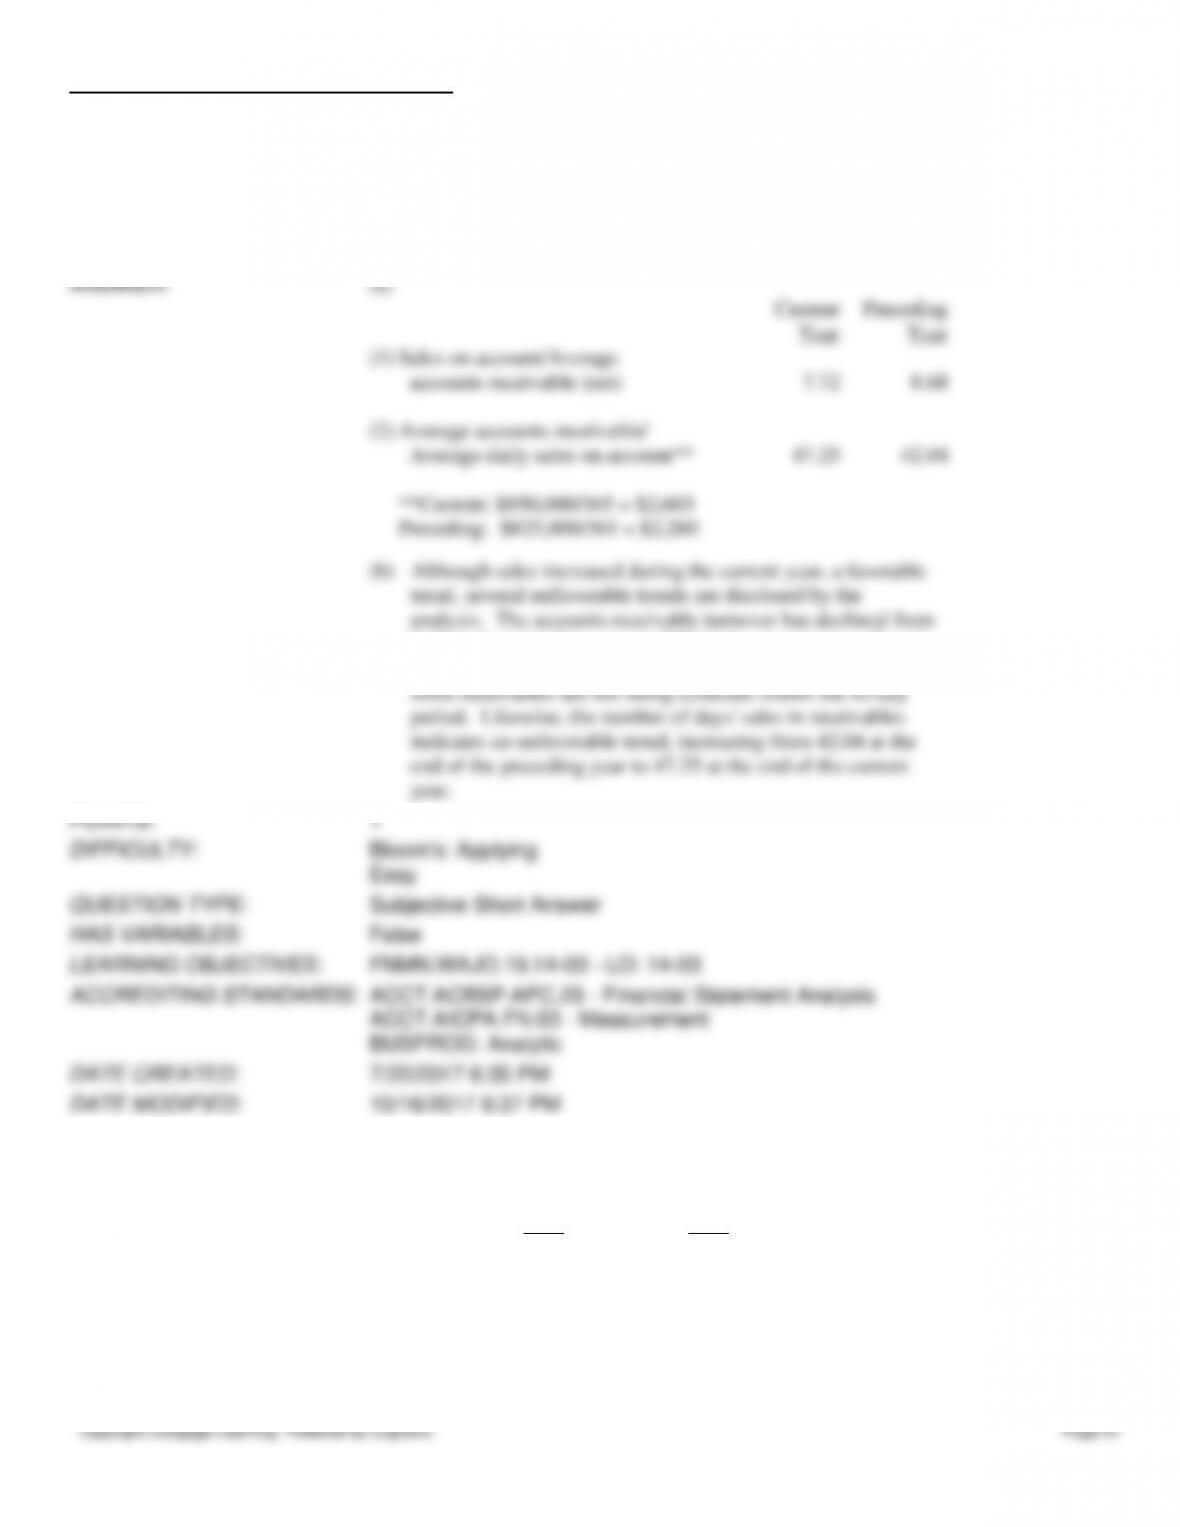
(1)
Sales on account/Average
accounts receivable (net)
7.72
8.68
(2)
Average accounts receivable/
Average daily sales on account**
47.25
42.04
**Current: $950,000/365 = $2,603
Preceding: $825,000/365 = $2,260
(b)
Although sales increased during the current year, a favorable
trend, several unfavorable trends are disclosed by the
analysis. The accounts receivable turnover has declined from
8.68 in the preceding year to 7.72 in the current year. Based
on credit terms of n/45, a turnover of less than 8 indicates that
some receivables are not being collected within the 45-day
period. Likewise, the number of days’ sales in receivables
indicates an unfavorable trend, increasing from 42.04 at the
end of the preceding year to 47.25 at the end of the current
year.
POINTS:
1
DIFFICULTY:
Bloom’s: Applying
Easy
QUESTION TYPE:
Subjective Short Answer
HAS VARIABLES:
False
LEARNING OBJECTIVES:
FNMN.WAJO.19.14–03 – LO: 14–03
ACCREDITING STANDARDS:
ACCT.ACBSP.APC.23 – Financial Statement Analysis
ACCT.AICPA.FN.03 – Measurement
BUSPROG: Analytic
DATE CREATED:
7/22/2017 6:35 PM
DATE MODIFIED:
10/16/2017 6:37 PM
183. The following data are taken from the financial statements:
Current
Preceding
Year
Year
Sales
$3,600,000
$4,000,000
Cost of goods sold
2,000,000
2,700,000
Beginning inventory
372,000
352,000
Inventory, end of year
390,000
372,000
(a)
Determine for each year (1) the inventory turnover, round answer to one decimal place.
(2) the number of days’ sales in inventory. Round intermediate calculations to whole
Chapter 14 – Financial Statement Analysis
Copyright Cengage Learning. Powered by Cognero.
Page 82
numbers and final answers to two decimal places.
(b)
Comment on the favorable and unfavorable trends revealed by the data.
ANSWER:
(a)
Current
Preceding
Year
Year
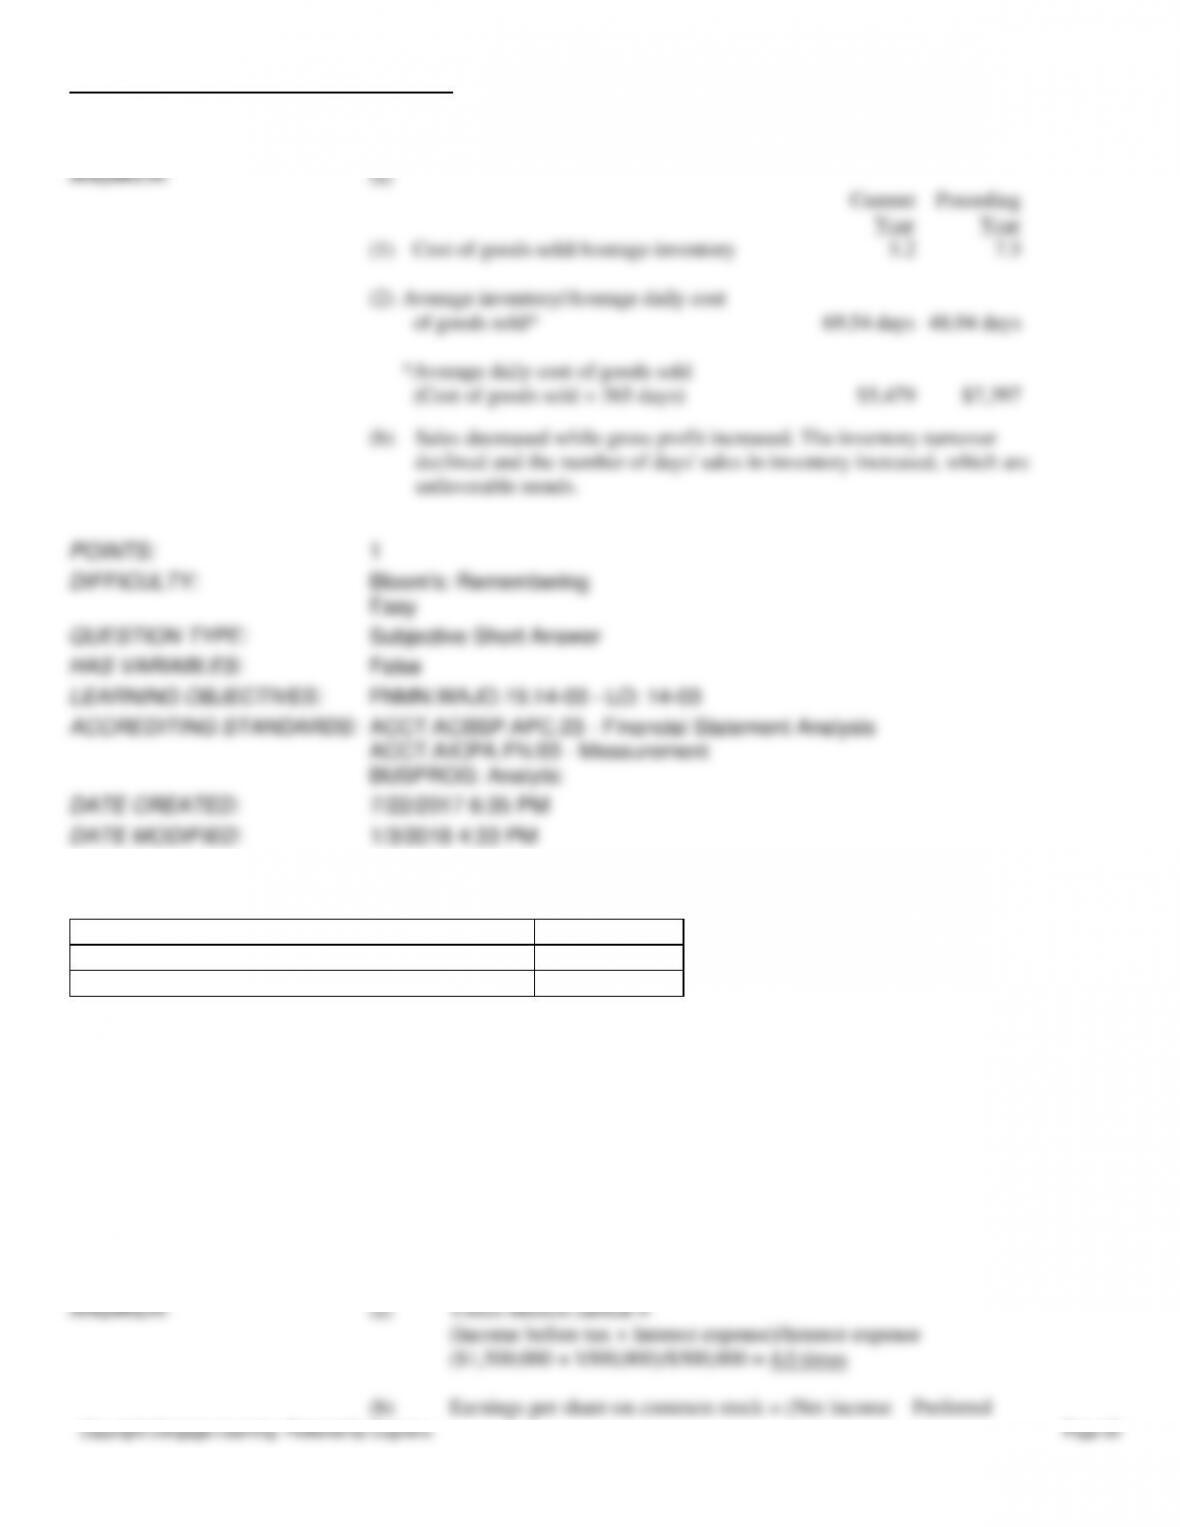
(1)
Cost of goods sold/Average inventory
5.2
7.5
(2)
Average inventory/Average daily cost
of goods sold*
69.54 days
48.94 days
*Average daily cost of goods sold
(Cost of goods sold ÷ 365 days)
$5,479
$7,397
(b)
Sales decreased while gross profit increased. The inventory turnover
declined and the number of days’ sales in inventory increased, which are
unfavorable trends.
POINTS:
1
DIFFICULTY:
Bloom’s: Remembering
Easy
QUESTION TYPE:
Subjective Short Answer
HAS VARIABLES:
False
LEARNING OBJECTIVES:
FNMN.WAJO.19.14–03 – LO: 14–03
ACCREDITING STANDARDS:
ACCT.ACBSP.APC.23 – Financial Statement Analysis
ACCT.AICPA.FN.03 – Measurement
BUSPROG: Analytic
DATE CREATED:
7/22/2017 6:35 PM
DATE MODIFIED:
1/3/2018 4:33 PM
184. The balance sheet for Seuss Company at the end of the current fiscal year indicated the following:
Bonds payable, 10% (20-year term)
$5,000,000
Preferred 10% stock, $100 par
1,000,000
Common stock, $10 par
2,000,000
Income before income tax was $1,500,000 and income taxes were $200,000 for the current year. Cash dividends paid on
common stock during the current year totaled $150,000. The common stock sells for $75 per share at the end of the year.
Determine each of the following:
(a)
Times interest earned
(b)
Earnings per share on common stock
(c)
Price-earnings ratio
(d)
Dividends per share of common stock
(e)
Dividend yield
Round to one decimal place except earnings per share and dividends per share, which should be rounded to two decimal
places.
ANSWER:
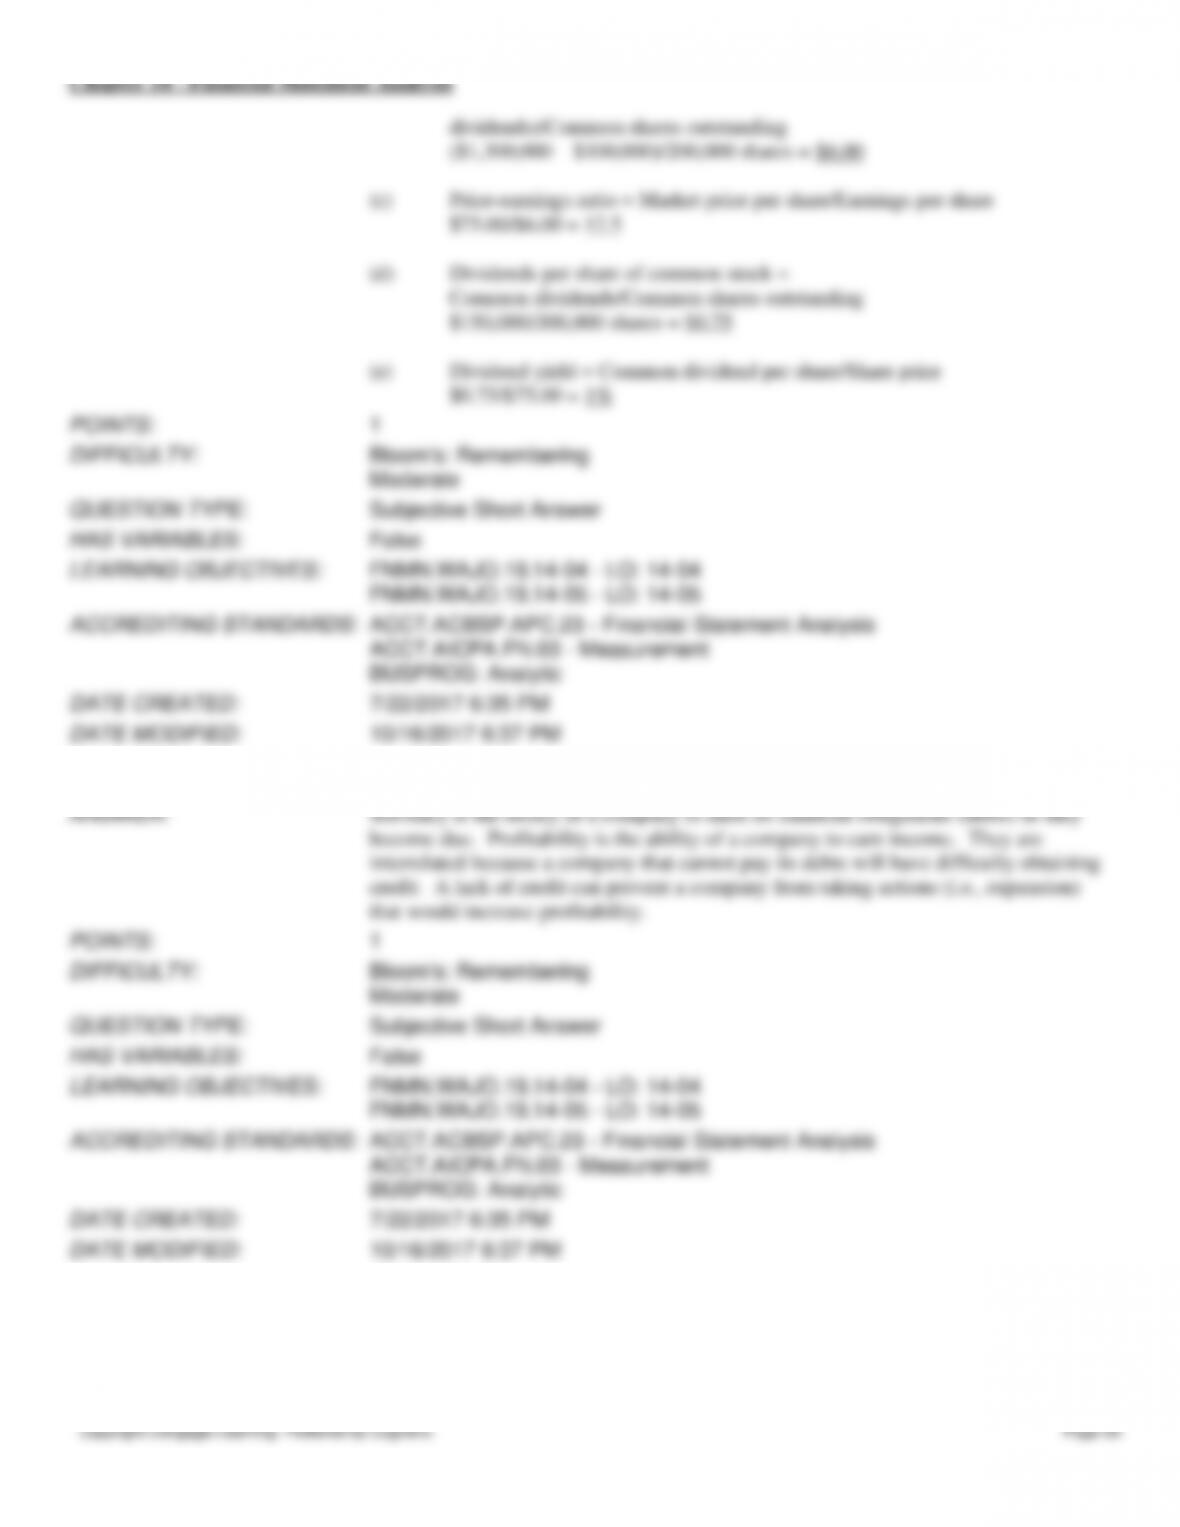
(a)
Times interest earned =
(Income before tax + Interest expense)/Interest expense
($1,500,000 + $500,000)/$500,000 = 4.0 times
(b)
Earnings per share on common stock = (Net income – Preferred
Chapter 14 – Financial Statement Analysis
Copyright Cengage Learning. Powered by Cognero.
Page 84
Determine the asset turnover ratio. Round your answer to one decimal place.
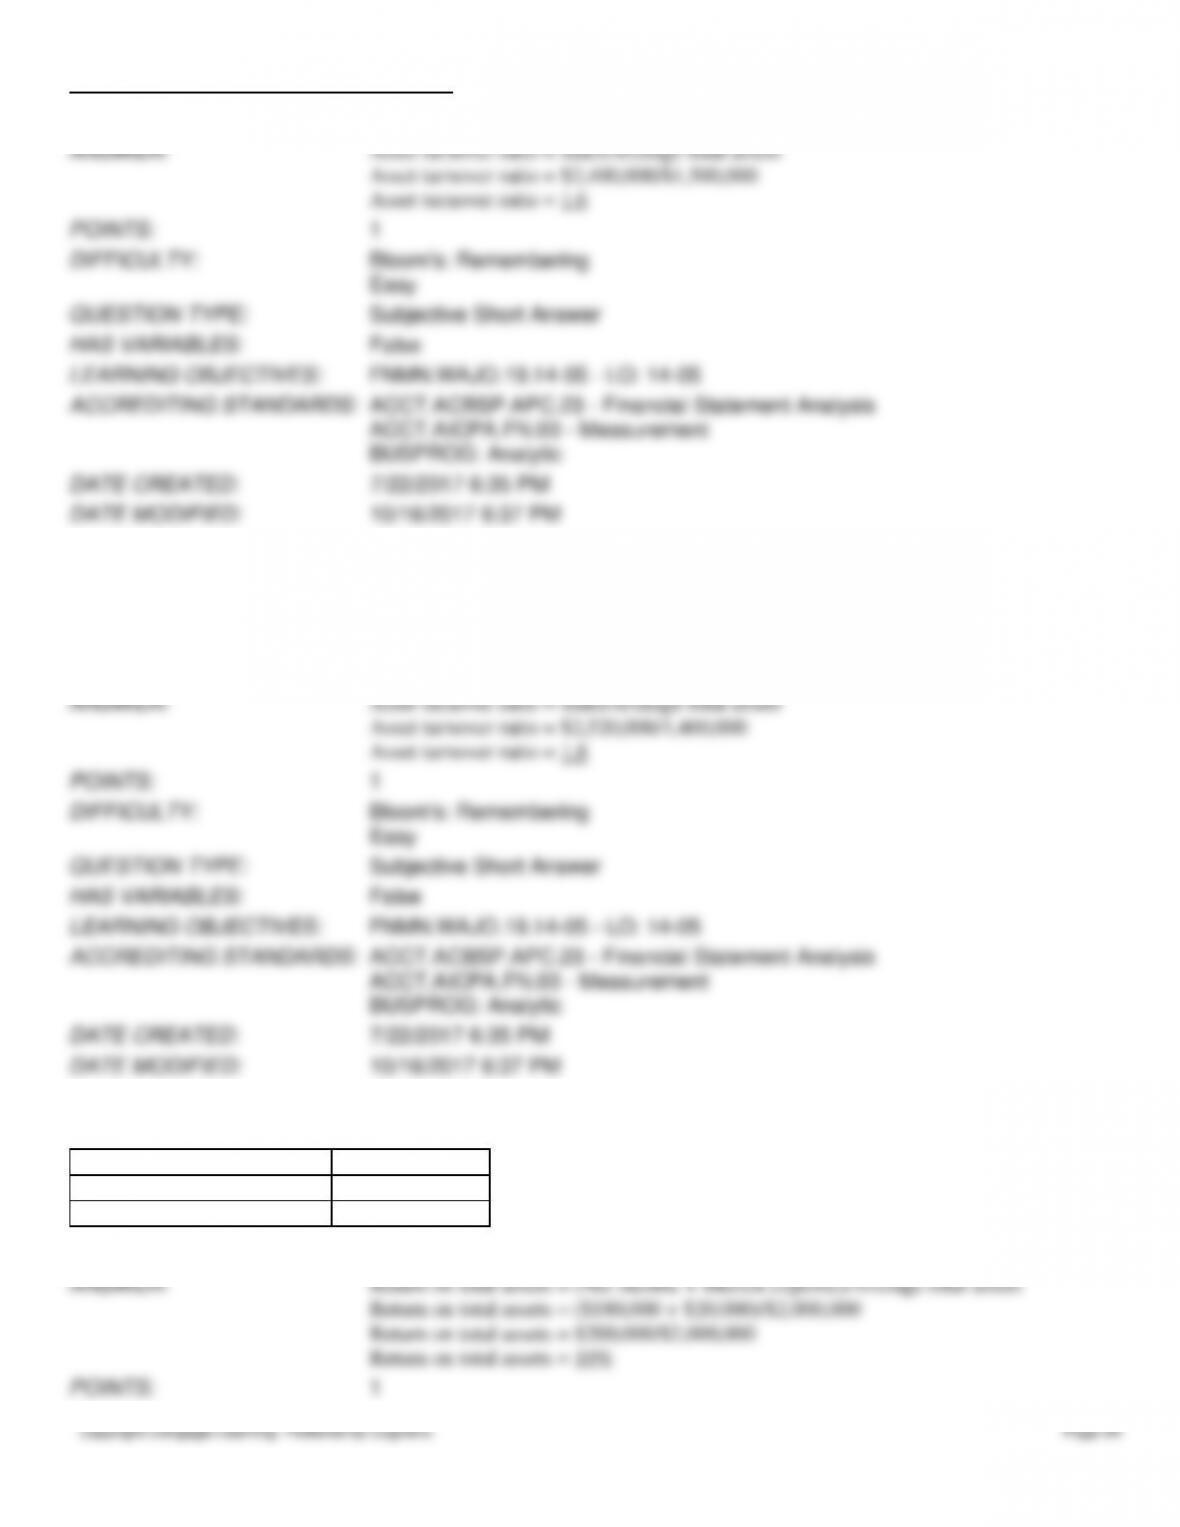
ANSWER:
Asset turnover ratio = Sales/Average total assets
Asset turnover ratio = $2,400,000/$1,500,000
Asset turnover ratio = 1.6
POINTS:
1
DIFFICULTY:
Bloom’s: Remembering
Easy
QUESTION TYPE:
Subjective Short Answer
HAS VARIABLES:
False
LEARNING OBJECTIVES:
FNMN.WAJO.19.14–05 – LO: 14–05
ACCREDITING STANDARDS:
ACCT.ACBSP.APC.23 – Financial Statement Analysis
ACCT.AICPA.FN.03 – Measurement
BUSPROG: Analytic
DATE CREATED:
7/22/2017 6:35 PM
DATE MODIFIED:
10/16/2017 6:37 PM
187. A company reports the following:
Sales
$2,520,000
Average total assets (excluding long-term investments)
1,400,000
Determine the asset turnover ratio. Round your answer to one decimal place.
ANSWER:
Asset turnover ratio = Sales/Average total assets
Asset turnover ratio = $2,520,000/1,400,000
Asset turnover ratio = 1.8
POINTS:
1
DIFFICULTY:
Bloom’s: Remembering
Easy
QUESTION TYPE:
Subjective Short Answer
HAS VARIABLES:
False
LEARNING OBJECTIVES:
FNMN.WAJO.19.14–05 – LO: 14–05
ACCREDITING STANDARDS:
ACCT.ACBSP.APC.23 – Financial Statement Analysis
ACCT.AICPA.FN.03 – Measurement
BUSPROG: Analytic
DATE CREATED:
7/22/2017 6:35 PM
DATE MODIFIED:
10/16/2017 6:37 PM
188. A company reports the following income statement and balance sheet information for the current year:
Net income
$ 180,000
Interest expense
20,000
Average total assets
2,000,000
Determine the return on total assets. Round your answer to one decimal place.
ANSWER:
Return on total assets = (Net income + Interest expense)/Average total assets
Return on total assets = ($180,000 + $20,000)/$2,000,000
Return on total assets = $200,000/$2,000,000
Return on total assets = 10%
POINTS:
1
Chapter 14 – Financial Statement Analysis
Total assets
$3,000,000
$2,700,000
$2,400,000
Notes payable (10% interest)
1,000,000
1,000,000
1,000,000
Common stock
400,000
400,000
400,000
Preferred $6 stock, $100 par
200,000
200,000
200,000
Retained earnings
1,126,000
896,000
600,000
The Year 3 net income was $242,000 and the Year 2 net income was $308,000. No dividends on common stock were
declared during the 3 years.
(a) Determine the return on total assets, the return on stockholders’ equity, and the return on
common stockholders’ equity for Years 2 and 3. Round to one decimal place.
(b) What conclusion can be drawn from these data as to the company’s profitability?
ANSWER:
(a)
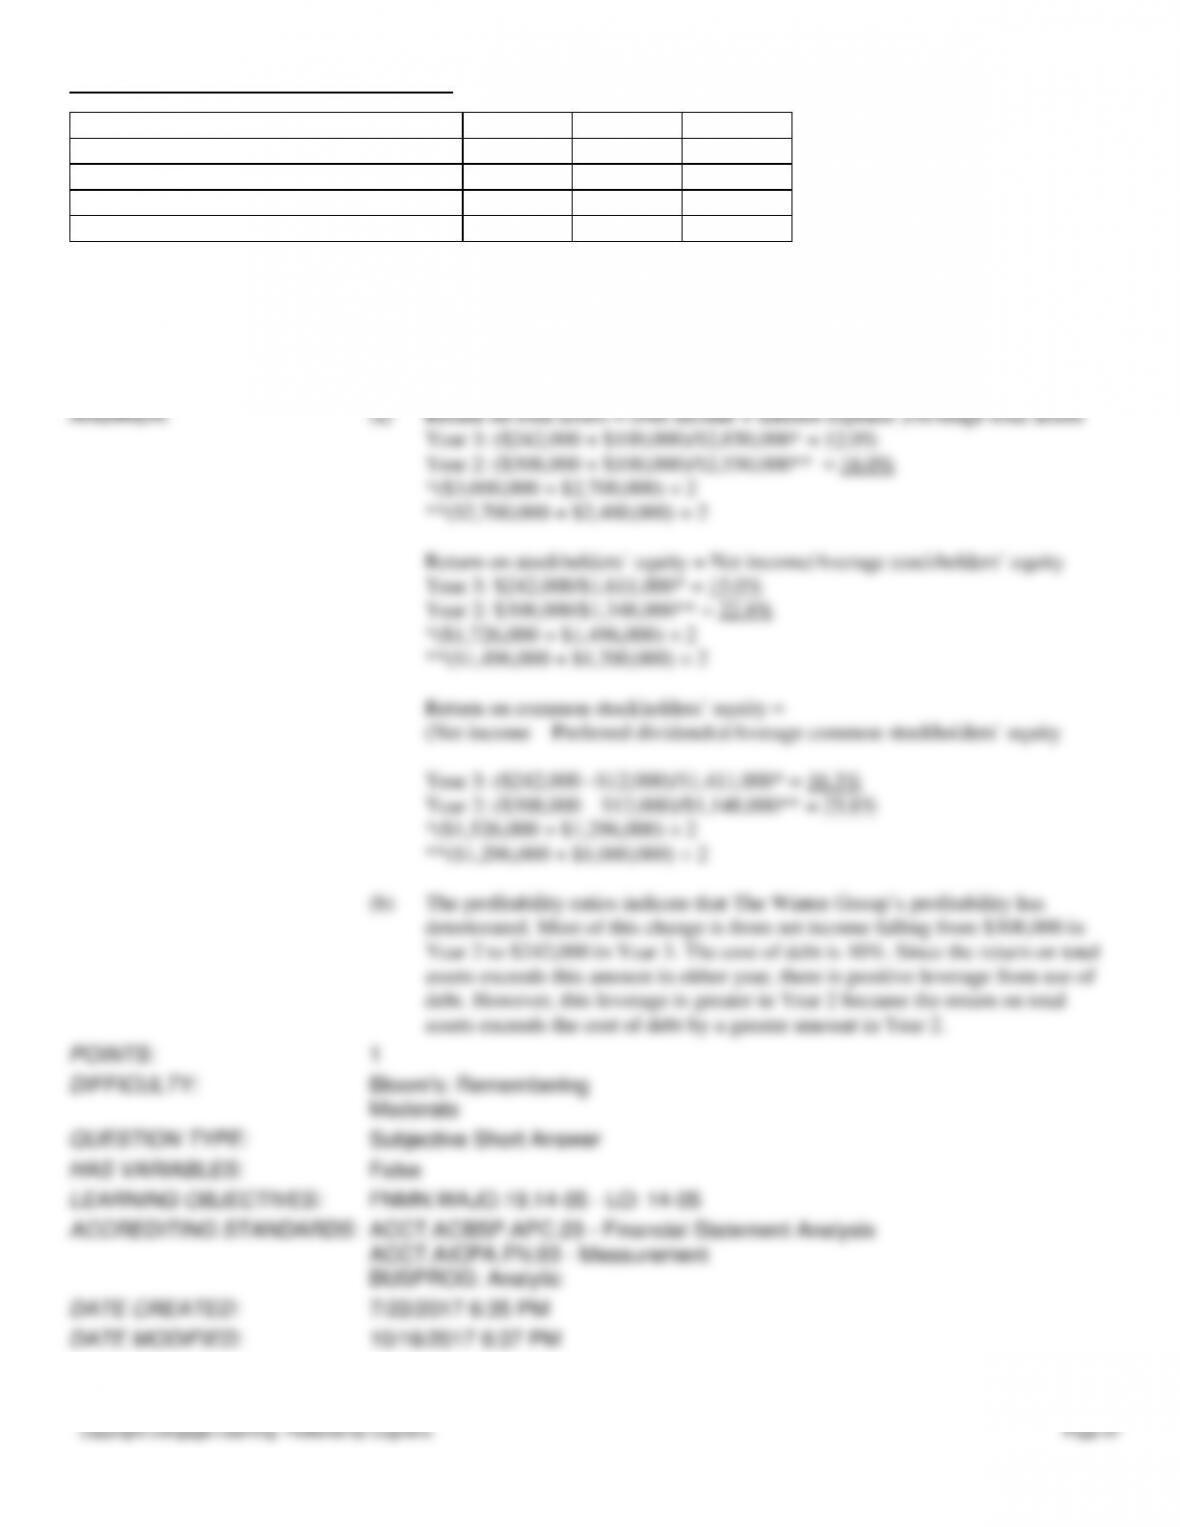
Return on total assets = (Net income + Interest expense )/Average total assets
Year 3: ($242,000 + $100,000)/$2,850,000* = 12.0%
Year 2: ($308,000 + $100,000)/$2,550,000** = 16.0%
*($3,000,000 + $2,700,000) ÷ 2
**($2,700,000 + $2,400,000) ÷ 2
Return on stockholders’ equity = Net income/Average stockholders’ equity
Year 3: $242,000/$1,611,000* = 15.0%
Year 2: $308,000/$1,348,000** = 22.8%
*($1,726,000 + $1,496,000) ÷ 2
**($1,496,000 + $1,200,000) ÷ 2
Return on common stockholders’ equity =
(Net income – Preferred dividends)/Average common stockholders’ equity
Year 3: ($242,000 –$12,000)/$1,411,000* = 16.3%
Year 2: ($308,000 – $12,000)/$1,148,000** = 25.8%
*($1,526,000 + $1,296,000) ÷ 2
**($1,296,000 + $1,000,000) ÷ 2
Chapter 14 – Financial Statement Analysis
False
FNMN.WAJO.19.14–05 – LO: 14–05
Common stock, $20 par value (no change during the year)
Preferred 10% stock, $40 par (no change during the year)
Total assets
$2,000,000
Average total assets
2,200,000
Net income
250,000
Sales
1,300,000
Average common stockholders’ equity
1,000,000
Net cash provided by operating activities
275,000
Shares of common stock outstanding
10,000
Long-term investments
400,000
Calculate: (a) asset turnover ratio; (b) return on total assets; (c) return on common stockholders’
equity; and (d) earnings per share on common stock. Assume the company had no preferred stock or interest
expense. Round dollar values to two decimal places and other final answers to one decimal place.
ANSWER:
With the information provided, the profitability ratios that can be calculated are as
follows:
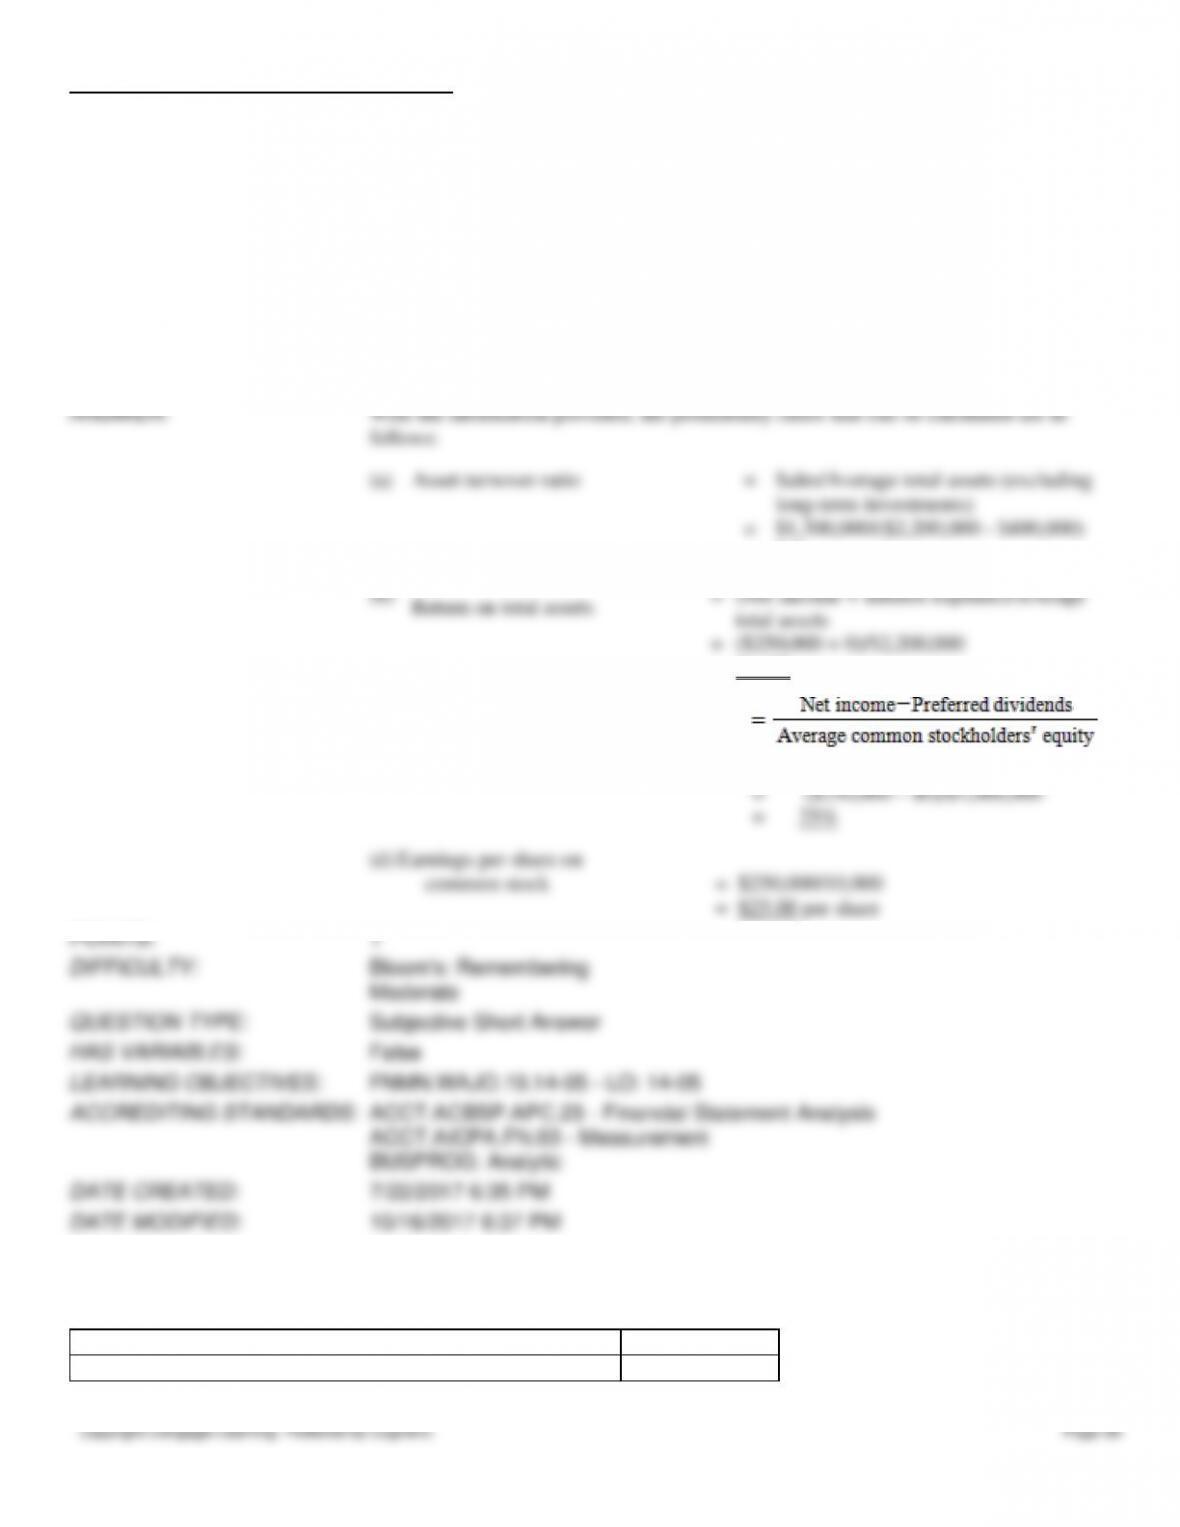
(a)
Asset turnover ratio
=
Sales/Average total assets (excluding
long-term investments)
=
$1,300,000/($2,200,000 – $400,000)
=
0.7
(b)
Return on total assets
=
(Net income + Interest expense)/Average
total assets
=
($250,000 + 0)/$2,200,000
=
11.4%
(c)
Return on common stockholders’ equity
=
($250,000 – $0)/$1,000,000
=
25%
(d)
Earnings per share on
common stock
=
$250,000/10,000
=
$25.00 per share
POINTS:
1
DIFFICULTY:
Bloom’s: Remembering
Moderate
Chapter 14 – Financial Statement Analysis
Preferred dividends declared
Common dividends declared
ratio on common stock, and (f) dividend yield. The current market price per share of
The net income was $600,000, and the declared dividends on the common stock were $125,000 for the current year. The
market price of the common stock is $20 per share.
Calculate for the common stock:
(a) earnings per share
(b) the price-earnings ratio
(c) the dividends per share and the dividend yield
Round to one decimal place except earnings per share, which should be rounded to two decimal places.
ANSWER:
(a)
Earnings per share = (Net income – Preferred dividends)/Common shares
outstanding = ($600,000 – 200,000)/250,000 shares = $1.60
(b)
Price-earnings ratio = Market price per share/Earnings per share =
$20.00/$1.60 = 12.5
(c)
Dividends per share = Common dividends/Common shares outstanding =
$125,000/ 250,000 shares = $0.50
Dividend yield = Dividends per share of common stock/Market price per share
of common stock = $0.50/$20.00 = 2.5%
POINTS:
1
DIFFICULTY:
Bloom’s: Remembering
Moderate
QUESTION TYPE:
Subjective Short Answer
HAS VARIABLES:
False
LEARNING OBJECTIVES:
FNMN.WAJO.19.14–05 – LO: 14–05
ACCREDITING STANDARDS:
ACCT.ACBSP.APC.23 – Financial Statement Analysis
ACCT.AICPA.FN.03 – Measurement
BUSPROG: Analytic
DATE CREATED:
7/22/2017 6:35 PM
DATE MODIFIED:
10/16/2017 6:37 PM
195. The following data are taken from the financial statements:
Current
Year
Preceding
Year
Current assets
$ 745,000
$ 820,000
Property, plant, and equipment
1,510,000
1,400,000
Current liabilities
(non-interest-bearing)
160,000
140,000
Long-term liabilities, 12%
400,000
400,000
Preferred 10% stock
250,000
250,000
Common stock, $25 par
1,200,000
1,200,000
Retained earnings,
beginning of year
230,000
160,000
Net income for year
110,000
155,000