Chapter 14 – Financial Statement Analysis
Copyright Cengage Learning. Powered by Cognero.
Page 71
Total liabilities and
stockholders’ equity
$1,125
$800
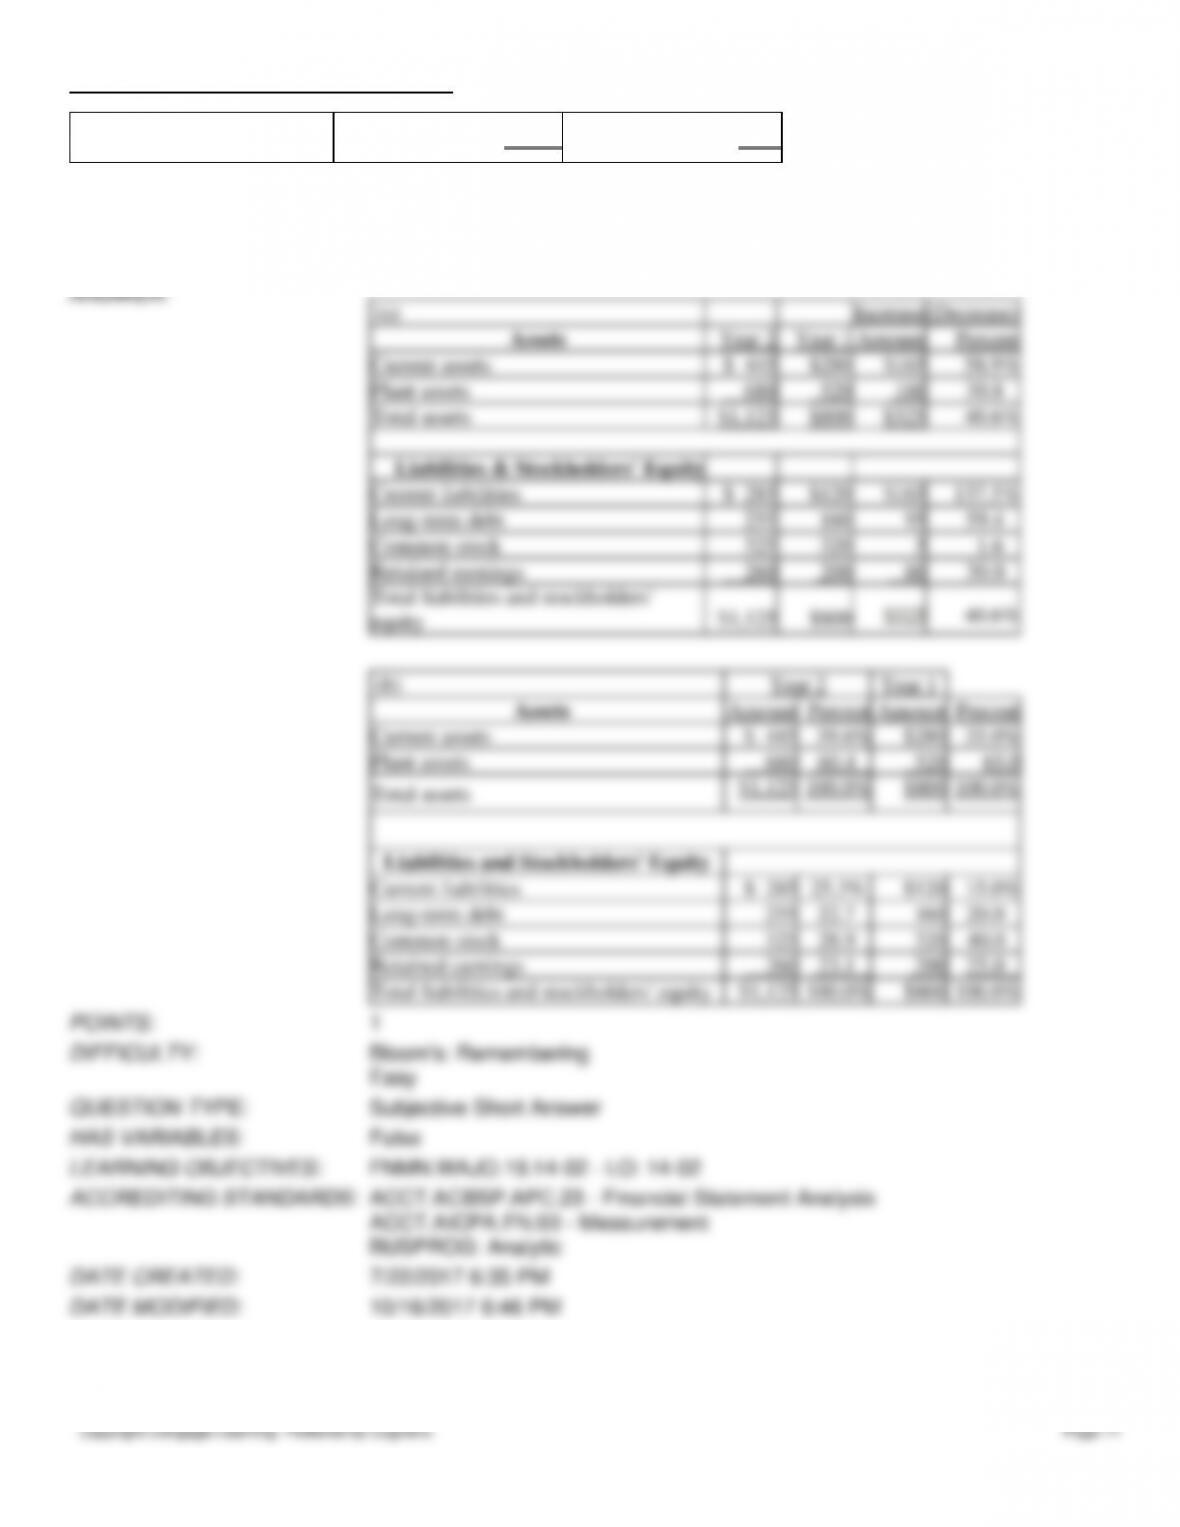
(a)
Using horizontal analysis, show the percentage change for each balance sheet item
using Year 1 as a base year.
(b)
Using vertical analysis, prepare a comparative balance sheet.
Round percentages to one decimal place.
ANSWER:
(a)
Increase
(Decrease)
Assets
Year 2
Year 1
Amount
Percent
Current assets
$ 445
$280
$165
58.9%
Plant assets
680
520
160
30.8
Total assets
$1,125
$800
$325
40.6%
Liabilities & Stockholders’ Equity
Current liabilities
$ 285
$120
$165
137.5%
Long-term debt
255
160
95
59.4
Common stock
325
320
5
1.6
Retained earnings
260
200
60
30.0
Total liabilities and stockholders’
equity
$1,125
$800
$325
40.6%
(b)
Year 2
Year 1
Assets
Amount
Percent
Amount
Percent
Current assets
$ 445
39.6%
$280
35.0%
Plant assets
680
60.4
520
65.0
Total assets
$1,125
100.0%
$800
100.0%
Liabilities and Stockholders’ Equity
Current liabilities
$ 285
25.3%
$120
15.0%
Long-term debt
255
22.7
160
20.0
Common stock
325
28.9
320
40.0
Retained earnings
260
23.1
200
25.0
Total liabilities and stockholders’ equity
$1,125
100.0%
$800
100.0%
POINTS:
1
DIFFICULTY:
Bloom’s: Remembering
Easy
QUESTION TYPE:
Subjective Short Answer
HAS VARIABLES:
False
LEARNING OBJECTIVES:
FNMN.WAJO.19.14–02 – LO: 14–02
ACCREDITING STANDARDS:
ACCT.ACBSP.APC.23 – Financial Statement Analysis
ACCT.AICPA.FN.03 – Measurement
BUSPROG: Analytic
DATE CREATED:
7/22/2017 6:35 PM
DATE MODIFIED:
10/16/2017 6:46 PM
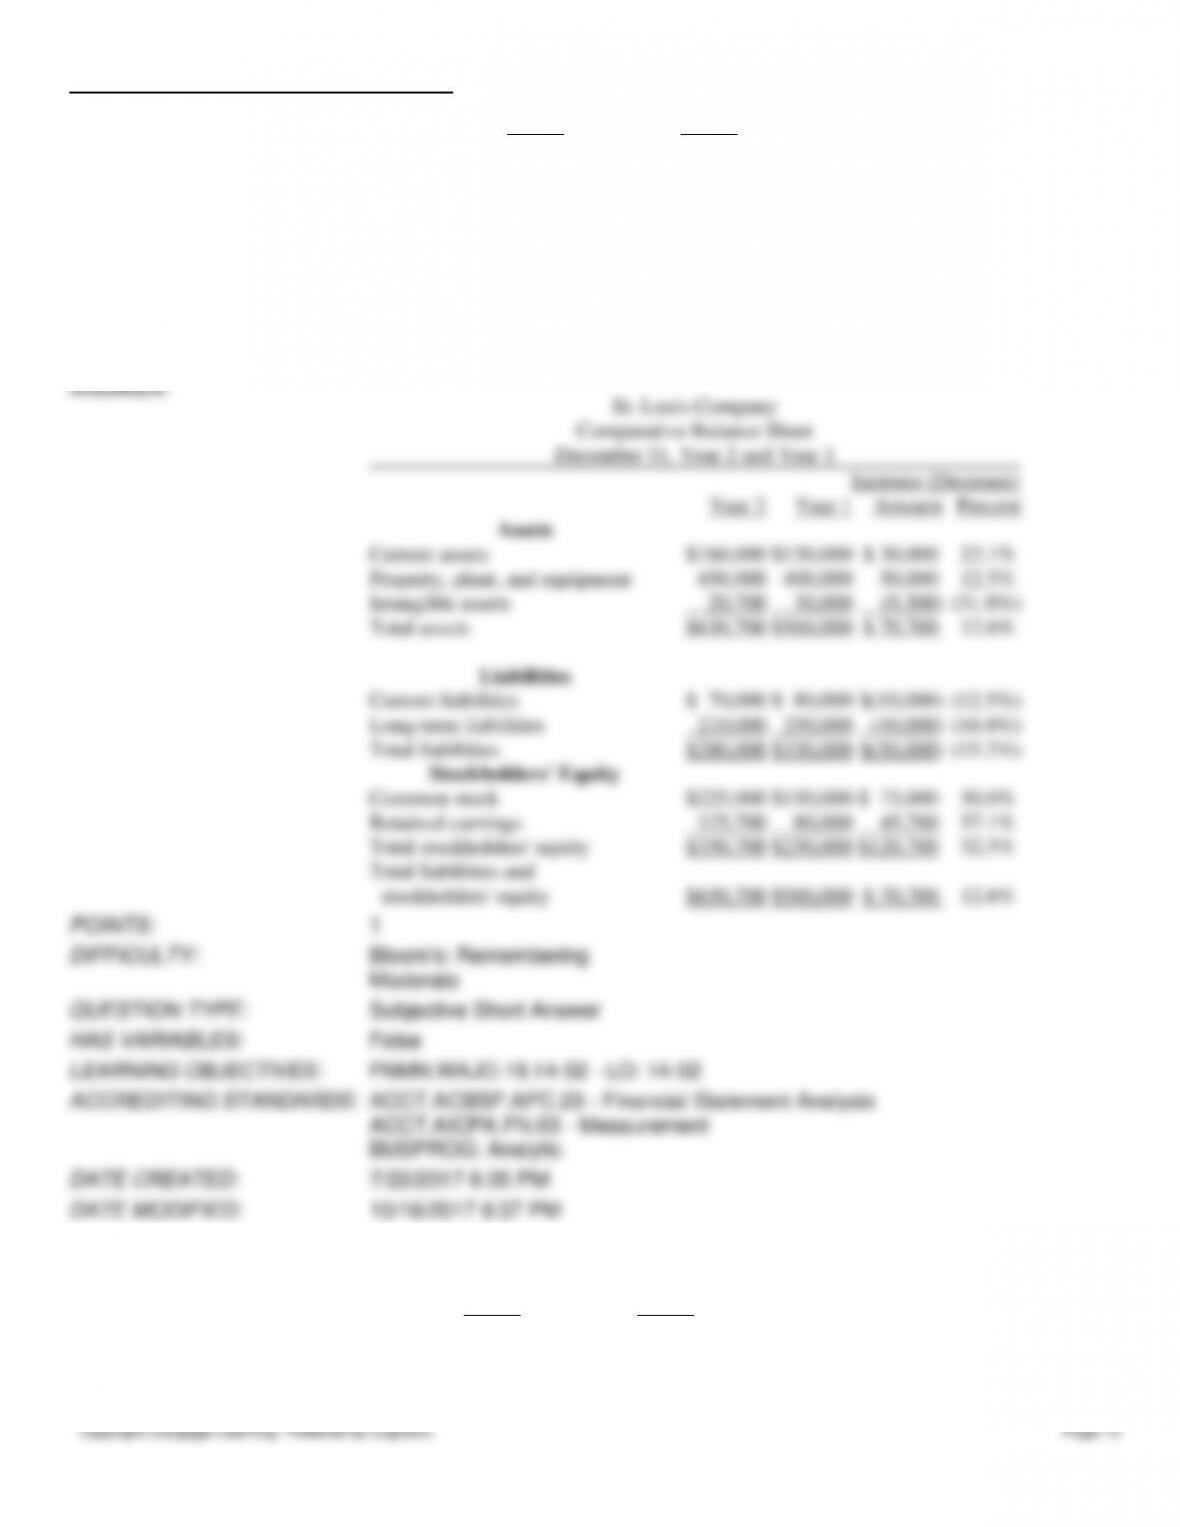
168. Condensed data taken from the ledger of St. Louis Company at December 31, for the current and preceding years, are
as follows:
Chapter 14 – Financial Statement Analysis
Copyright Cengage Learning. Powered by Cognero.
Page 72
Year 2
Year 1
Current assets
$160,000
$130,000
Property, plant, and equipment
450,000
400,000
Intangible assets
20,700
30,000
Current liabilities
70,000
80,000
Long-term liabilities
210,000
250,000
Common stock
225,000
150,000
Retained earnings
125,700
80,000
Prepare a comparative balance sheet, with horizontal analysis, for December 31, Year 2 and Year 1. (Round percents to
one decimal point.)
ANSWER:
St. Louis Company
Comparative Balance Sheet
December 31, Year 2 and Year 1
Increase (Decrease)
Year 2
Year 1
Amount
Percent
Assets
Current assets
$160,000
$130,000
$ 30,000
23.1%
Property, plant, and equipment
450,000
400,000
50,000
12.5%
Intangible assets
20,700
30,000
(9,300)
(31.0%)
Total assets
$630,700
$560,000
$ 70,700
12.6%
Liabilities
Current liabilities
$ 70,000
$ 80,000
$(10,000)
(12.5%)
Long-term liabilities
210,000
250,000
(40,000)
(16.0%)
Total liabilities
$280,000
$330,000
$(50,000)
(15.2%)
Stockholders’ Equity
Common stock
$225,000
$150,000
$ 75,000
50.0%
Retained earnings
125,700
80,000
45,700
57.1%
Total stockholders’ equity
$350,700
$230,000
$120,700
52.5%
Total liabilities and
stockholders’ equity
$630,700
$560,000
$ 70,700
12.6%
POINTS:
1
DIFFICULTY:
Bloom’s: Remembering
Moderate
QUESTION TYPE:
Subjective Short Answer
HAS VARIABLES:
False
LEARNING OBJECTIVES:
FNMN.WAJO.19.14–02 – LO: 14–02
ACCREDITING STANDARDS:
ACCT.ACBSP.APC.23 – Financial Statement Analysis
ACCT.AICPA.FN.03 – Measurement
BUSPROG: Analytic
DATE CREATED:
7/22/2017 6:35 PM
DATE MODIFIED:
10/16/2017 6:37 PM
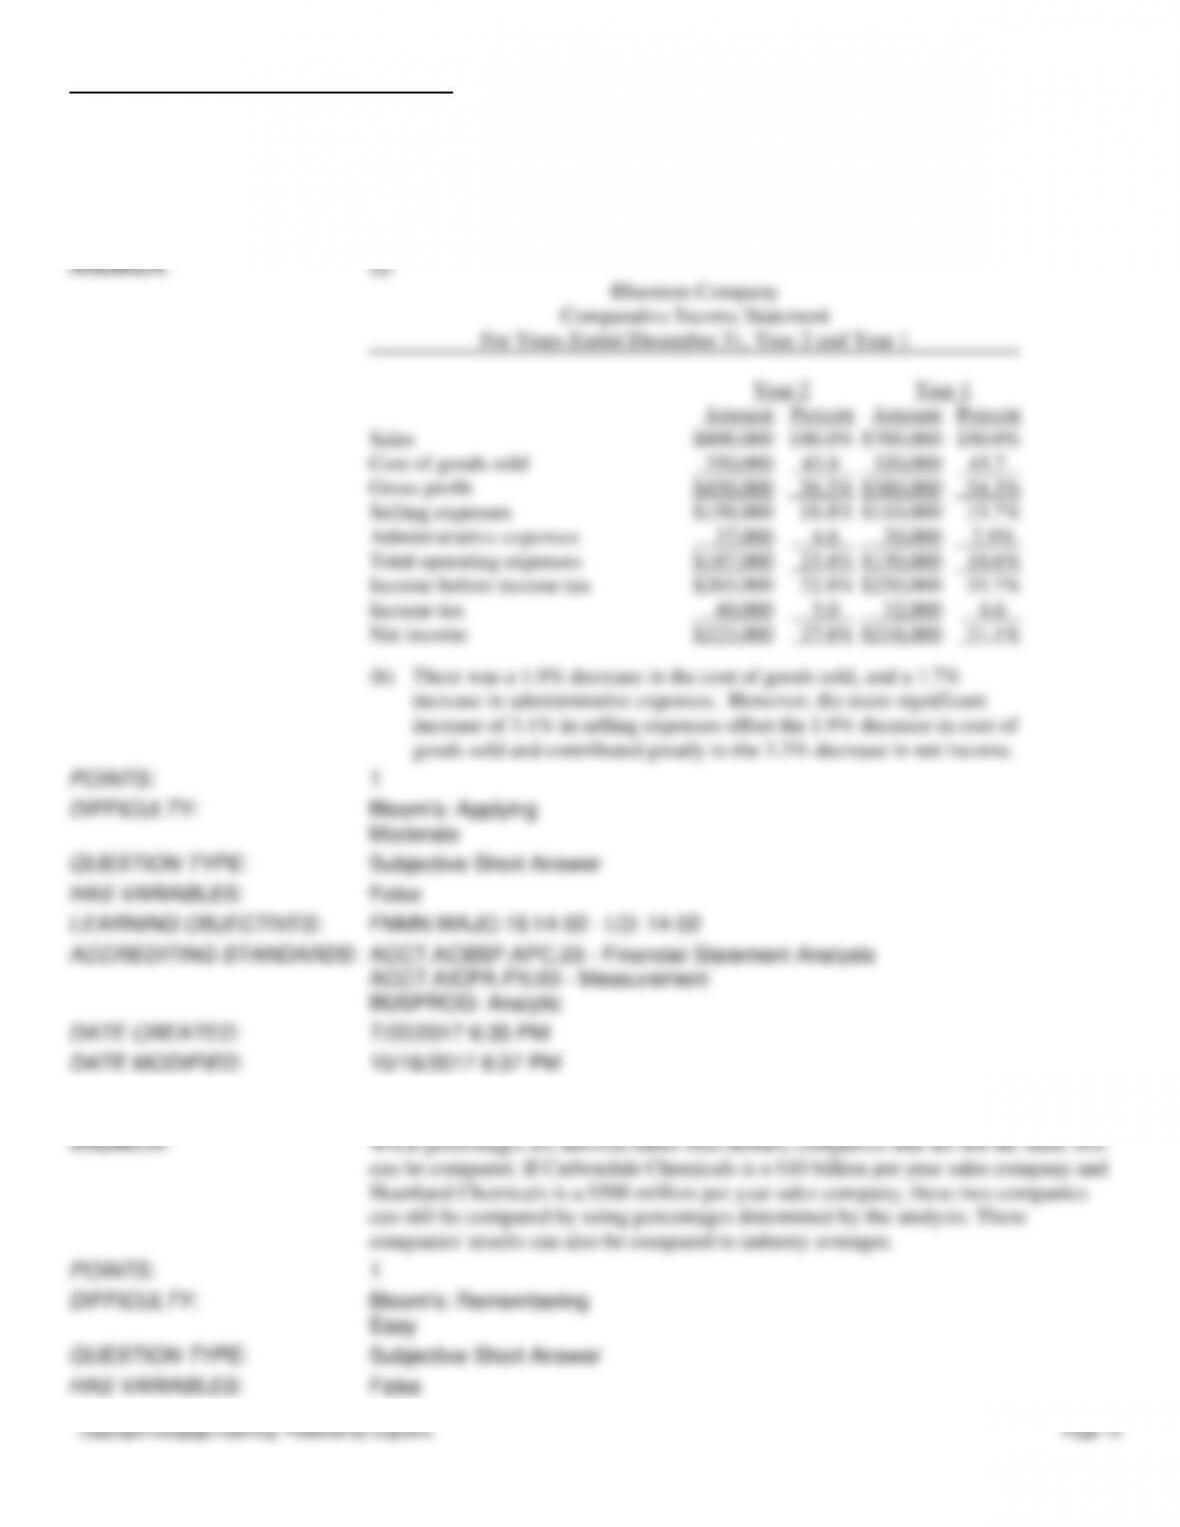
169. Revenue and expense data for Bluestem Company are as follows:
Year 2
Year 1
Administrative expenses
$ 37,000
$ 20,000
Cost of goods sold
350,000
320,000
Income tax expense
40,000
32,000
Sales
800,000
700,000
Chapter 14 – Financial Statement Analysis
DATE CREATED:
7/22/2017 6:35 PM
DATE MODIFIED:
10/16/2017 6:37 PM
POINTS:
1
QUESTION TYPE:
Subjective Short Answer
HAS VARIABLES:
False
Selling expenses
150,000
110,000
(a)
Prepare a comparative income statement, with vertical analysis, stating each item for both
years as a percent of sales.
(b)
Comment upon significant changes disclosed by the comparative income statement.
Round percentages to one decimal place.
ANSWER:
(a)
Bluestem Company
Comparative Income Statement
For Years Ended December 31, Year 2 and Year 1
Year 2
Year 1
Amount
Percent
Amount
Percent
Sales
$800,000
100.0%
$700,000
100.0%
Cost of goods sold
350,000
43.8
320,000
45.7
Gross profit
$450,000
56.2%
$380,000
54.3%
Selling expenses
$150,000
18.8%
$110,000
15.7%
Administrative expenses
37,000
4.6
20,000
2.9%
Total operating expenses
$187,000
23.4%
$130,000
18.6%
Income before income tax
$263,000
32.8%
$250,000
35.7%
Income tax
40,000
5.0
32,000
4.6
Net income
$223,000
27.8%
$218,000
31.1%
(b)
There was a 1.9% decrease in the cost of goods sold, and a 1.7%
increase in administrative expenses. However, the more significant
increase of 3.1% in selling expenses offset the 1.9% decrease in cost of
goods sold and contributed greatly to the 3.3% decrease in net income.
POINTS:
1
DIFFICULTY:
Bloom’s: Applying
Moderate
QUESTION TYPE:
Subjective Short Answer
HAS VARIABLES:
False
LEARNING OBJECTIVES:
FNMN.WAJO.19.14–02 – LO: 14–02
ACCREDITING STANDARDS:
ACCT.ACBSP.APC.23 – Financial Statement Analysis
ACCT.AICPA.FN.03 – Measurement
BUSPROG: Analytic
Chapter 14 – Financial Statement Analysis
Copyright Cengage Learning. Powered by Cognero.
Page 76
Cash, marketable securities, and receivables
$ 80,000
$ 84,000
Inventories
120,000
66,000
Total current assets
$200,000
$150,000
Current liabilities
100,000
60,000
Working capital
$100,000
$ 90,000
Has the current position of Garrison Corporation improved? Explain.
ANSWER:
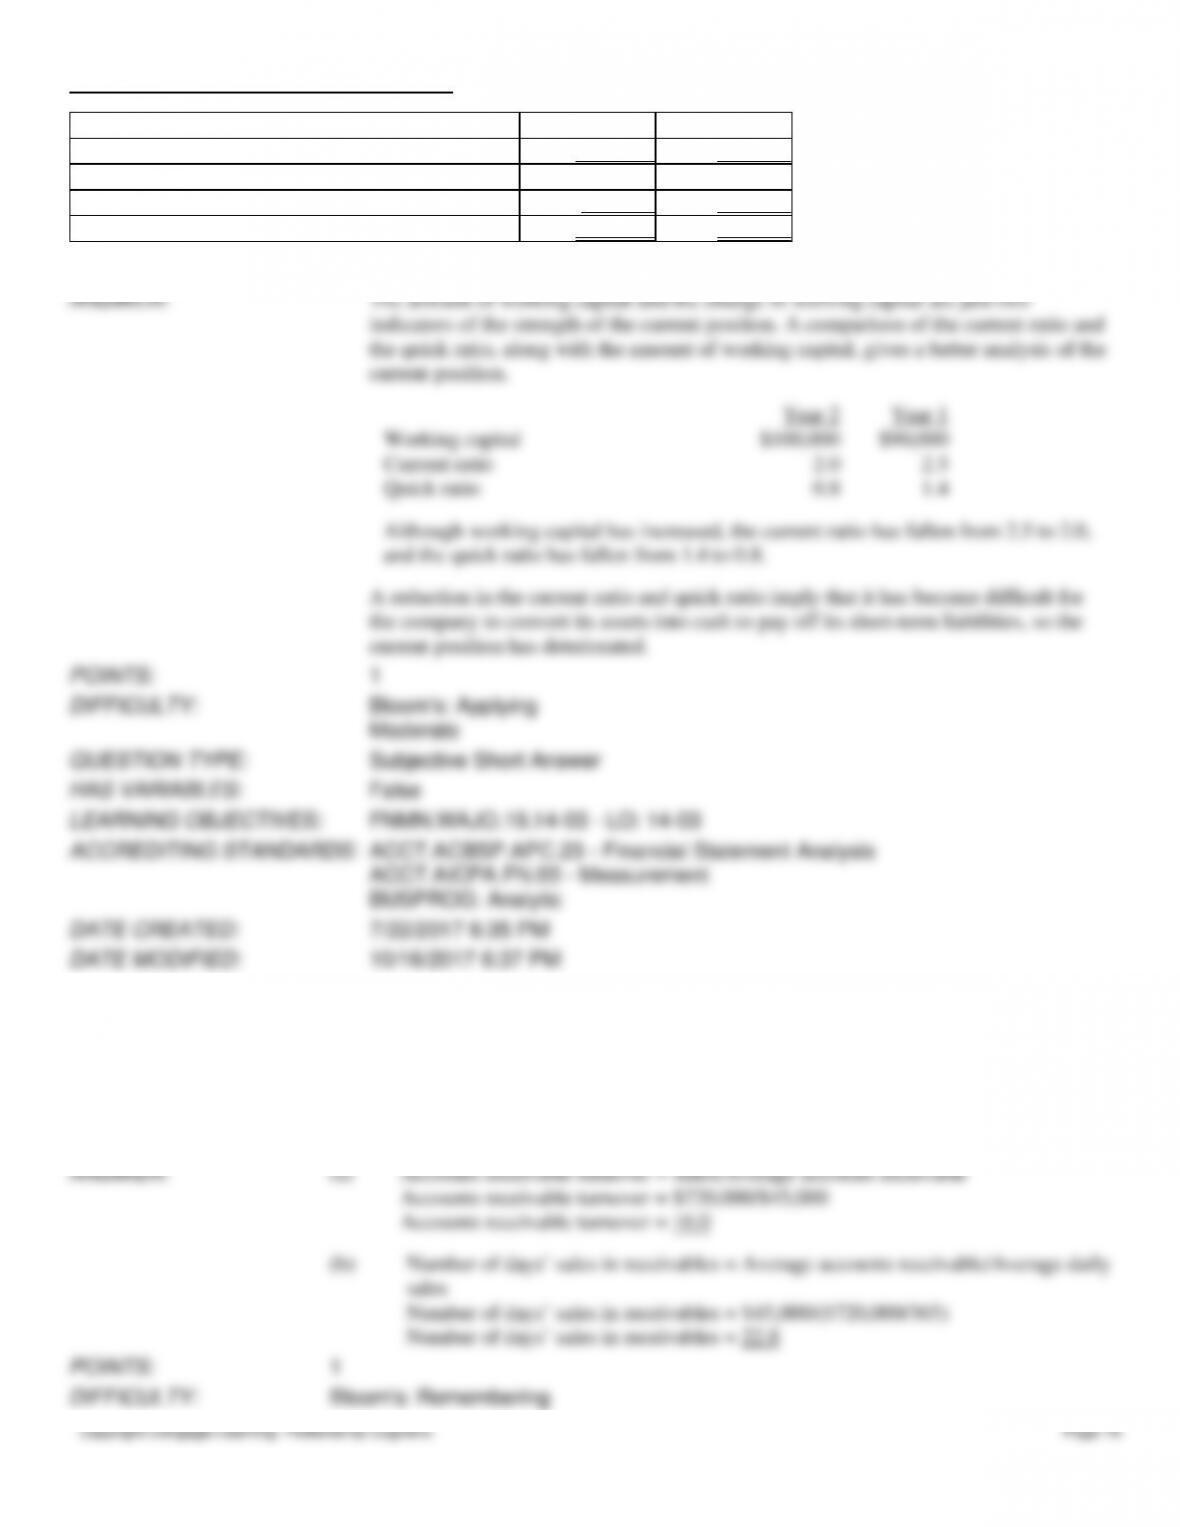
The amount of working capital and the change in working capital are just two
indicators of the strength of the current position. A comparison of the current ratio and
the quick ratio, along with the amount of working capital, gives a better analysis of the
current position.
Year 2
Year 1
Working capital
$100,000
$90,000
Current ratio
2.0
2.5
Quick ratio
0.8
1.4
Although working capital has increased, the current ratio has fallen from 2.5 to 2.0,
and the quick ratio has fallen from 1.4 to 0.8.
A reduction in the current ratio and quick ratio imply that it has become difficult for
the company to convert its assets into cash to pay off its short-term liabilities, so the
current position has deteriorated.
POINTS:
1
DIFFICULTY:
Bloom’s: Applying
Moderate
QUESTION TYPE:
Subjective Short Answer
HAS VARIABLES:
False
LEARNING OBJECTIVES:
FNMN.WAJO.19.14–03 – LO: 14–03
ACCREDITING STANDARDS:
ACCT.ACBSP.APC.23 – Financial Statement Analysis
ACCT.AICPA.FN.03 – Measurement
BUSPROG: Analytic
DATE CREATED:
7/22/2017 6:35 PM
DATE MODIFIED:
10/16/2017 6:37 PM
175. A company reports the following:
Sales
$720,000
Average accounts receivable (net)
45,000
Determine the (a) accounts receivable turnover, and (b) number of days’ sales in receivables. Round your answer to one
decimal place.
(a)
Accounts receivable turnover = Sales/Average accounts receivable
sales
Number of days’ sales in receivables = $45,000/($720,000/365)
Number of days’ sales in receivables = 22.8
POINTS:
1
DIFFICULTY:
Bloom’s: Remembering
Chapter 14 – Financial Statement Analysis
Copyright Cengage Learning. Powered by Cognero.
Page 79
Ending inventory
72,000
80,000
(1)
Determine for each year:
(a)
The inventory turnover
(b)
The number of days’ sales in inventory (Round intermediate calculation to the nearest
whole number and your final answer to one decimal place).
(2)
What conclusions can be drawn from these data concerning the inventories?
ANSWER:
(1)
(a)
Inventory turnover = Cost of goods sold/Average inventory
Year 2
$500,800
= 6.6
($72,000 + $80,000)/2
Year 1
$606,000
= 8.4
($80,000 + $64,000)/2
(b)
Number of days’ sales in inventory = Average inventory/
Average daily cost of goods sold
Year 2
($72,000 + $80,000)/2
= 55.4
$1,372*
Year 1
($80,000 + $64,000)/2
= 43.4
$1,660**
*$1,372 = $500,800 ÷ 365 days
**$1,660 = $606,000 ÷ 365 days
(2)
The inventory position of the business has deteriorated. The inventory turnover has
decreased, while the number of days’ sales in inventory has increased. The sales vol
has declined faster than the inventory has declined, thus resulting in the deteriorating
inventory position.
POINTS:
1
DIFFICULTY:
Bloom’s: Remembering
Moderate
QUESTION TYPE:
Subjective Short Answer
HAS VARIABLES:
False
LEARNING OBJECTIVES:
FNMN.WAJO.19.14–03 – LO: 14–03
ACCREDITING STANDARD
S:
ACCT.ACBSP.APC.23 – Financial Statement Analysis
ACCT.AICPA.FN.03 – Measurement
BUSPROG: Analytic
DATE CREATED:
7/22/2017 6:35 PM
DATE MODIFIED:
10/16/2017 6:37 PM
180. A company reports the following:
Income before income tax
$600,000
Interest expense
150,000
Determine the times interest earned. Round your answer to one decimal place.
ANSWER:
Times interest earned = (Income before income tax + Interest expense)/Interest
expense
Times interest earned = ($600,000 + $150,000)/$150,000