Chapter 13
© 2018 Cengage. All Rights Reserved. May not be scanned, copied or duplicated, or posted to a publicly accessible website, in whole or in part.
Page 61
140. Because of its relationship to dividends and market price, which ratio is important to investors?
a. Current ratio
b. Debt-to-equity ratio
c. Price/earnings ratio
d. Asset turnover ratio
141. The concept of leverage is that
a. it is appropriate to borrow if the return on the assets is greater than the cost of the financing.
b. it is appropriate to borrow as long as the lender approves the loan.
c. it is unfavorable to borrow funds rather than raise the capital from stockholders.
d. a high debt-to-equity ratio is favorable.
© 2018 Cengage. All Rights Reserved. May not be scanned, copied or duplicated, or posted to a publicly accessible website, in whole or in part.
Page 63
144. Debt-to-equity ratio
a. Total liabilities
b. Total stockholders’ equity
c. Net income
d. Interest expense
e. Cash flow from operations before interest and tax payments
f. Cash paid for acquisitions
g. Cash flow from operations
h. Total dividends paid
145. Debt service coverage ratio
a. Interest expense
b. Income tax expense
c. Cash flow from operations before interest and tax payments
d. Cash paid for acquisitions
e. Cash flow from operations
f. Total dividends paid
g. Interest payments
h. Principal payments on debt
© 2018 Cengage. All Rights Reserved. May not be scanned, copied or duplicated, or posted to a publicly accessible website, in whole or in part.
Page 65
148. Asset turnover ratio
a. Market price per share
b. Net sales
c. Gross profit
d. Average total assets
e. Interest expense, net of tax
f. Net income
g. Total liabilities
h. Total assets
149. Return on sales ratio
a. Market price per share
b. Net sales
c. Gross profit
d. Average total assets
e. Interest expense, net of tax
f. Net income
g. Total liabilities
h. Total assets
© 2018 Cengage. All Rights Reserved. May not be scanned, copied or duplicated, or posted to a publicly accessible website, in whole or in part.
Page 66
150. Dividend yield ratio
a. Market price per share
b. Net sales
c. Average inventory outstanding
d. Interest expense, net of tax
e. Common dividends per share
f. Preferred dividends per share
g. Weighted average number of common shares outstanding
h. Total stockholders’ equity
151. __________, or an increase in the level of prices, is another important consideration in analyzing financial
statements.
152. __________ ratio is capable of telling the user everything there is to know about a particular company.
© 2018 Cengage. All Rights Reserved. May not be scanned, copied or duplicated, or posted to a publicly accessible website, in whole or in part.
Page 67
153. Trend analysis is another name for __________ analysis.
154. The ratio of net income to net sales is the relationship presented by the __________ ratio.
155. In a vertical analysis, the base, or benchmark, on which all other items in the income statement are compared is
__________.
156. __________ statements recast all items on the statement as a percentage of a selected item on the statement.
© 2018 Cengage. All Rights Reserved. May not be scanned, copied or duplicated, or posted to a publicly accessible website, in whole or in part.
Page 68
157. The three types of analysis that involve ratios are __________, __________, and __________.
158. The __________ ratio indicates the company’s ability to meet the current year’s interest payments out of the current
year’s earnings.
159. In the numerator of the debt service coverage ratio, __________ is a good substitute for cash flow from operations
before interest and tax payments, especially where changes in these accounts are insignificant.
© 2018 Cengage. All Rights Reserved. May not be scanned, copied or duplicated, or posted to a publicly accessible website, in whole or in part.
Page 69
160. The two groups of users that are especially interested in profitability are __________ and __________.
161. A comparison of financial statement items within a single period.
162. A comparison of financial statement items over a period of time.
163. When using vertical analysis, accounts on the balance sheet should be stated as a percentage of this amount.
164. When using vertical analysis, accounts on the income statement should be stated as a percentage of this amount.
Chapter 13
© 2018 Cengage. All Rights Reserved. May not be scanned, copied or duplicated, or posted to a publicly accessible website, in whole or in part.
Page 73
186. The relationship between net sales and total assets
187. The relationship between dividends and the market price of a company’s stock
188. An income statement measure of the ability of a company to make its interest payments
189. A measure of the ability of a company to finance long-term asset acquisitions from cash from operations
190. What two difficulties may be that are encountered when two companies are compared?
191. What are two reasons why a company’s accounts receivable turnover may decrease?
2. Credit sales could decline because of economic conditions.
© 2018 Cengage. All Rights Reserved. May not be scanned, copied or duplicated, or posted to a publicly accessible website, in whole or in part.
Page 74
192. What three specific ratios are especially useful for creditors and lenders?
193. Dormont, Inc., a supplier, is thinking of extending credit to Fab Company but decides not to because Fab’s current
ratio is only 0.60. Do you agree with the supplier’s decision? What other factors need to be considered in drawing any
conclusions about a company’s liquidity?
© 2018 Cengage. All Rights Reserved. May not be scanned, copied or duplicated, or posted to a publicly accessible website, in whole or in part.
Page 75
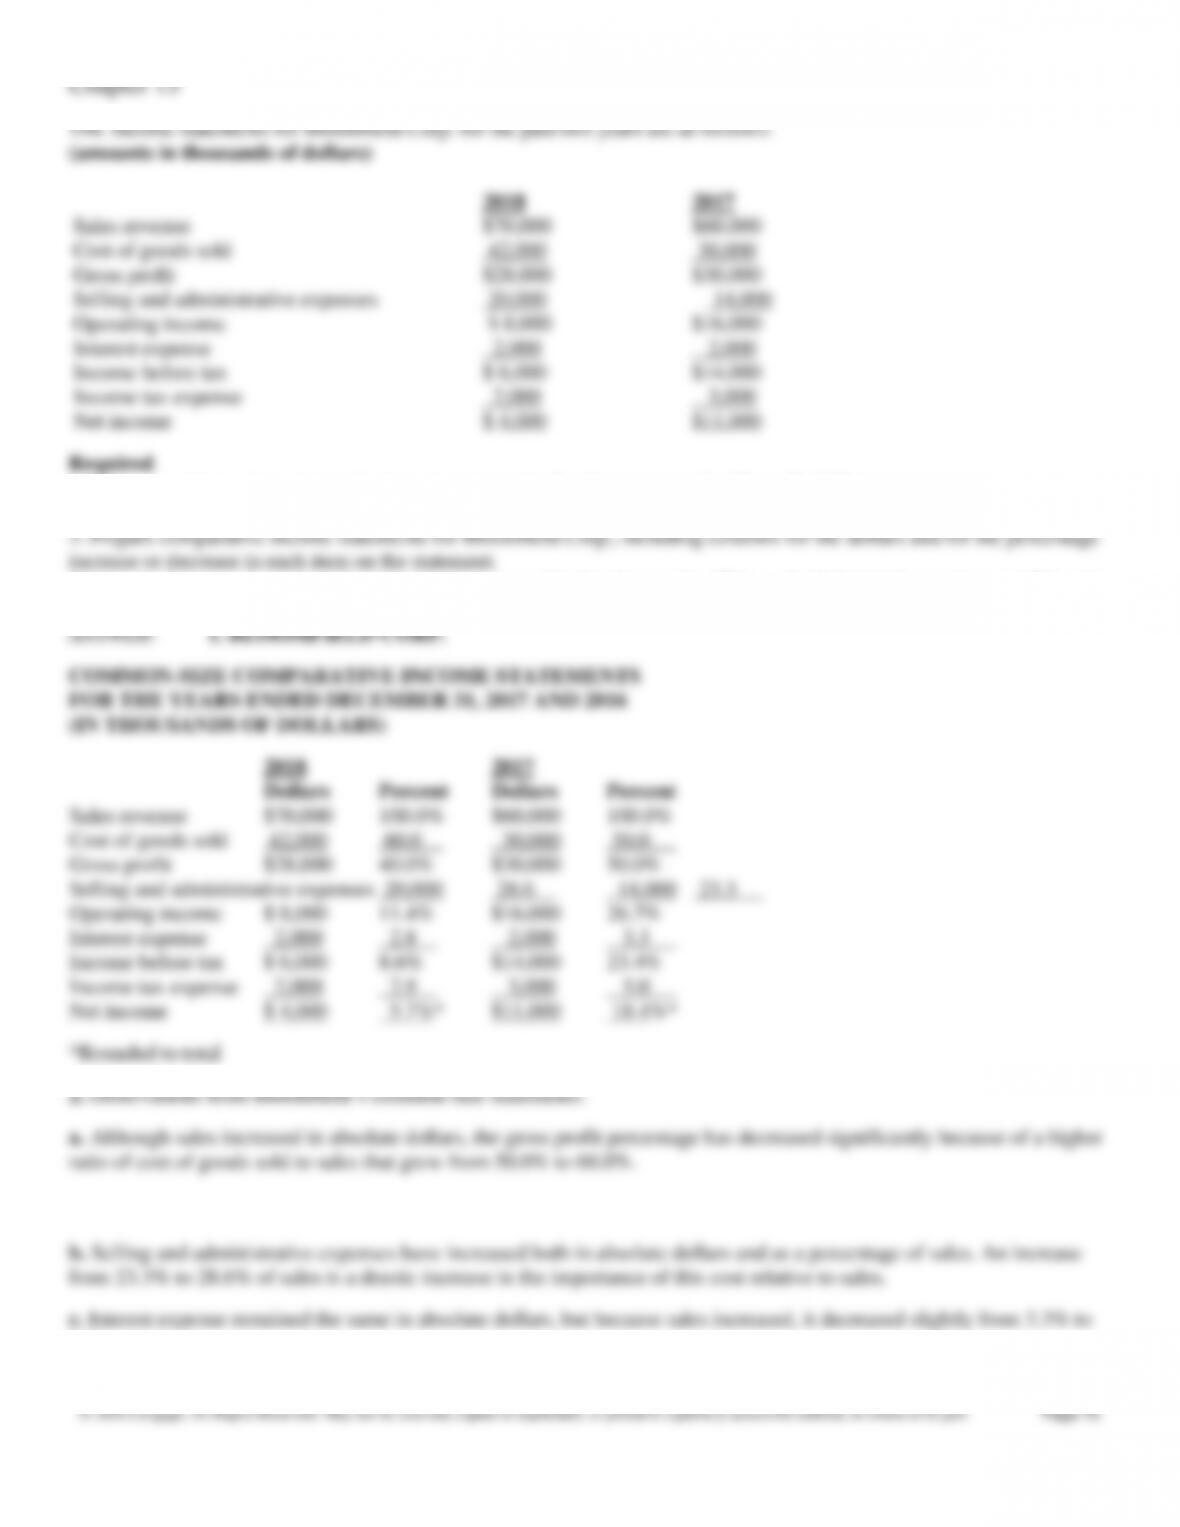
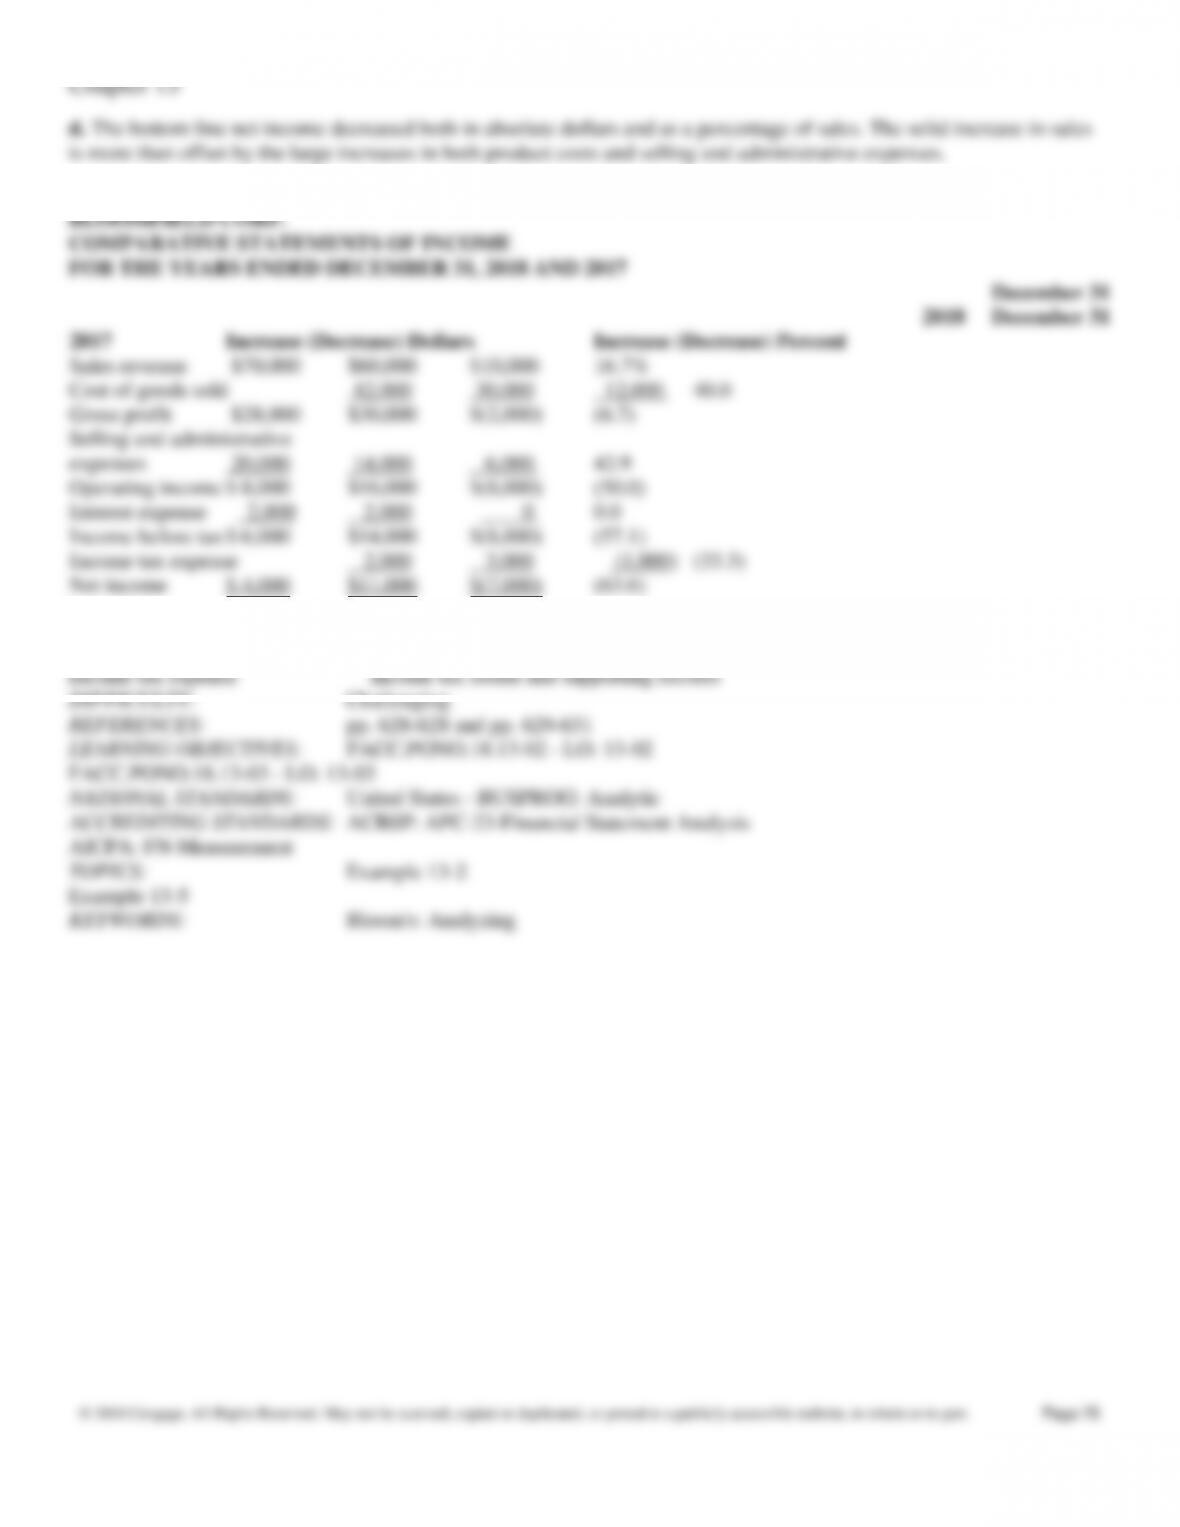
1. Prepare common-size comparative income statements for the two years for Bloomfield Corp.
2. What observations can you make about the common-size statements? List at least four observations.
4. Assume that you are interested in identifying reasons for the changes in selling and administrative expenses and income
tax expense. Explain where you would look to find additional information about the change.
2.8% of sales.
© 2018 Cengage. All Rights Reserved. May not be scanned, copied or duplicated, or posted to a publicly accessible website, in whole or in part.
Page 77
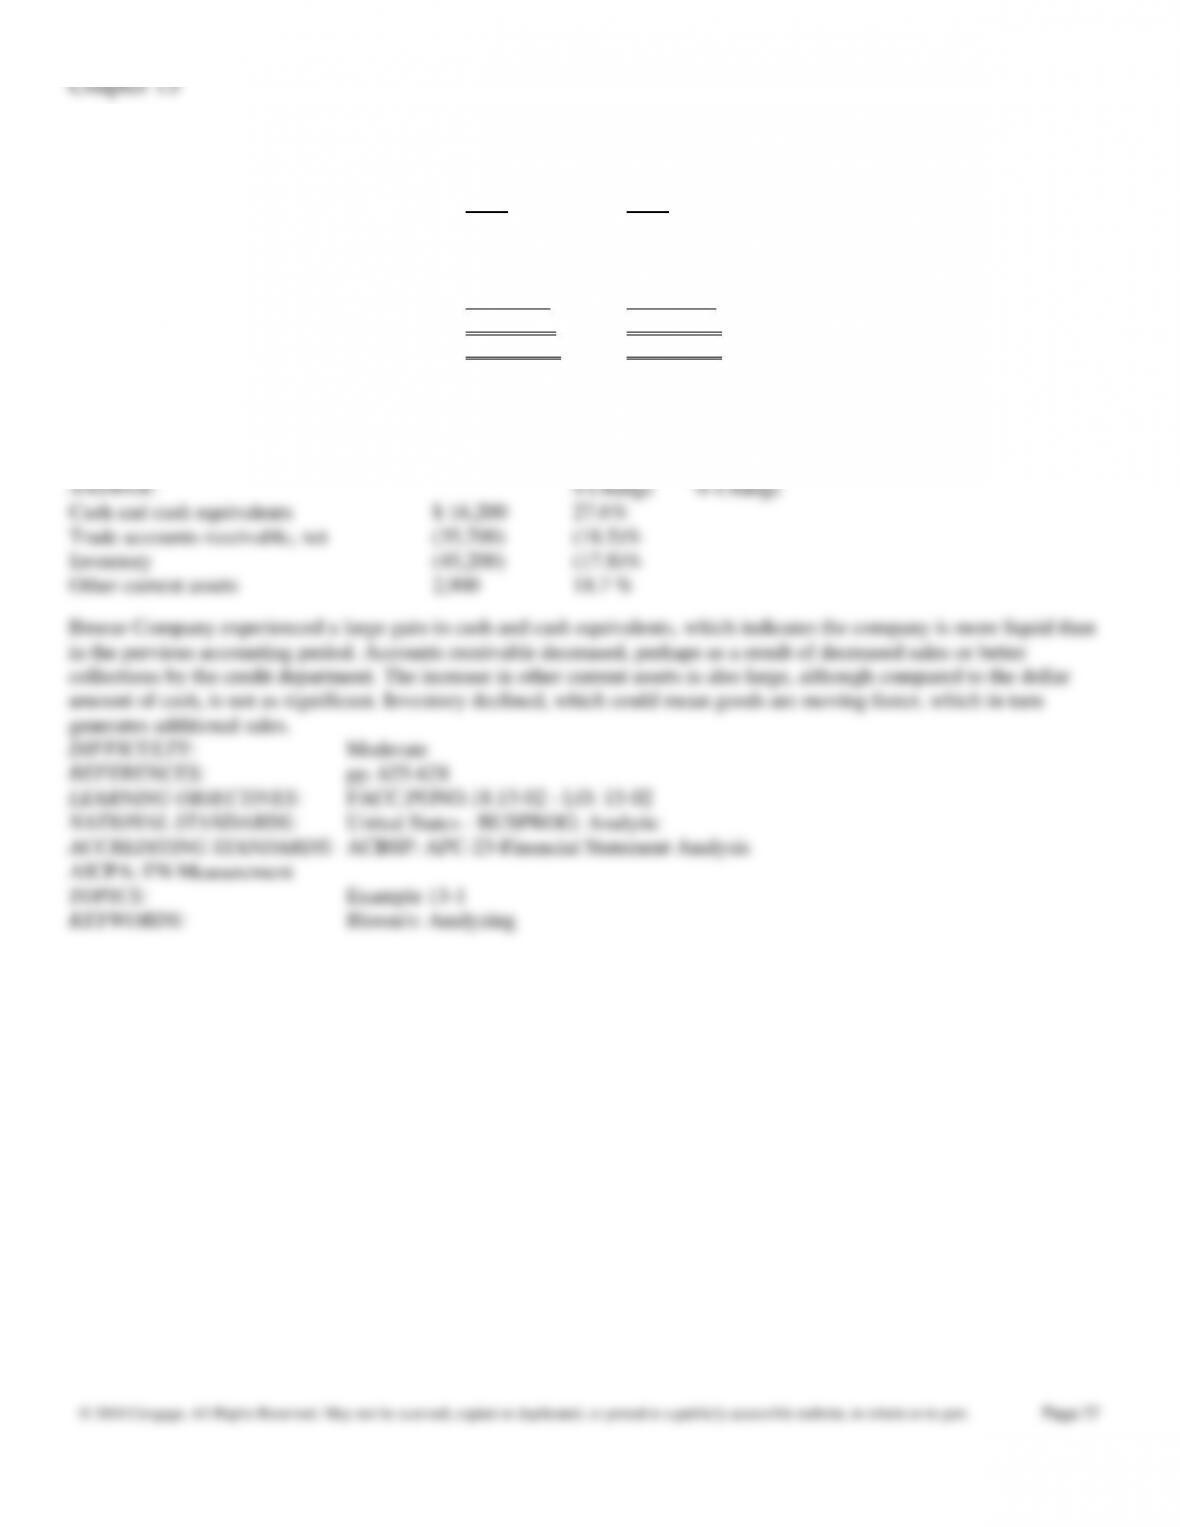
195. Use the Current Assets section of the balance sheets of the Breeze Company as of June 30, 2018 and 2017 presented
below to answer the questions that follow.
2018 2017
Cash and cash equivalents $ 75,000 $ 58,800
Trade accounts receivable, net 157,500 193,200
Inventory 208,200 253,400
Other current assets 18,400 15,500
Total current assets $ 459,100 $ 520,900
Total assets $2,650,000 $3,430,000
Required
Complete a horizontal analysis of the Current Assets section of Breeze Company’s balance sheet for 2018. Your answers
for “% Change” should be rounded to one decimal place, e.g., 10.3%. Provide a short evaluation of this analysis.
© 2018 Cengage. All Rights Reserved. May not be scanned, copied or duplicated, or posted to a publicly accessible website, in whole or in part.
Page 78
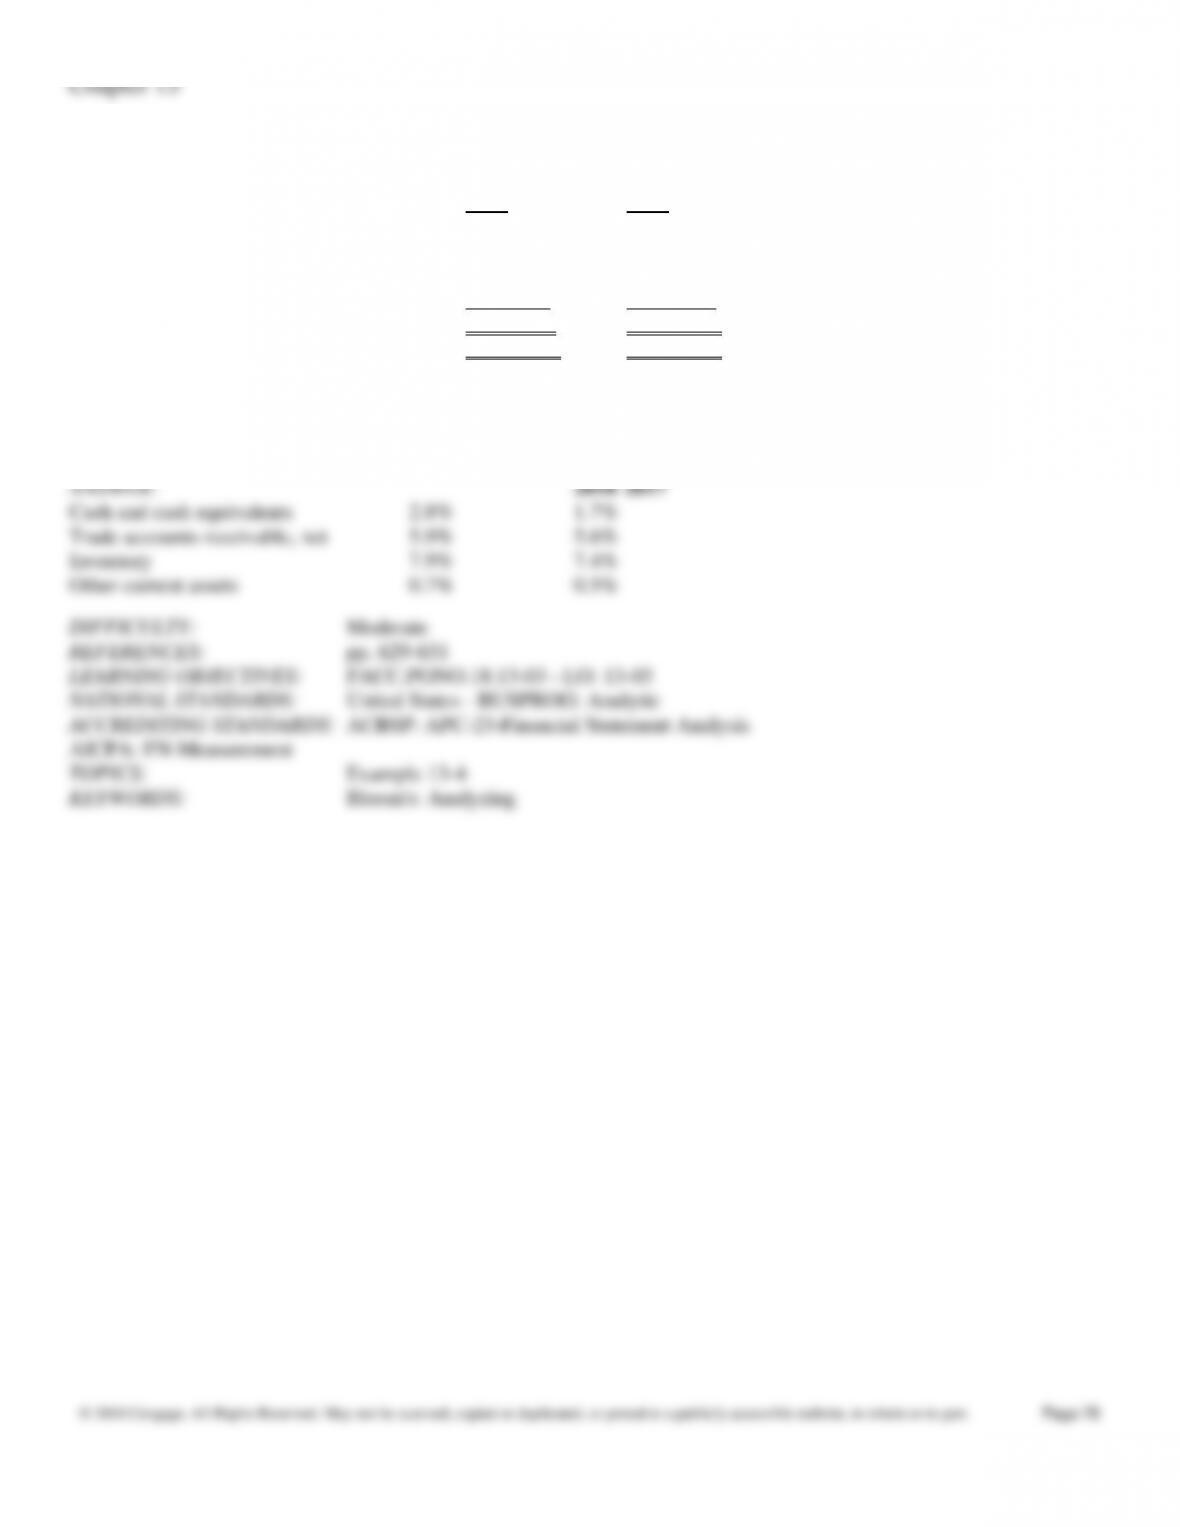
196. Use the Current Assets section of the balance sheets of Breeze Company as of June 30, 2018 and 2017 presented
below to answer the questions that follow.
2018 2017
Cash and cash equivalents $ 75,000 $ 58,800
Trade accounts receivable, net 157,500 193,200
Inventory 208,200 253,400
Other current assets 18,400 15,500
Total current assets $ 459,100 $ 520,900
Total assets $2,650,000 $3,430,000
Required
Complete a vertical analysis of the Current Assets section of Breeze Company’s balance sheets for 2018 and 2017. Your
answers should be rounded to one decimal place, e.g., 10.3%.
© 2018 Cengage. All Rights Reserved. May not be scanned, copied or duplicated, or posted to a publicly accessible website, in whole or in part.
Page 79
197. Presented below are selected data from the financial statements of Wave Company for 2019, 2018, and 2017.
2019 2018 2017
Total assets $1,205,000 $952,000 $945,000
Cost of goods sold 360,000 420,000 440,000
Inventory 56,000 64,000 53,000
Net income 65,000 25,000 16,000
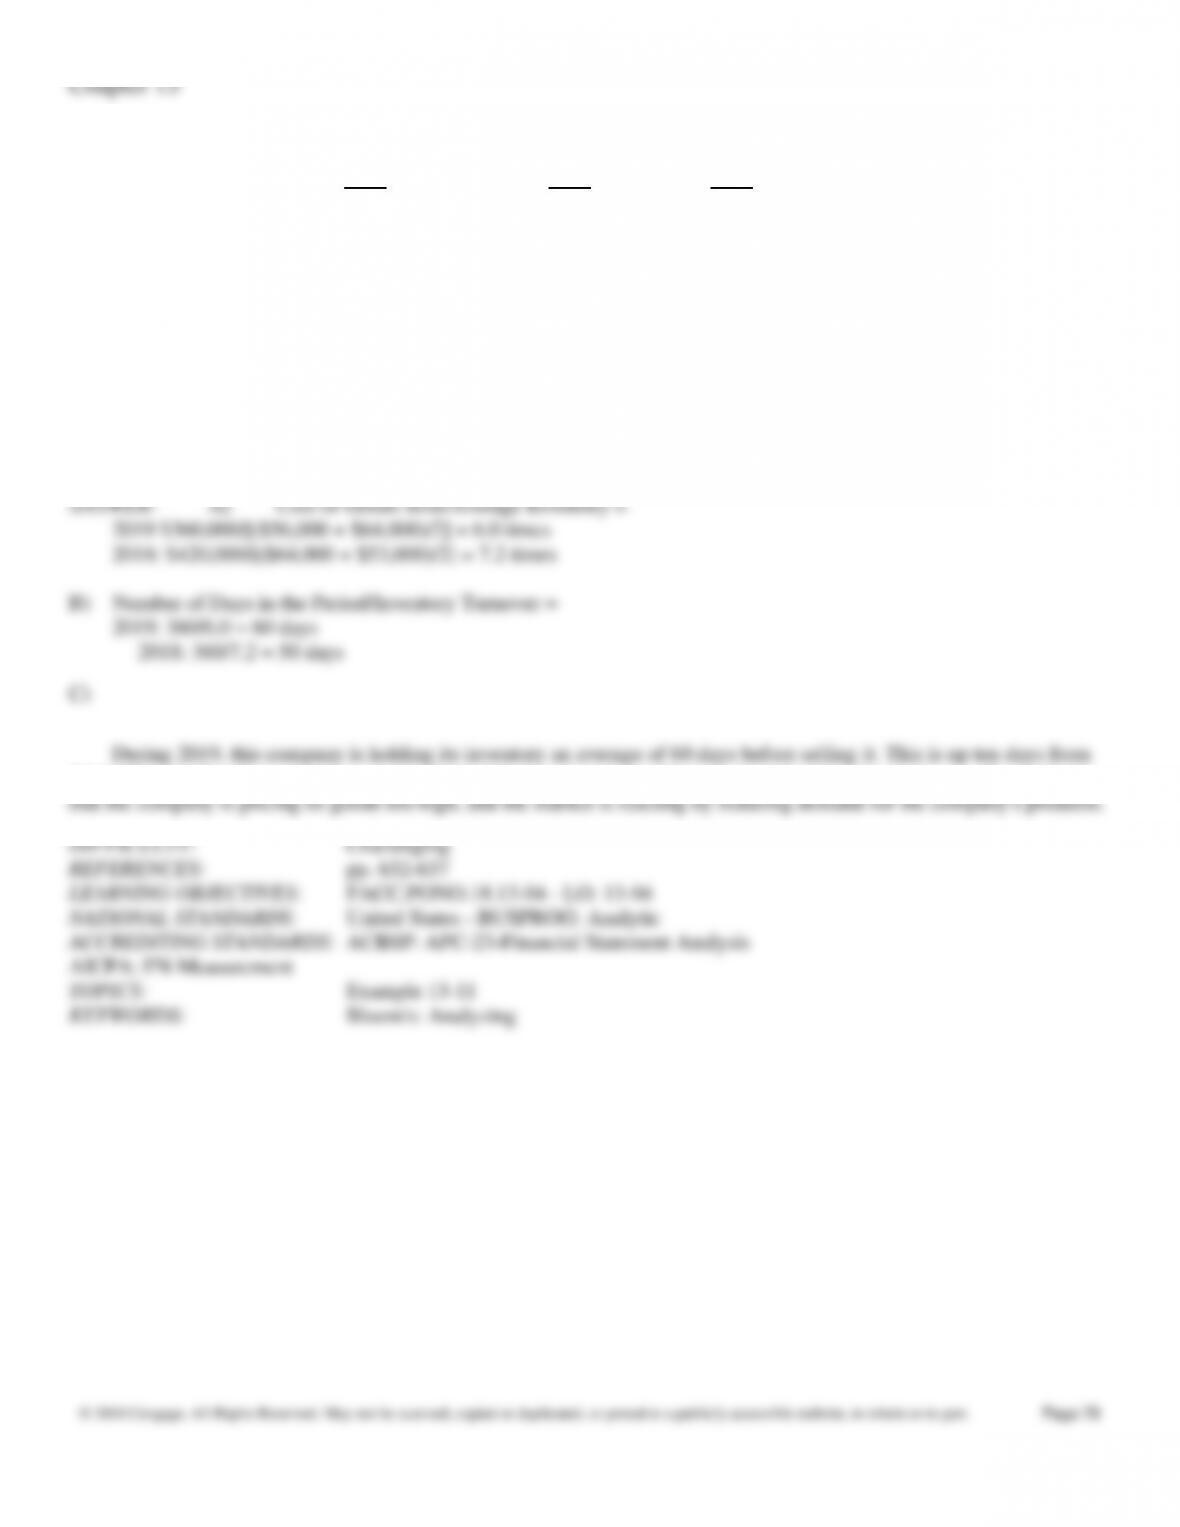
A) Calculate Wave’s inventory turnover ratio for 2019 and 2018.
B)
How many days would it take to sell the entire inventory at December 31, 2019? At December 31, 2018? Assume
360 days in a year.
C) What problems do you see in the company’s inventory management?
2018. This could indicate a large amount of obsolete inventory or problems in the sales department. It may also indicate
© 2018 Cengage. All Rights Reserved. May not be scanned, copied or duplicated, or posted to a publicly accessible website, in whole or in part.
Page 80
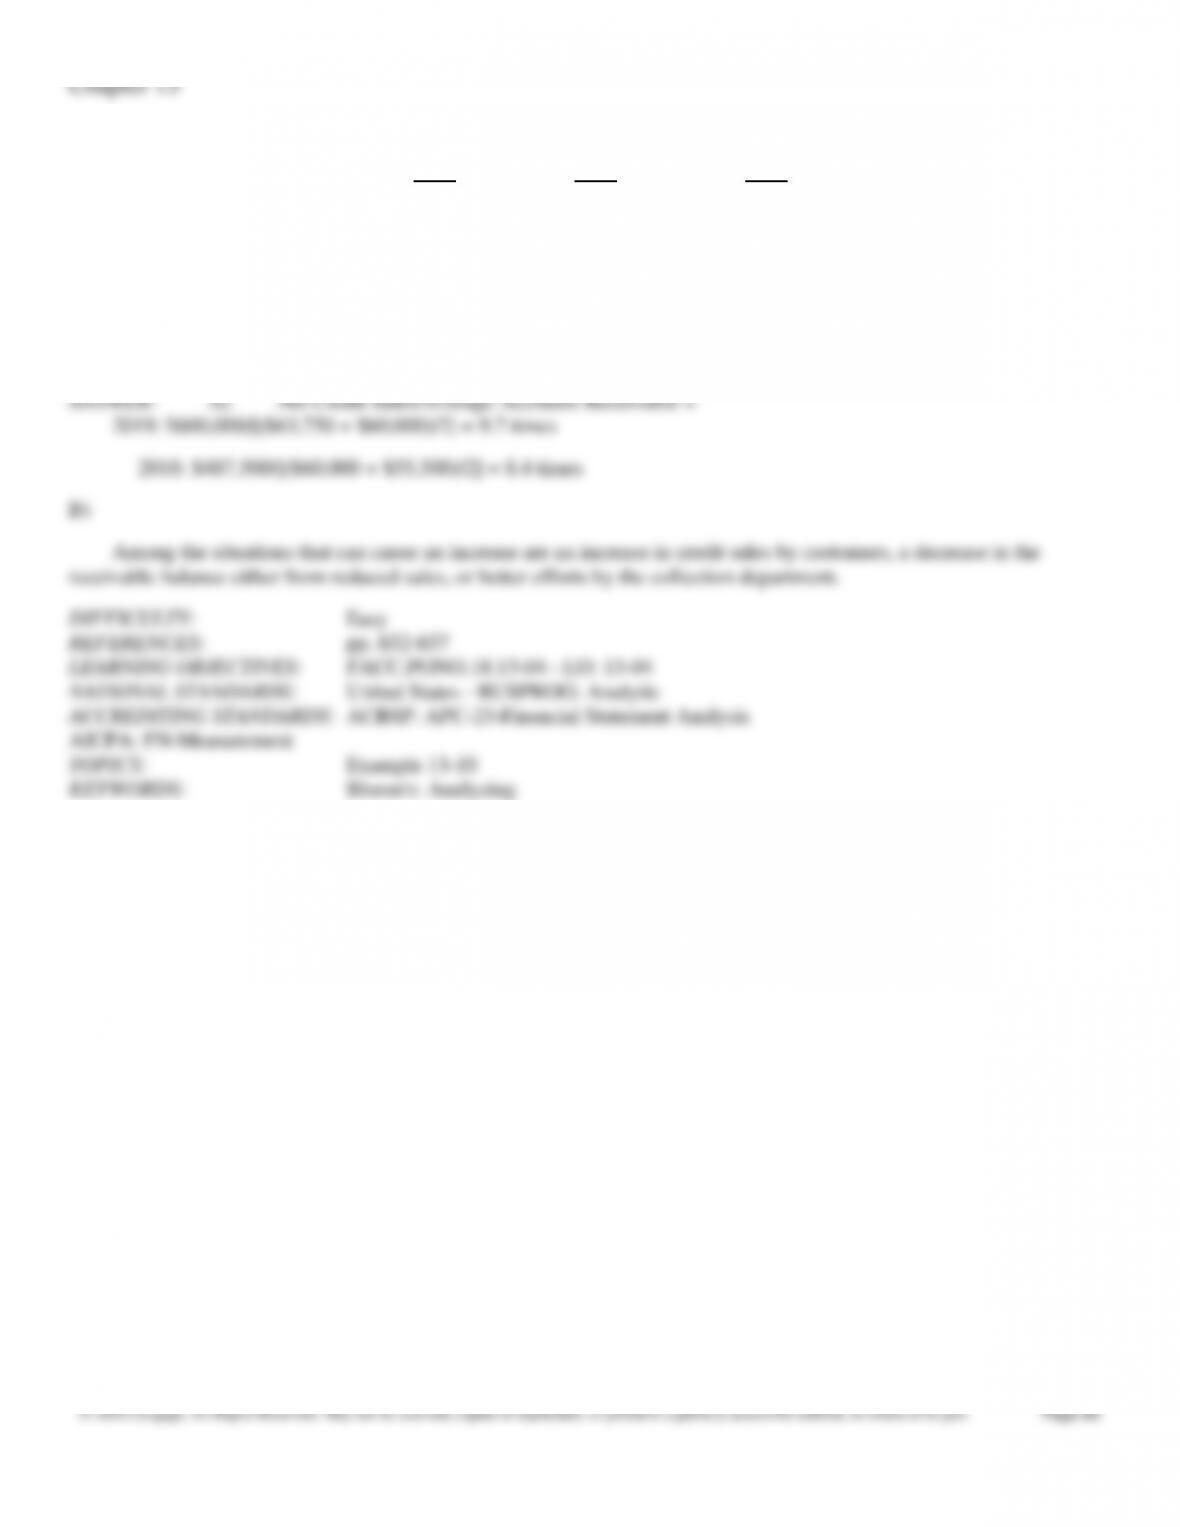
198. Presented below are selected data from the financial statements of Medtech Company for several years.
2019 2018 2017
Total assets $487,500 $615,750 $600,000
Net credit sales 600,000 487,500 540,000
Accounts receivable 63,750 60,000 55,500
Net income 11,250 65,000 9,000
A) Calculate Medtech’s accounts receivable turnover ratio for 2019 and 2018.
B) What could have caused the change? Explain.