Page 41
203.
(Table: Johnson’s Income and Expenditures) Use Table: Johnson’s Income and
Expenditures. For Johnson, pizzas are a(n) _____ good.
A)
inferior
B)
positive
C)
neutral
D)
normal
204.
Suppose the income of canned pinto bean consumers rises. All else equal, we can
conclude that the:
A)
income elasticity of demand is positive if beans are a normal good.
B)
income elasticity of demand is positive if beans are an inferior good.
C)
cross-price elasticity between beans and other goods is positive.
D)
cross-price elasticity between beans and other goods is negative.
205.
Which good(s) is/are MOST likely to have a vertical supply curve?
A)
salt
B)
oil
C)
insulin
D)
paintings by Van Gogh
206.
Suppose the price of university sweatshirts increases from $10 to $20 and the quantity
supplied increases from 20 to 30. The price elasticity of supply, using the midpoint
formula, is:
A)
0.66.
B)
1.50.
C)
0.60.
D)
1.66.
207.
A perfectly elastic supply curve is:
A)
horizontal.
B)
downward sloping.
C)
upward sloping.
D)
vertical.
Page 42
208.
Suppose the price of real estate increases by 37.11% in Oakland next year. If the
quantity of new homes supplied does not change, this means that the price elasticity of
_____ will be perfectly _____ in Oakland next year.
A)
demand; elastic
B)
supply; inelastic
C)
demand; inelastic
D)
supply; elastic
209.
If quantity supplied responds substantially to a relatively small change in price, supply
is:
A)
price-elastic.
B)
price-inelastic.
C)
negatively sloped.
D)
insensitive to changes in price.
210.
If the price elasticity of supply is greater than 1:
A)
supply is price-elastic.
B)
supply is price-inelastic.
C)
supply is price unit-elastic.
D)
the quantity supplied is relatively unresponsive to price changes.
211.
If the price elasticity of supply is less than 1, then supply is:
A)
price-elastic.
B)
price-inelastic.
C)
price unit-elastic.
D)
very responsive to price changes.
212.
The price elasticity of supply is computed as the percentage change in _____ divided by
the percentage change in _____.
A)
quantity supplied; quantity demanded
B)
quantity supplied; price
C)
price; quantity supplied
D)
quantity supplied; consumer income
Page 43
213.
An attorney supplies 40 hours of work per week when her fee is $100 per hour but
supplies 60 hours of work per week when her fee rises to $120 per hour. Using the
midpoint formula, her elasticity of supply is equal to:
A)
1.
B)
0.8.
C)
2.2.
D)
0.45.
214.
A hotel has a fixed capacity of 100 rooms in the short run. Which statement BEST
describes the short-run elasticity of supply for rooms at this hotel?
A)
The supply is elastic at quantities above 100 rooms but inelastic at quantities below
100 rooms.
B)
The elasticity of supply is equal to 1 in the short run but infinitely elastic in the
long run.
C)
The elasticity of supply is zero in the short run because the short-run supply curve
is vertical.
D)
The supply is infinitely elastic in the short run but perfectly inelastic in the long
run.
215.
Paolo owns a pizza shop. The price of pizza recently increased from $3 to $5 a slice.
Paolo responded by increasing the quantity of slices he supplied from 100 to 150 slices
per day. By the midpoint method, Paolo’s price elasticity of supply is:
A)
1.25.
B)
0.8.
C)
0.75.
D)
2.5.
Use the following to answer questions 216-217:

Page 44
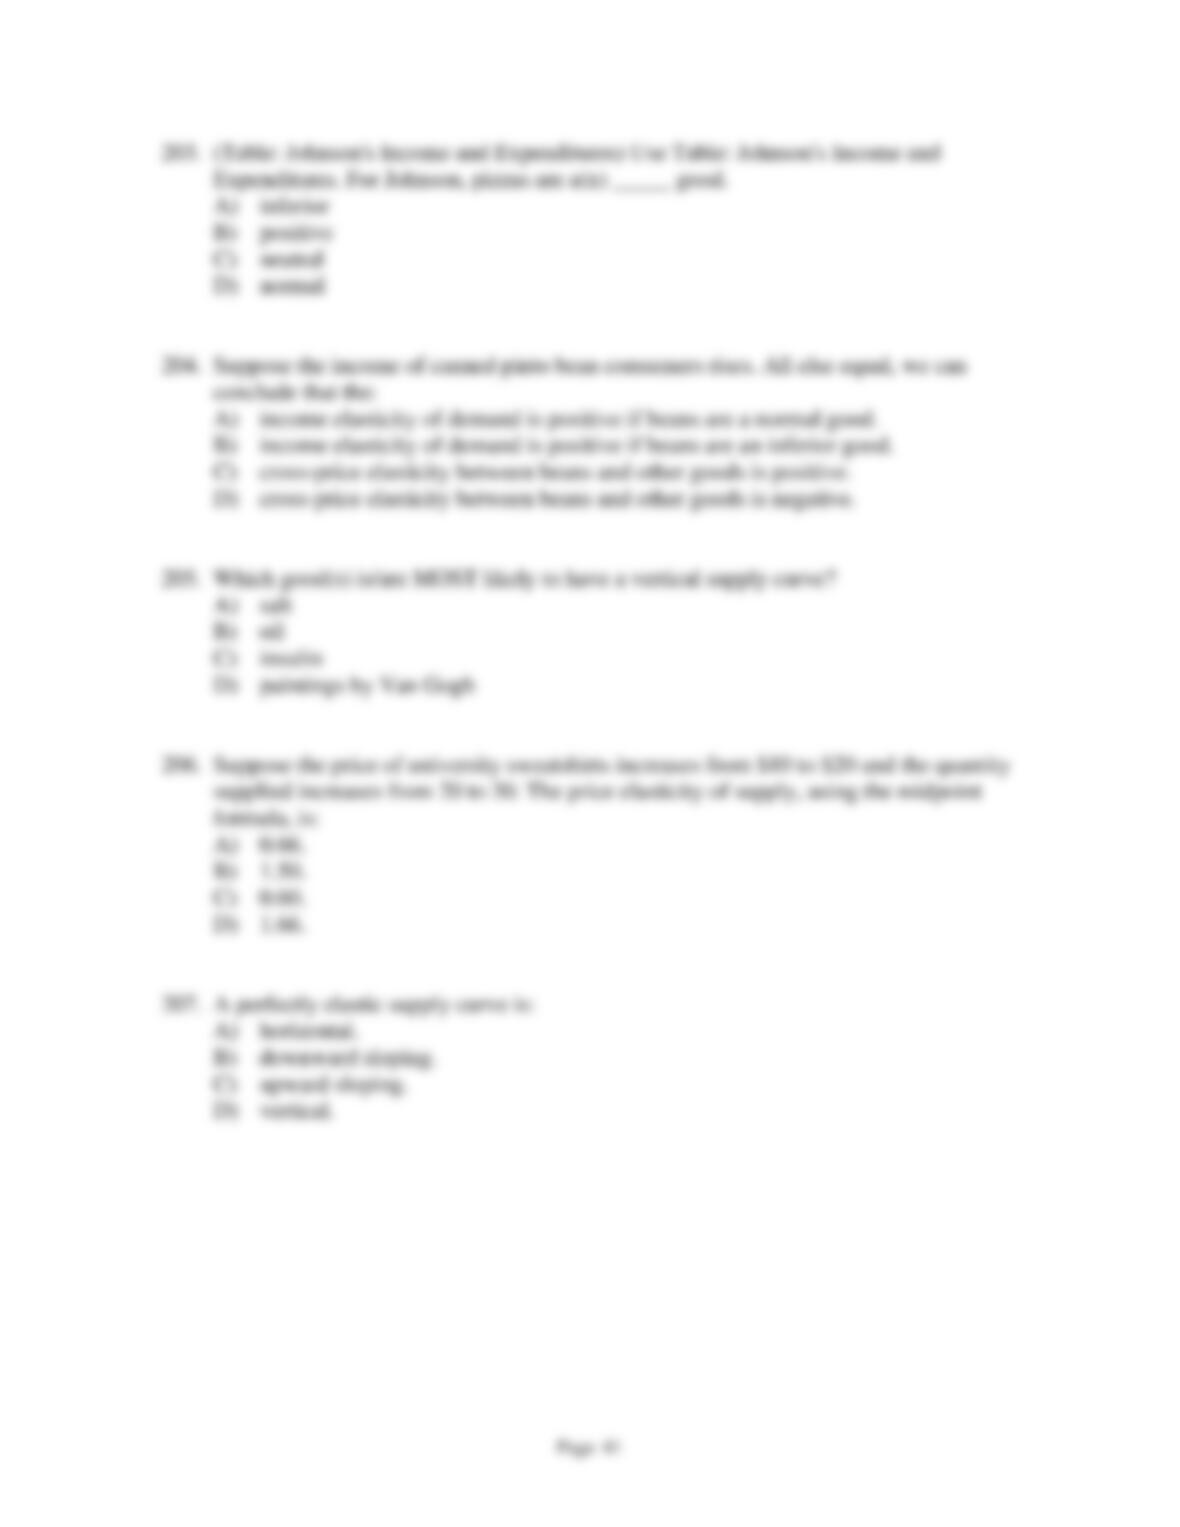
216.
(Figure: Supply Curves) Use Figure: Supply Curves. Which graph shows a perfectly
inelastic supply curve?
A)
A
B)
B
C)
C
D)
D
217.
(Figure: Supply Curves) Use Figure: Supply Curves. Which graph shows a perfectly
elastic supply curve?
A)
A
B)
B
C)
C
D)
D
218.
The price elasticity of supply for a good is 3 if a _____ in price leads to a 3% decrease
in the quantity supplied.
A)
1% increase
B)
1% decrease
C)
9% decrease
D)
9% increase
219.
The price elasticity of supply measures:
A)
the response of a supply shift to changes in technology.
B)
how much supply changes when the prices of inputs change.
C)
the responsiveness of the quantity supplied to changes in the price of the good.
D)
the response of a supply shift to changes in technology and to changes in prices.
220.
If the quantity supplied responds substantially to a relatively small change in price,
supply is:
A)
price-elastic.
B)
price-inelastic.
C)
negatively sloped.
D)
insensitive to changes in price.
221.
If the price elasticity of supply is:
A)
greater than 1, then the supply is price-elastic.
B)
greater than 1, then the supply is price-inelastic.
C)
zero, then the supply is price unit-elastic.
D)
greater than 1, then the quantity supplied is relatively unresponsive to price
changes.
Page 45
222.
If the price elasticity of supply is:
A)
less than 1, then the supply is price-elastic.
B)
less than 1, then the supply is price-inelastic.
C)
zero, then price is unit-elastic.
D)
less than 1, then the supply is very responsive to price changes.
223.
Which statement is likely to be associated with inelastic supply?
A)
The time period under consideration is very long.
B)
The inputs necessary for production cannot readily be increased.
C)
The good is necessary for survival (e.g., a life-saving drug).
D)
Consumers are willing to pay any price for the good.
224.
The long-run price elasticity of supply of crude oil is _____ the short-run price elasticity
of supply of crude oil.
A)
less than
B)
greater than
C)
equal to
D)
not comparable to
225.
In the short run, the price elasticity of supply for foods low in carbohydrates is lower
than it will be in the long run because:
A)
in the short run, inputs are more available to produce these foods than in the long
run.
B)
in the short run, food producers do not have much time to respond to changes in
demand.
C)
in the short run, prices tend to stay constant.
D)
in the long run, the price elasticity of supply tends to be perfectly inelastic.
226.
Which factor is important in determining the price elasticity of supply?
A)
the time the producer has to adjust inputs and outputs
B)
the number of close substitutes
C)
the intensity of the need of consumers
D)
the number of alternative uses of the good
Page 46
227.
Supply curves tend to be more _____ the more time producers have to adjust to price
changes.
A)
price-inelastic
B)
price-elastic
C)
steeply sloped
D)
inflexible
228.
The supply curve for a good will be more elastic if:
A)
spending on the good accounts for a large share of a consumer’s income.
B)
the good is a luxury item.
C)
production inputs are readily available at a relatively low cost.
D)
there is very little time for producers to respond to a price change.
229.
It is very difficult for Julia to find inexpensive inputs for her business. Because of this,
we predict that Julia’s price elasticity of supply is:
A)
elastic.
B)
inelastic.
C)
unit-elastic.
D)
perfectly elastic.
Page 47
Use the following to answer questions 230-231:
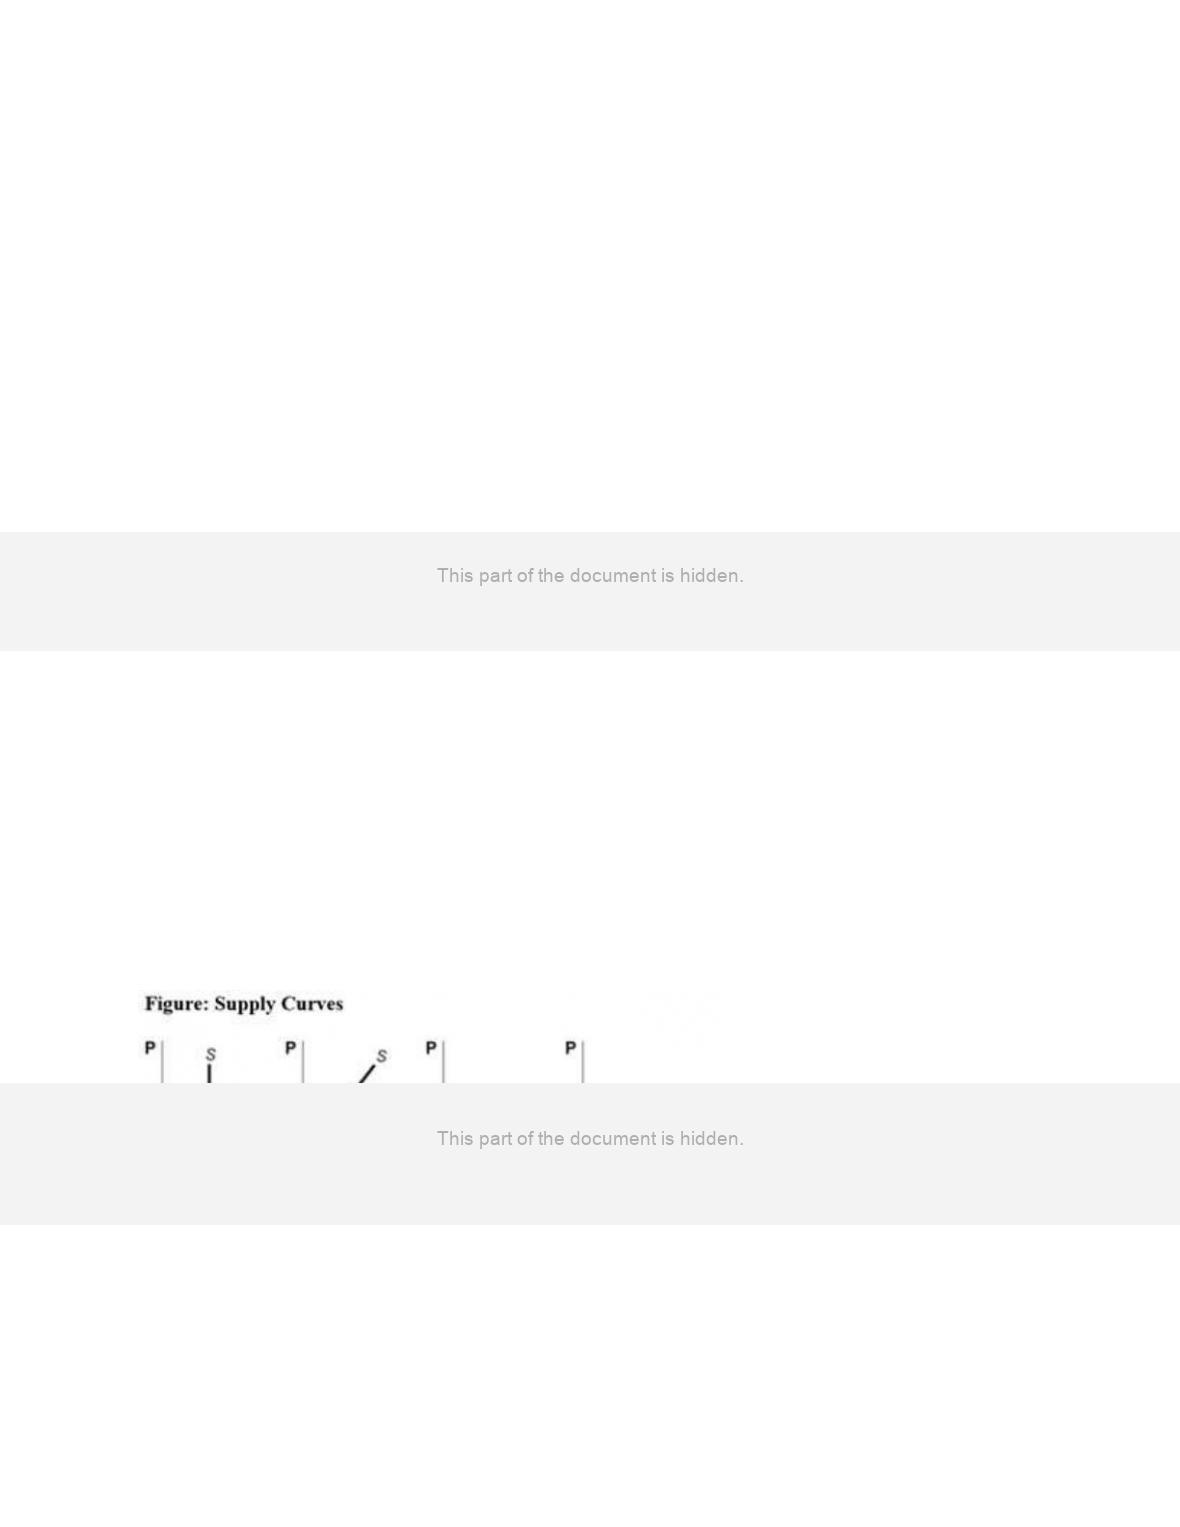
230. (Figure: The Demand Curve for Crossings) Use Figure: The Demand Curve for Crossings.
This graph examines the demand for crossing a bridge over a very large river. By the midpoint
method, the price elasticity of demand between $0.90 and $1.10 is approximately:
A) 0.1.
B) 0.2.
C) 1.
D) 1.9.
230.
(Figure: The Demand Curve for Bridge Crossings) Use Figure: The Demand Curve for
Bridge Crossings. By the midpoint method, the price elasticity of demand between
$0.90 and $1.10 in the figure is _____, since the price elasticity is _____.
A)
price-elastic; less than 1
B)
price unit-elastic; equal to 1
C)
price-elastic; a negative number
D)
price-inelastic; less than 1
Page 48
231.
(Figure: The Demand Curve for Bridge Crossings) Use Figure: The Demand Curve for
Bridge Crossings. Demand is price_____ between $0.90 and $1.10, since total revenue
_____ when the price _____.
A)
unit-elastic; increases; decreases
B)
inelastic; stays the same; decreases
C)
unit-elastic; stays the same; increases
D)
inelastic; increases; increases
Use the following to answer questions 232-234:
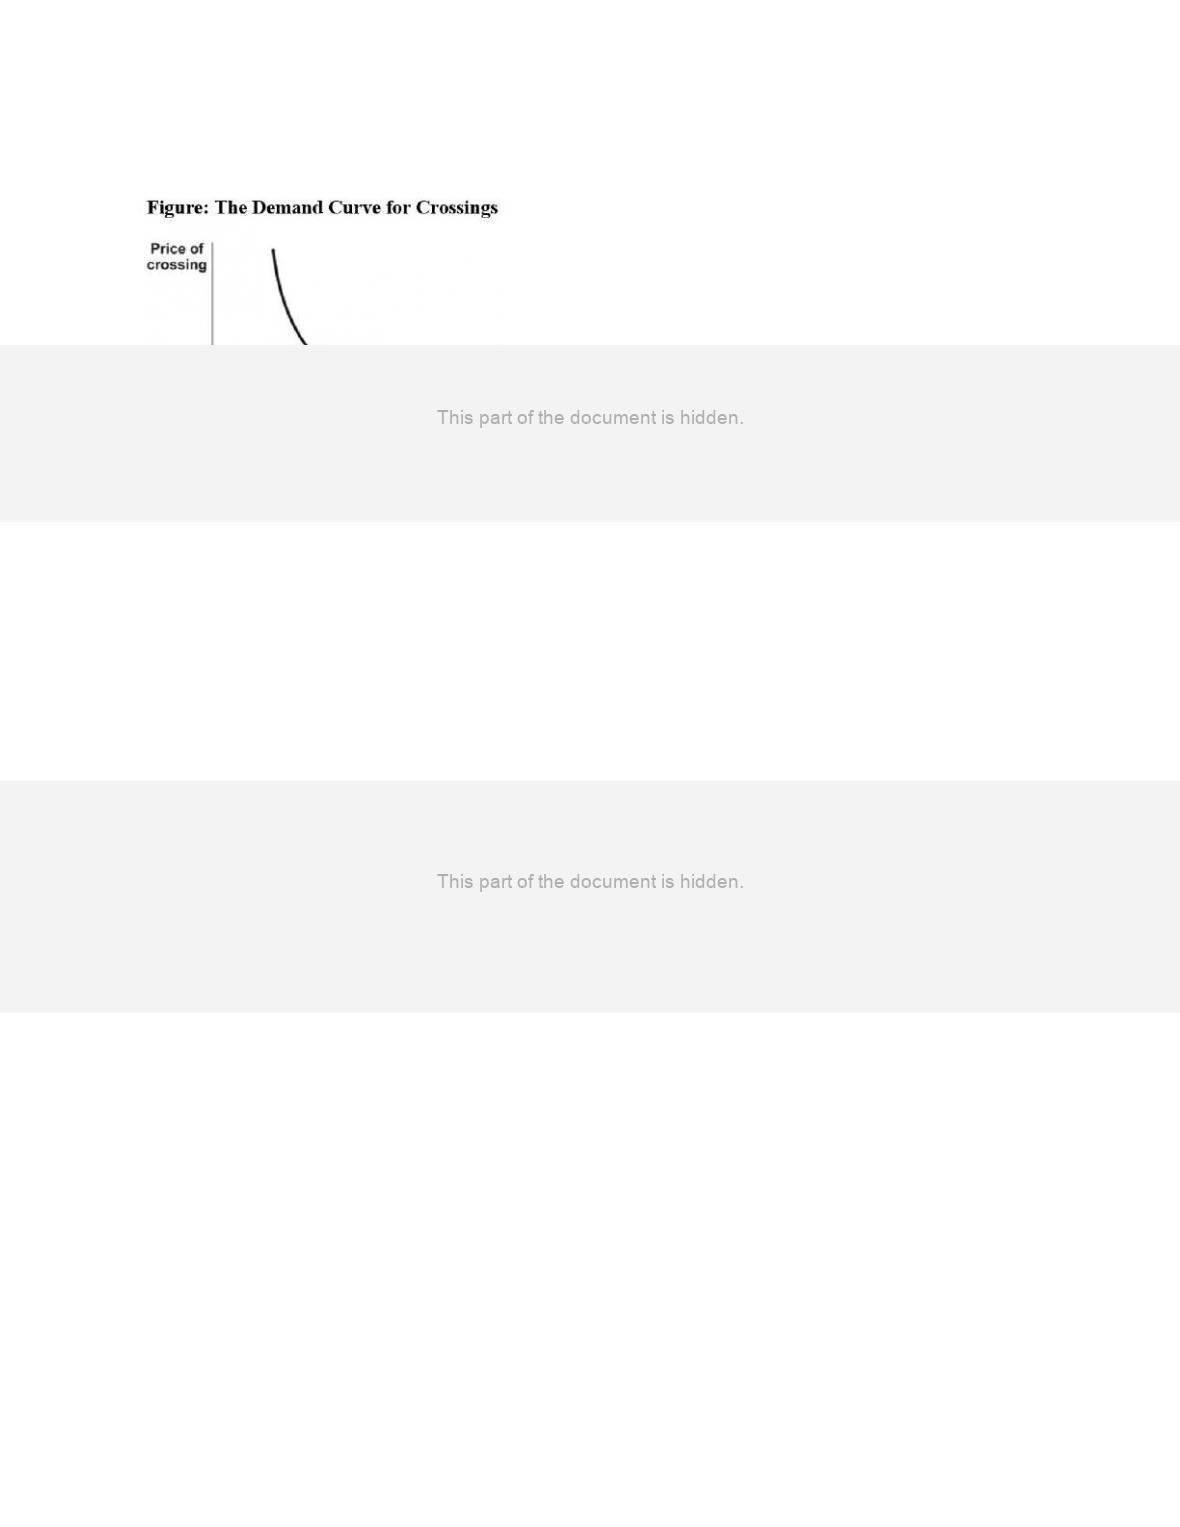
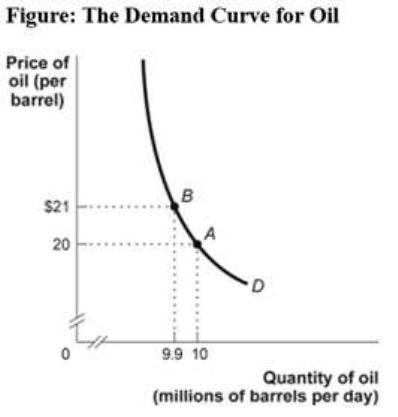
232.
(Figure: The Demand Curve for Oil) Use Figure: The Demand Curve for Oil. The price
elasticity of demand between $20 and $21, by the midpoint method, is approximately:
A)
0.21.
B)
0.49.
C)
2.1.
D)
4.9.
233.
(Figure: The Demand Curve for Oil) Use Figure: The Demand Curve for Oil. The price
elasticity of demand between $20 and $21 is _____ since the price elasticity is _____.
A)
price-elastic; less than 1.
B)
price unit-elastic; equal to 1.
C)
price-inelastic; a negative number.
D)
price-inelastic; less than 1.
Page 49
234.
(Figure: The Demand Curve for Oil) Use Figure: The Demand Curve for Oil. Demand is
price _____ between $20 and $21 since total revenue _____ when the price _____.
A)
elastic; increases; decreases
B)
inelastic; stays the same; decreases
C)
elastic; decreases; increases
D)
inelastic; increases; increases
Use the following to answer questions 235-247:
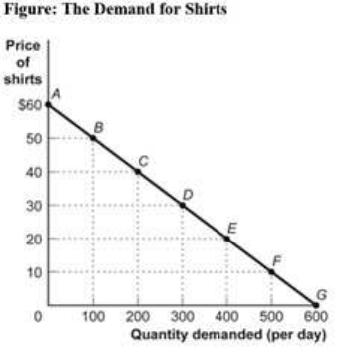
235.
(Figure: The Demand for Shirts) Use Figure: The Demand for Shirts. The price
elasticity of demand for the segment AB, by the midpoint method, is:
A)
13.
B)
11.
C)
0.91.
D)
0.1.
236.
(Figure: The Demand for Shirts) Use Figure: The Demand for Shirts. The price
elasticity of demand for the segment BC, by the midpoint method, is:
A)
greater than 3.33.
B)
3.33.
C)
3.
D)
0.33.

Page 50
237.
(Figure: The Demand for Shirts) Use Figure: The Demand for Shirts. The price
elasticity of demand for the segment EF, by the midpoint method, is:
A)
1.3.
B)
1.
C)
0.7.
D)
0.33.
238.
(Figure: The Demand for Shirts) Use Figure: The Demand for Shirts. By the midpoint
method, the price elasticity of demand for the segment AB is:
A)
less than the price elasticity of demand for the segment BC.
B)
less than the price elasticity of demand for the segment EF.
C)
zero.
D)
greater than the price elasticity of demand for the segment BC.
239.
(Figure: The Demand for Shirts) Use Figure: The Demand for Shirts. By the midpoint
method, the price elasticity of demand for the segment BC is:
A)
less than the price elasticity of demand for the segment AB.
B)
zero.
C)
greater than 3.5.
D)
less than the price elasticity of demand for the segment CD.
240.
(Figure: The Demand for Shirts) Use Figure: The Demand for Shirts. By the midpoint
method, the price elasticity of demand for the segment CD is:
A)
0.71.
B)
1
C)
1.4.
D)
0.29.
241.
(Figure: The Demand for Shirts) Use Figure: The Demand for Shirts. By the midpoint
method, the price elasticity of demand for the segment DE is approximately:
A)
0.29.
B)
0.71.
C)
1.
D)
greater than 10.

Page 51
242.
(Figure: The Demand for Shirts) Use Figure: The Demand for Shirts. By the midpoint
method, the price elasticity of demand for the segment EF is:
A)
greater than 1.
B)
less than the price elasticity of demand for segment FG.
C)
less than the price elasticity of demand for segment DE.
D)
greater than the price elasticity of demand for segment AB.
243.
(Figure: The Demand for Shirts) Use Figure: The Demand for Shirts. The price
elasticity of demand, by the midpoint method, for the segment FG is approximately:
A)
0.
B)
0.09.
C)
0.5.
D)
greater than 1.
244.
(Figure: The Demand for Shirts) Use Figure: The Demand for Shirts. The Demand for
Shirts. At a price of $40, total revenue is:
A)
$40.
B)
$200.
C)
$4,000.
D)
$8,000.
245.
(Figure: The Demand for Shirts) Use Figure: The Demand for Shirts. At a price of $30,
total revenue is _____, and at a price of $10, total revenue is _____.
A)
$9,000; $12,000
B)
$3,000; $5,000
C)
$9,000; $5,000
D)
$5,000; $9,000
246.
(Figure: The Demand for Shirts) Use Figure: The Demand for Shirts. Total revenue is
maximized if the price is:
A)
$30.
B)
$40.
C)
$50.
D)
$60.
Page 52
247.
(Figure: The Demand for Shirts) Use Figure: The Demand for Shirts. If the price is
below _____, demand is inelastic.
A)
$10
B)
$20
C)
$30
D)
$40
Use the following to answer questions 248-252:
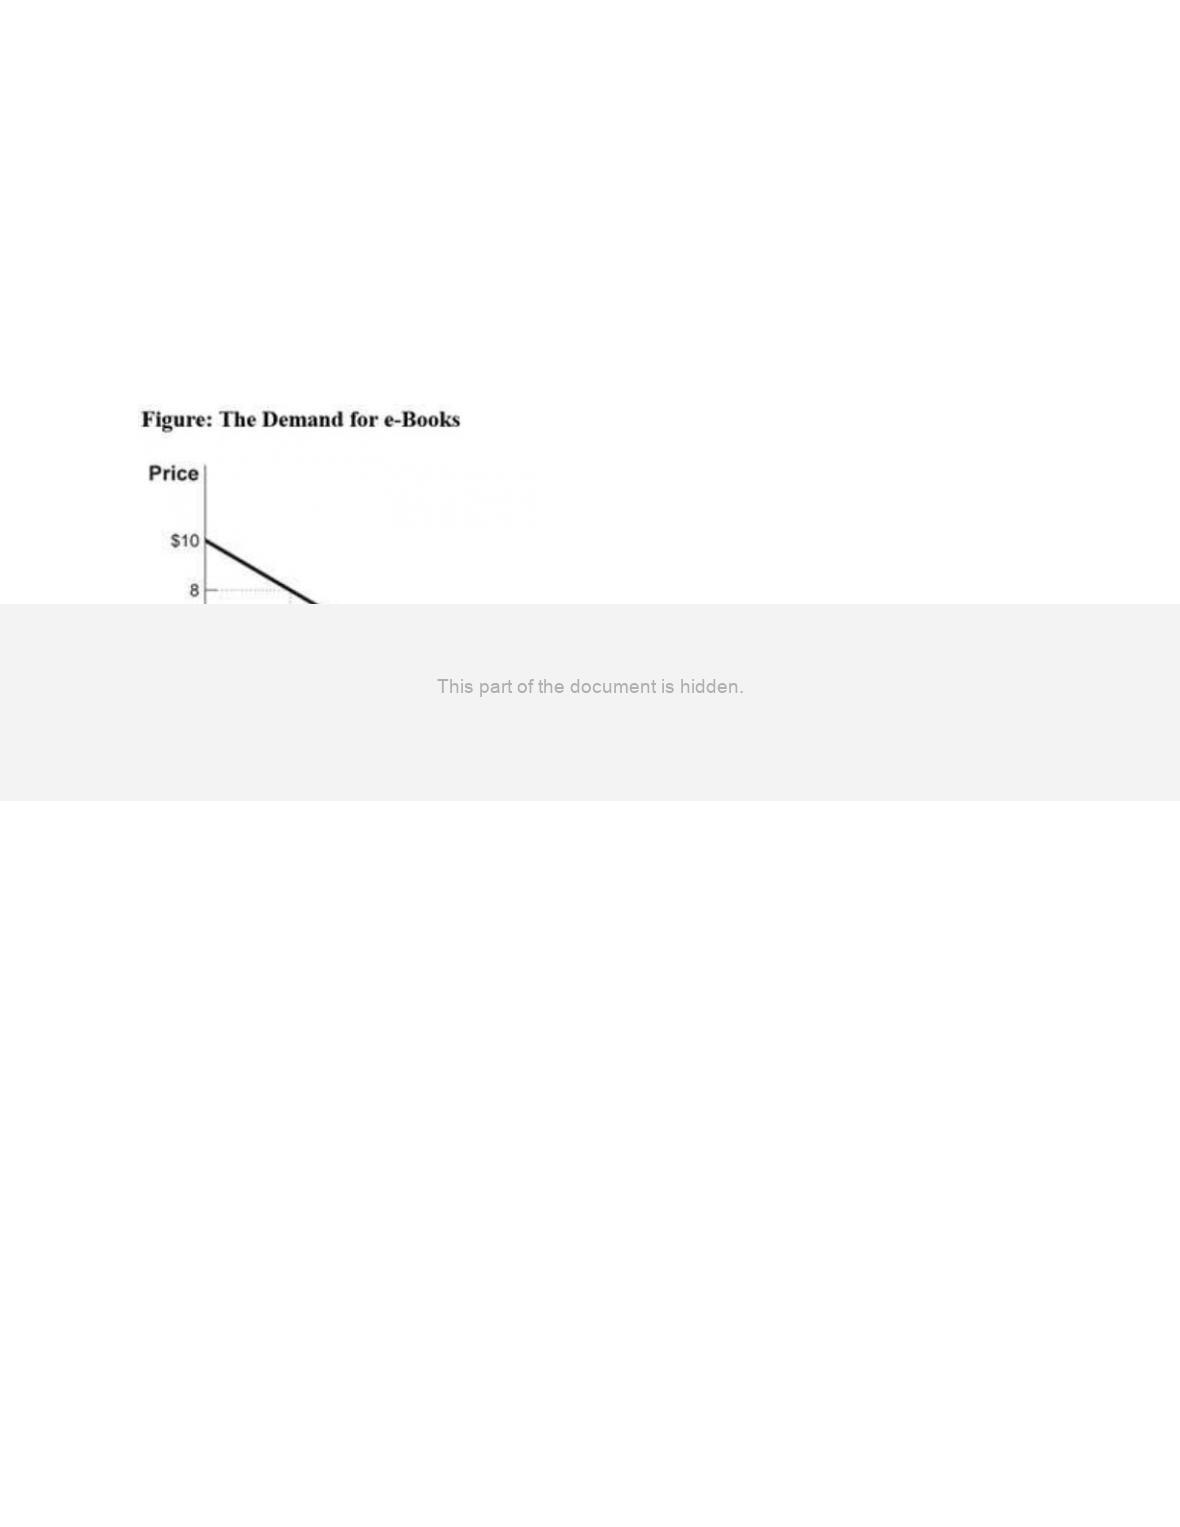
248.
(Figure: The Demand for e-Books) Use Figure: The Demand for e-Books. What is the
price elasticity of demand (by the midpoint method) when the price decreases from $6
to $4?
A)
0.55
B)
0.5
C)
1
D)
0.67
249.
(Figure: The Demand for e-Books) Use Figure: The Demand for e-Books. What is the
price elasticity of demand (by the midpoint method) when the price increases from $6 to
$8?
A)
0.55
B)
0.5
C)
2.33
D)
0.67
Page 53
250.
(Figure: The Demand for e-Books) Use Figure: The Demand for e-Books. The demand
schedule _____ when the price increases from $4 to $6 _____ when it increases from $6
to $8.
A)
is less elastic; than
B)
is more elastic; than
C)
has the same elasticity; as
D)
is unit-elastic; and
251.
(Figure: The Demand for e-Books) If the price of e-Books decreases from $6 to $4, total
revenue _____, which means that demand is _____.
A)
changes from $60 to $90; elastic
B)
remains constant; unit-elastic
C)
changes from $240 to $360; elastic
D)
changes from $40 to $50; inelastic
252.
(Figure: The Demand for e-Books) If the price of e-Books increases from $6 to $8, total
revenue _____, which means that demand is _____.
A)
increases; elastic
B)
decreases; inelastic
C)
remains constant; elastic
D)
decreases; elastic
Use the following to answer questions 253-261:
Page 54
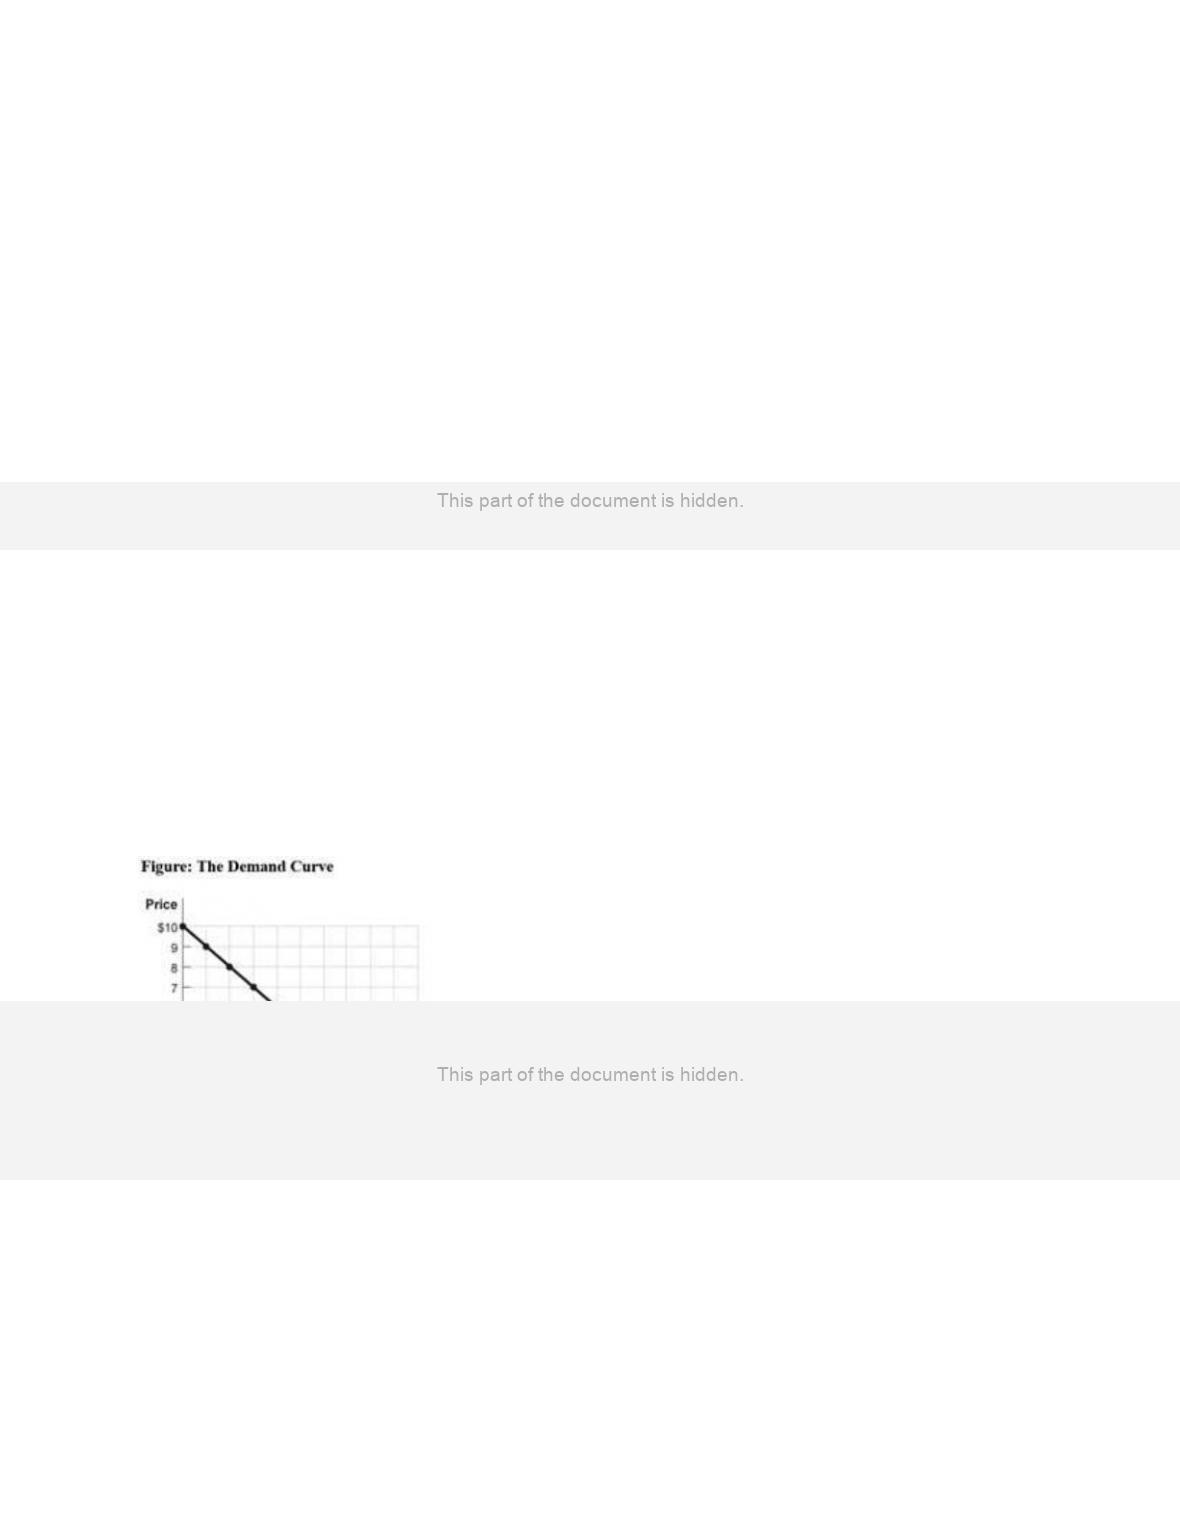
253.
(Figure: The Demand Curve) Use Figure: The Demand Curve. By the midpoint method,
the price elasticity of demand between $8 and $9 is approximately:
A)
0.18.
B)
0.56.
C)
1.80.
D)
5.67.
254.
(Figure: The Demand Curve) Use Figure: The Demand Curve. By the midpoint method,
the price elasticity of demand between $1 and $2 is approximately:
A)
0.18.
B)
0.56.
C)
1.80.
D)
5.67.
255.
(Figure: The Demand Curve) Use Figure: The Demand Curve. By the midpoint method,
the price elasticity of demand between $3 and $4 is approximately:
A)
0.19.
B)
0.54.
C)
1.00
D)
1.86.
256.
(Figure: The Demand Curve) Use Figure: The Demand Curve. By the midpoint method,
the price elasticity of demand between $6 and $8 is approximately:
A)
0.23.
B)
0.45.
C)
2.33.
D)
4.50.
257.
(Figure: The Demand Curve) Use Figure: The Demand Curve. By the midpoint method,
the price elasticity of demand between $6 and $7 is approximately:
A)
0.19.
B)
1.00.
C)
1.86.
D)
5.40.
Page 55
258.
(Figure: The Demand Curve) Use Figure: The Demand Curve. If the price is $5, total
revenue is:
A)
$5.
B)
$10.
C)
$20.
D)
$25.
259.
(Figure: The Demand Curve) Use Figure: The Demand Curve. If the price is $8, total
revenue is _____. If the price is $7, total revenue is _____.
A)
$24; $16
B)
$14; $21
C)
$16; $21
D)
$10; $10
260.
(Figure: The Demand Curve) Use Figure: The Demand Curve. If the price is $3, total
revenue is _____. If the price is $4, total revenue is _____.
A)
$21; $24
B)
$21; $18
C)
$12; 28
D)
$7; $13
261.
(Figure: The Demand Curve) Use Figure: The Demand Curve. Between prices $4 and
$5, demand is _____, and total revenue will _____ if price increases.
A)
elastic; increase
B)
elastic; decrease
C)
inelastic; increase
D)
inelastic; decrease
262.
Consider the market for strawberries. Which statement MOST likely applies to the
strawberry market?
A)
The income elasticity of demand for strawberries is negative.
B)
The price elasticity of supply of strawberries is greater in the short run than in the
long run.
C)
The price elasticity of demand for strawberries is lower in the long run than in the
short run.
D)
The cross-price elasticity of demand for strawberries with respect to the price of
raspberries is positive.
Page 56
Use the following to answer questions 263-264:
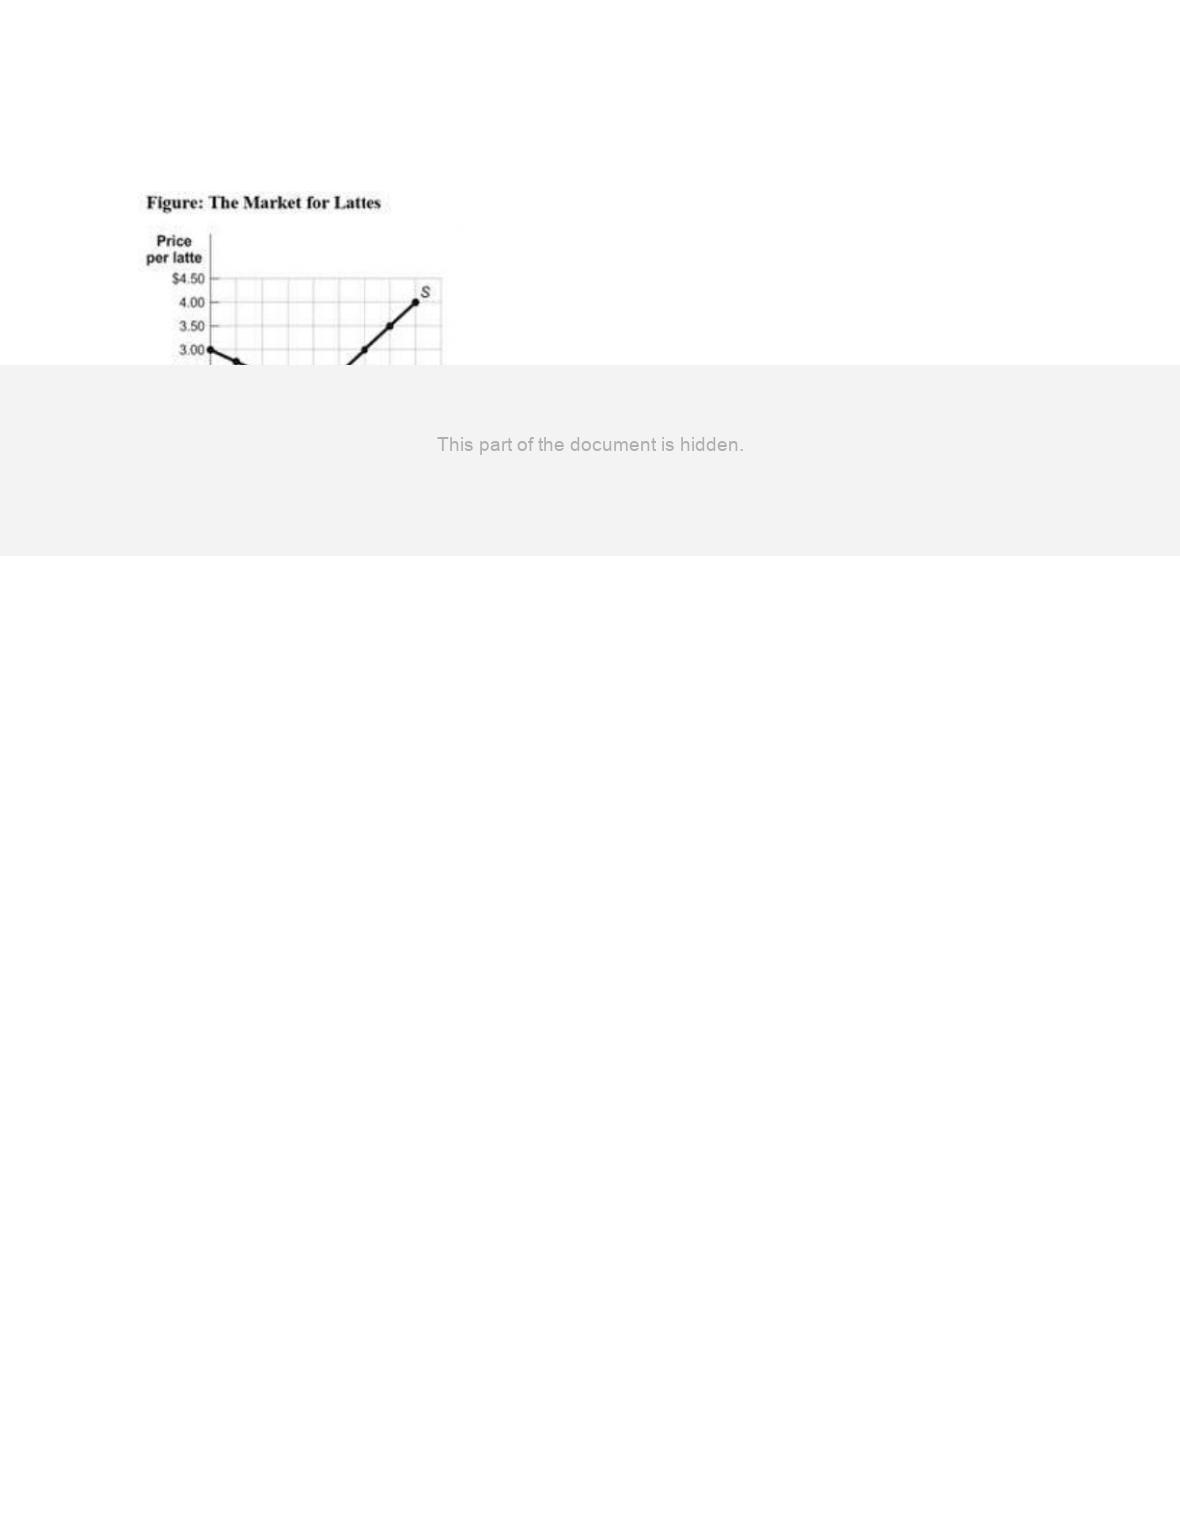
263.
(Figure: The Market for Lattes) Use Figure: The Market for Lattes. What is the price
elasticity of demand between $2 and $2.50 per cup, using the midpoint formula?
A)
0.33
B)
1.00
C)
2.51
D)
3.00
264.
(Figure: The Market for Lattes) Use Figure: The Market for Lattes. What is the price
elasticity of supply between the prices of $2 and $2.50 per cup, using the midpoint
formula?
A)
0.33
B)
1.00
C)
1.51
D)
3.00
265.
Suppose the price of Vanilla Coke increases by 9% and quantity demanded falls by 13%
overall but only by 4% for loyal Coca-Cola customers. This means that for the general
public there are _____ for Vanilla Coke, but for loyal Coca-Cola customers, Vanilla
Coke is more of a _____. This means that Coca-Cola will enjoy an increase in total
revenue only from _____.
A)
several substitutes; necessity; loyal Coca-Cola customers
B)
few substitutes; luxury item; the general public
C)
no substitutes; necessity; the general public
D)
several substitutes; necessity; the general public
Page 57
266.
A group of dairy farmers is trying to raise milk prices by 10%. If the price elasticity of
demand for milk is 0.75 and the price elasticity of supply for milk is 0, by how much
should farmers reduce their milk production to obtain the 10% increase?
A)
10%
B)
7.5%
C)
15%
D)
13%
267.
If an increase in the price of a good leads to an increase in total revenue, the _____
curve is price _____.
A)
supply; inelastic
B)
demand; inelastic
C)
supply; elastic
D)
demand; elastic
268.
Suppose the price elasticity of demand for blueberries is 1.5. If climate change destroys
one-fourth of the nation’s blueberry crop, how will that affect total revenue for blueberry
producers, all other things unchanged?
A)
Total revenue will rise.
B)
Total revenue will fall.
C)
Total revenue will remain unchanged.
D)
The information is insufficient to answer the question.
269.
The price elasticity of demand for gasoline in the short run has been estimated to be 0.1.
If a war in the Middle East causes the price of oil (from which gasoline is made) to
increase, how will that affect total expenditures on gasoline in the short run, all other
things equal?
A)
Quantity demanded will stay the same, but total expenditures will fall.
B)
Quantity demanded will decrease a massive amount, but total expenditures will
rise.
C)
Total expenditures will remain unchanged.
D)
Quantity demanded will not change much, but total expenditures will rise.
270.
The price elasticity of demand for cabbage has been estimated to be 0.25. If an insect
infestation destroys 20% of the nation’s cabbage crop (and thus reduces supply), how
will that affect total expenditures on cabbage, all other things equal?
A)
Total expenditures will rise.
B)
Total expenditures will fall.
C)
Total expenditures will remain unchanged.
D)
The information is insufficient to answer the question.
Page 58
271.
The price elasticity of demand for soft drinks has been estimated to be 0.55. If the
government enacts a major increase in the tax on imported sugar (a major ingredient in
soft drink manufacturing), how will that affect total expenditures on soft drinks, all
other things equal?
A)
Total expenditures will remain unchanged.
B)
Total expenditures will fall.
C)
Total expenditures will rise.
D)
People will buy Pepsi instead of Coke.
272.
The price elasticity of demand for ground beef has been estimated to be 1.0. If mad cow
disease strikes the United States and a large percentage of the cattle are removed from
the market, how will that affect total expenditures on ground beef, all other things
equal?
A)
Total expenditures will remain unchanged.
B)
Total expenditures will fall by more than 1%.
C)
Demand will fall by 1%, but total expenditures will fall by less than 1%.
D)
Total expenditures will rise.
273.
Assume the price elasticity of demand for corn has been estimated to be 2.33. Flash
floods destroy 10% of the nation’s crop of corn. Which statement BEST describes how
this will affect total expenditures on corn, all other things equal?
A)
Total expenditures will remain unchanged.
B)
Total expenditures will fall.
C)
Total expenditures will rise.
D)
The information is insufficient to answer the question.
274.
The price elasticity of demand for fresh zucchini has been estimated to be 2.25. A new
irrigation system yields a 25% increase in the nation’s crop of fresh zucchini. Which
statement BEST describes how this will affect total expenditures on zucchini, all other
things equal?
A)
Total expenditures will remain unchanged.
B)
Total expenditures will fall.
C)
Total expenditures will rise.
D)
The information is insufficient to answer the question.