
Page 41
198.
(Table: Per Capita GDP) Per capita nominal GDP in 2011 was:
A)
$600.
B)
$400.
C)
$300.
D)
$30.
199.
(Table: Per Capita GDP) Use Table: Per Capita GDP. Per capita nominal GDP in 2014
was:
A)
$600.
B)
$800.
C)
$300.
D)
$1,600.
200.
(Table: Per Capita GDP) Use Table: Per Capita GDP. The growth rate of per capita
nominal GDP was:
A)
10%.
B)
20%.
C)
25%.
D)
33%.
201.
(Table: Per Capita GDP) Use Table: Per Capita GDP. If 2011 is the base year, real GDP
in 2011 was:
A)
$500.
B)
$3,000.
C)
$4,000.
D)
$300,000.
202.
(Table: Per Capita GDP) Use Table: Per Capita GDP. If 2011 is the base year, real GDP
in 2014 was:
A)
$400.
B)
$3,000.
C)
$4,000.
D)
$80,000.
203.
(Table: Per Capita GDP) Use Table: Per Capita GDP. The growth rate of real GDP from
2011 to 2014 was:
A)
10%.
B)
20%.
C)
25%.
D)
33%.
Page 42
204.
(Table: Per Capita GDP) Use Table: Per Capita GDP. Per capita real GDP in 2011
was:
A)
$600.
B)
$400.
C)
$300.
D)
$30.
205.
(Table: Per Capita GDP) Use Table: Per Capita GDP. Per capita real GDP in 2014 was:
A)
$600.
B)
$800.
C)
$300.
D)
$400.
206.
(Table: Per Capita GDP) Use Table: Per Capita GDP. The growth rate of per capita real
GDP from 2011 to 2014 was:
A)
200%.
B)
50%.
C)
–50%.
D)
–33%.
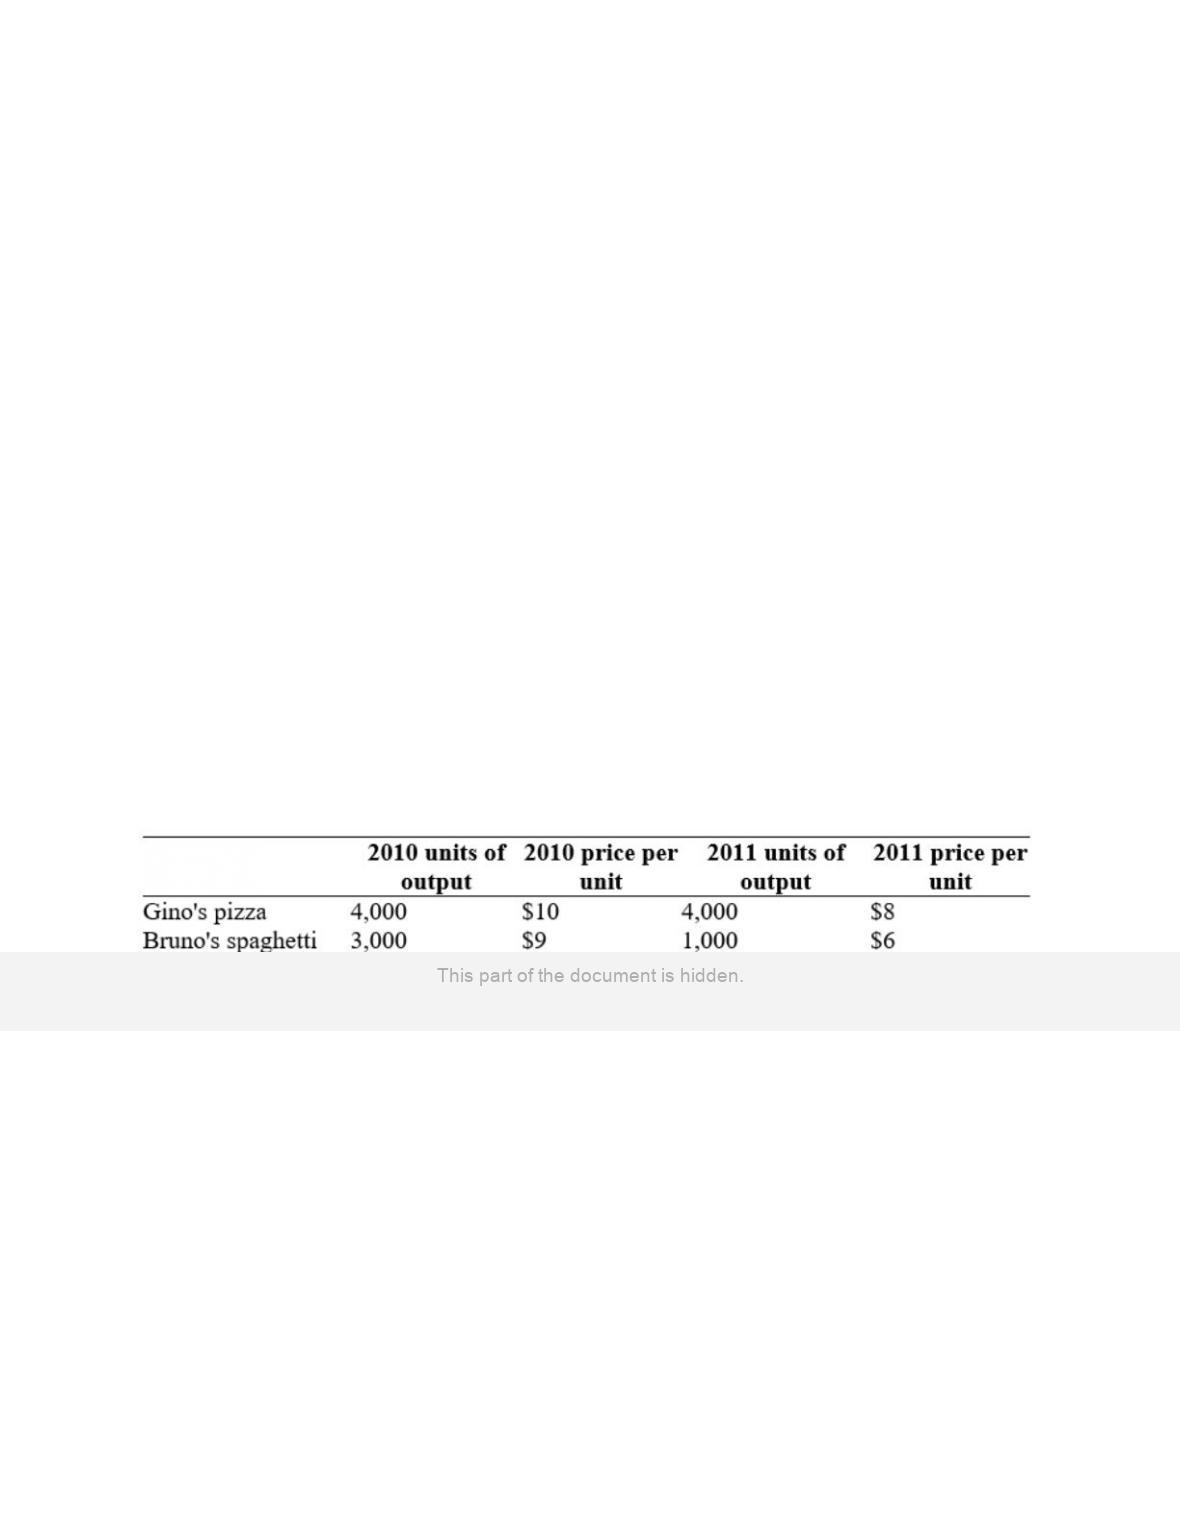
Use the following to answer questions 207-213:
207.
(Table: Pizza Economy III) Use Table: Pizza Economy III. Considering 2010 as the
base year, nominal GDP in 2011 was:
A)
$47,000.
B)
$69,000.
C)
$72,000.
D)
$114,000.

Page 43
208.
(Table: Pizza Economy III) Use Table: Pizza Economy III. Considering 2010 as the
base year, real GDP in 2011 was:
A)
$47,000.
B)
$69,000.
C)
$72,000.
D)
$114,000.
209.
(Table: Pizza Economy III) Use Table: Pizza Economy III. Considering 2010 as the
base year, real GDP between 2010 and 2011 grew at a rate of:
A)
53.19%.
B)
39.47%.
C)
–39.47%.
D)
–58.67%.
210.
(Table: Pizza Economy III) Use Table: Pizza Economy III. Considering 2010 as the
base year, given that total population was 1,140 in 2010 and 1,380 in 2011, real GDP
per capita in 2010 was:
A)
$80.
B)
$53.
C)
$60.
D)
$100.
211.
(Table: Pizza Economy III) Use Table: Pizza Economy III. Considering 2010 as the
base year, given that total population was 1,140 in 2010 and 1,380 in 2011, real GDP
per capita between 2010 and 2011 grew at a rate of _____%.
A)
–50
B)
–25
C)
50
D)
75
212.
(Table: Pizza Economy III) Use Table: Pizza Economy III. Using 2010 as the base year,
nominal GDP in 2010 was:
A)
$47,000.
B)
$69,000.
C)
$72,000.
D)
$114,000.

Page 44
213.
(Table: Pizza Economy III) Use Table: Pizza Economy III. Using 2010 as the base
year, real GDP in 2010 was:
A)
$47,000.
B)
$69,000.
C)
$72,000.
D)
$114,000.
214.
The aggregate price level is the:
A)
average price of shares on the stock market.
B)
average price of commodities.
C)
overall level of prices.
D)
same as the average price of gasoline.
215.
Inflation is a(n):
A)
rising aggregate price level.
B)
expansion of output.
C)
rise in wages.
D)
rise in the unemployment rate.
216.
Choose the best answer. A price index:
A)
always includes a base year.
B)
measures the cost of purchasing a market basket of output across different years.
C)
is normalized to 100 for the base year.
D)
always includes a base year, measures the cost of purchasing a market basket of
output across different years, and is normalized to 100 for the base year.
217.
In a market basket of goods:
A)
the quantities stay constant and the prices may change.
B)
the quantities may change and the prices are held constant.
C)
both the prices and the quantities are held constant.
D)
both the prices and the quantities may change.
218.
Suppose that, in the base period, a college student buys 20 gallons of gasoline at $2 per
gallon, 2 CDs for $13 each, and 4 movie tickets for $7 each. In the next month, the price
of gasoline is $2.25 per gallon, CDs cost $12.50 each, and the price of a movie ticket is
$7.50. The price index for the second month is:
A)
94.
B)
106.4.
C)
100.
D)
101.1.
Page 45
219.
Suppose that, in the base period, a college student buys 20 gallons of gasoline at $2 per
gallon, 2 CDs for $13 each, and 4 movie tickets for $7 each. In the next month, the price
of gasoline is $2.25 per gallon, CDs cost $12.50 each, and the price of a movie ticket is
$7.50. The change in the price level from the first to the second month is:
A)
1.1%.
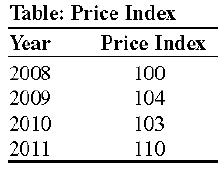
B)
94%.
C)
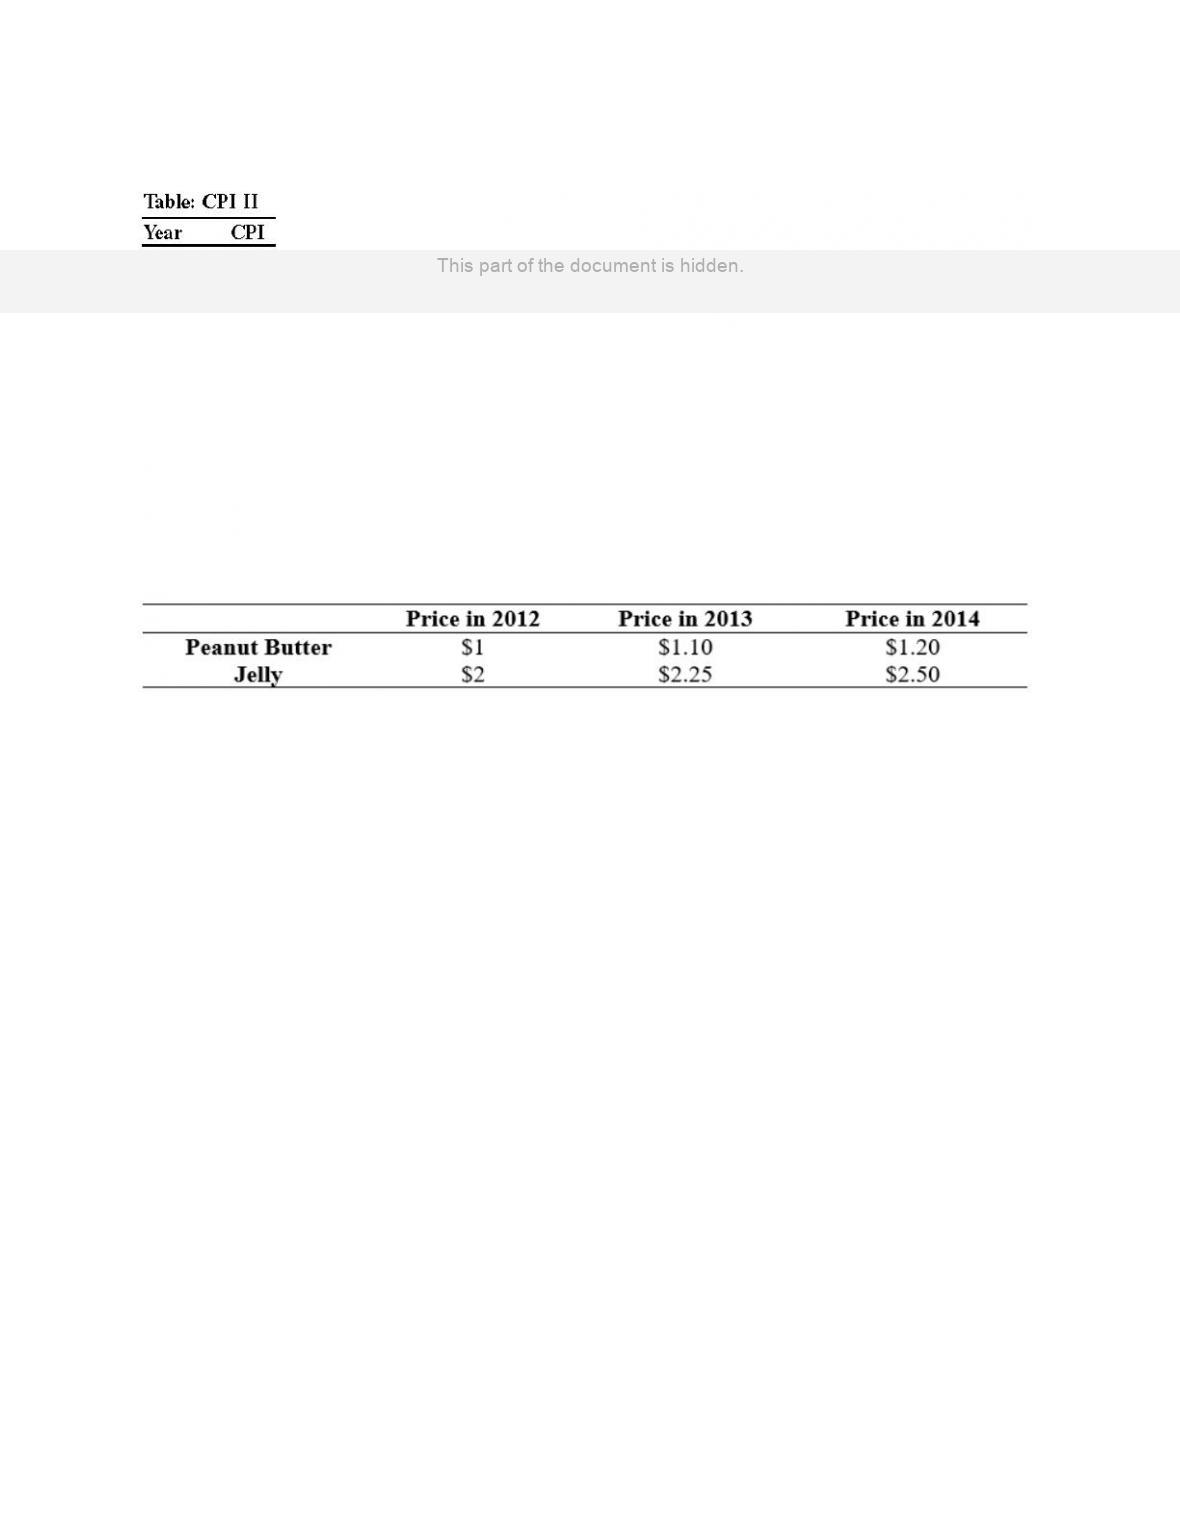
6.4%.
D)
–6%.
220.
In the Republic of Sildavia, a market basket of goods and services cost $130 in 2009,
$140 in 2010, and $160 in 2011. Based on this information and considering 2009 to be
the base year, the price index in 2011 was:
A)
100.
B)
107.69.
C)
123.07.
D)
130.
221.
In the Republic of Sildavia, a market basket of goods and services cost $130 in 2009,
$140 in 2010, and $160 in 2011. Based on this information and considering 2009 as the
base year, inflation from 2009 to 2011 was:
A)
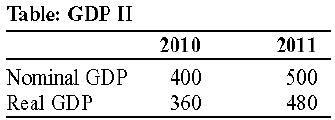
7.14%.
B)
7.69%.
C)
14.28%.
D)
23.07%.
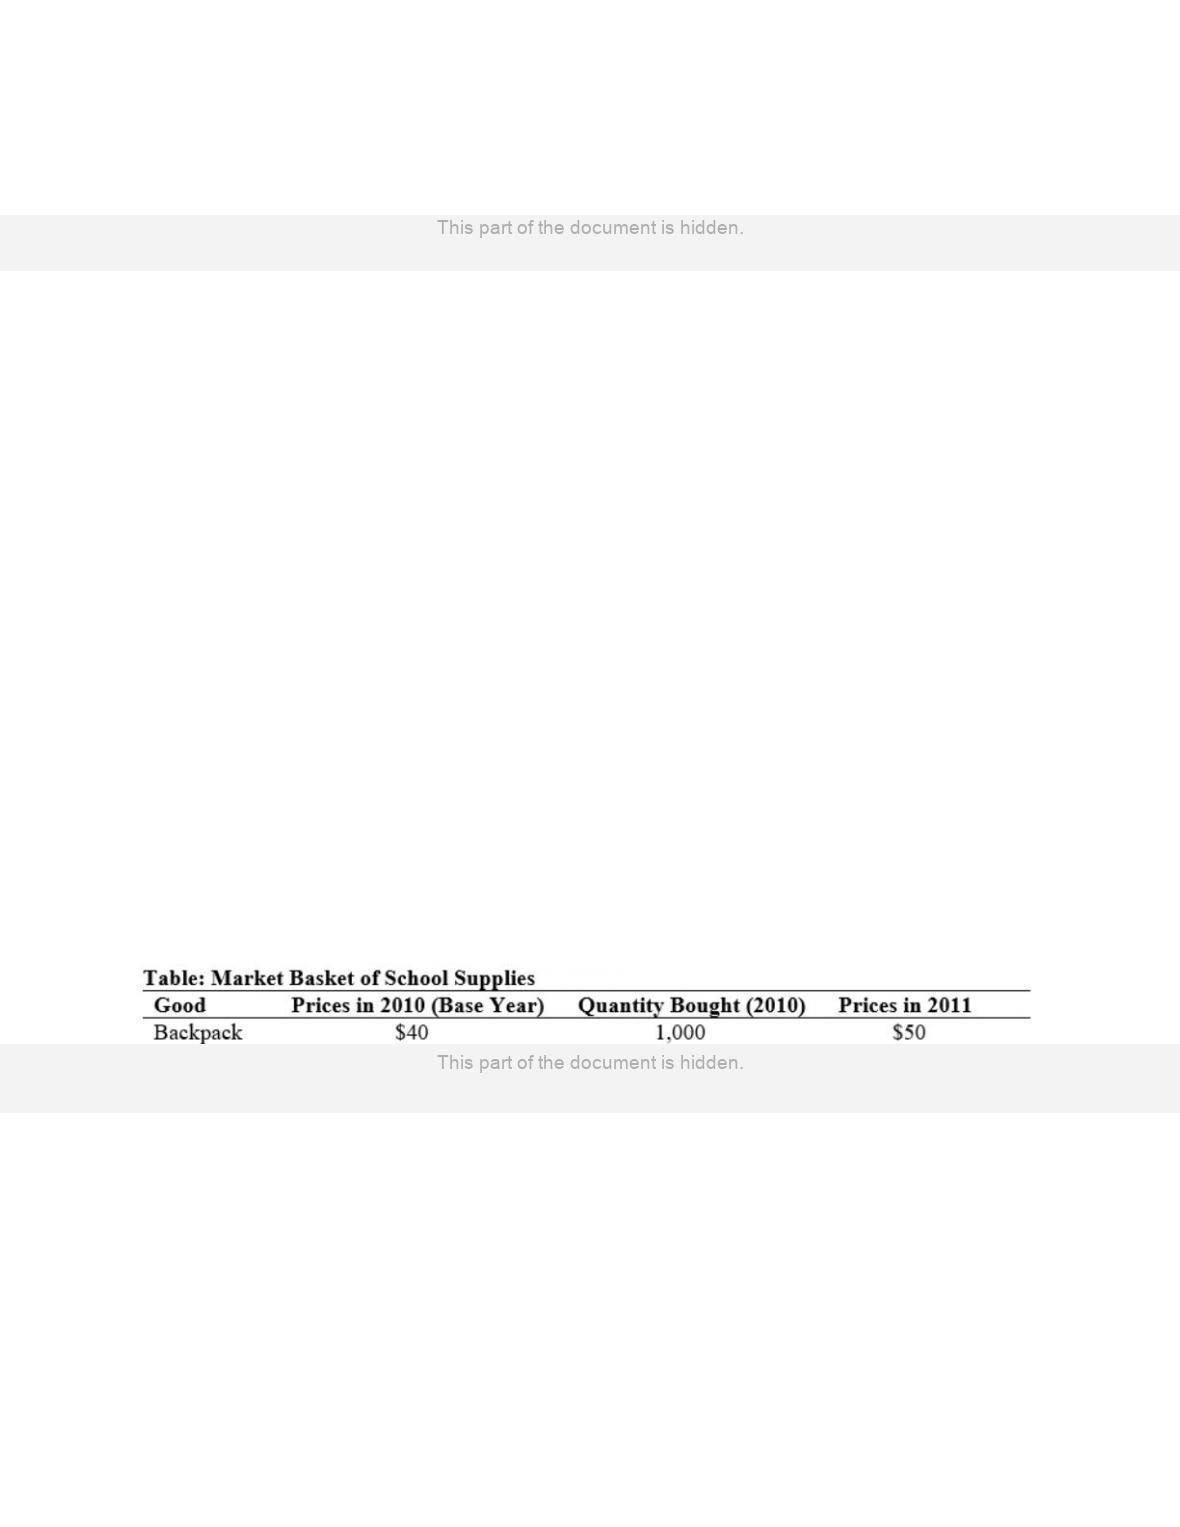
Use the following to answer questions 222-223:
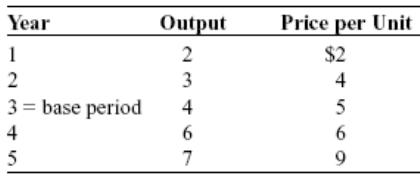
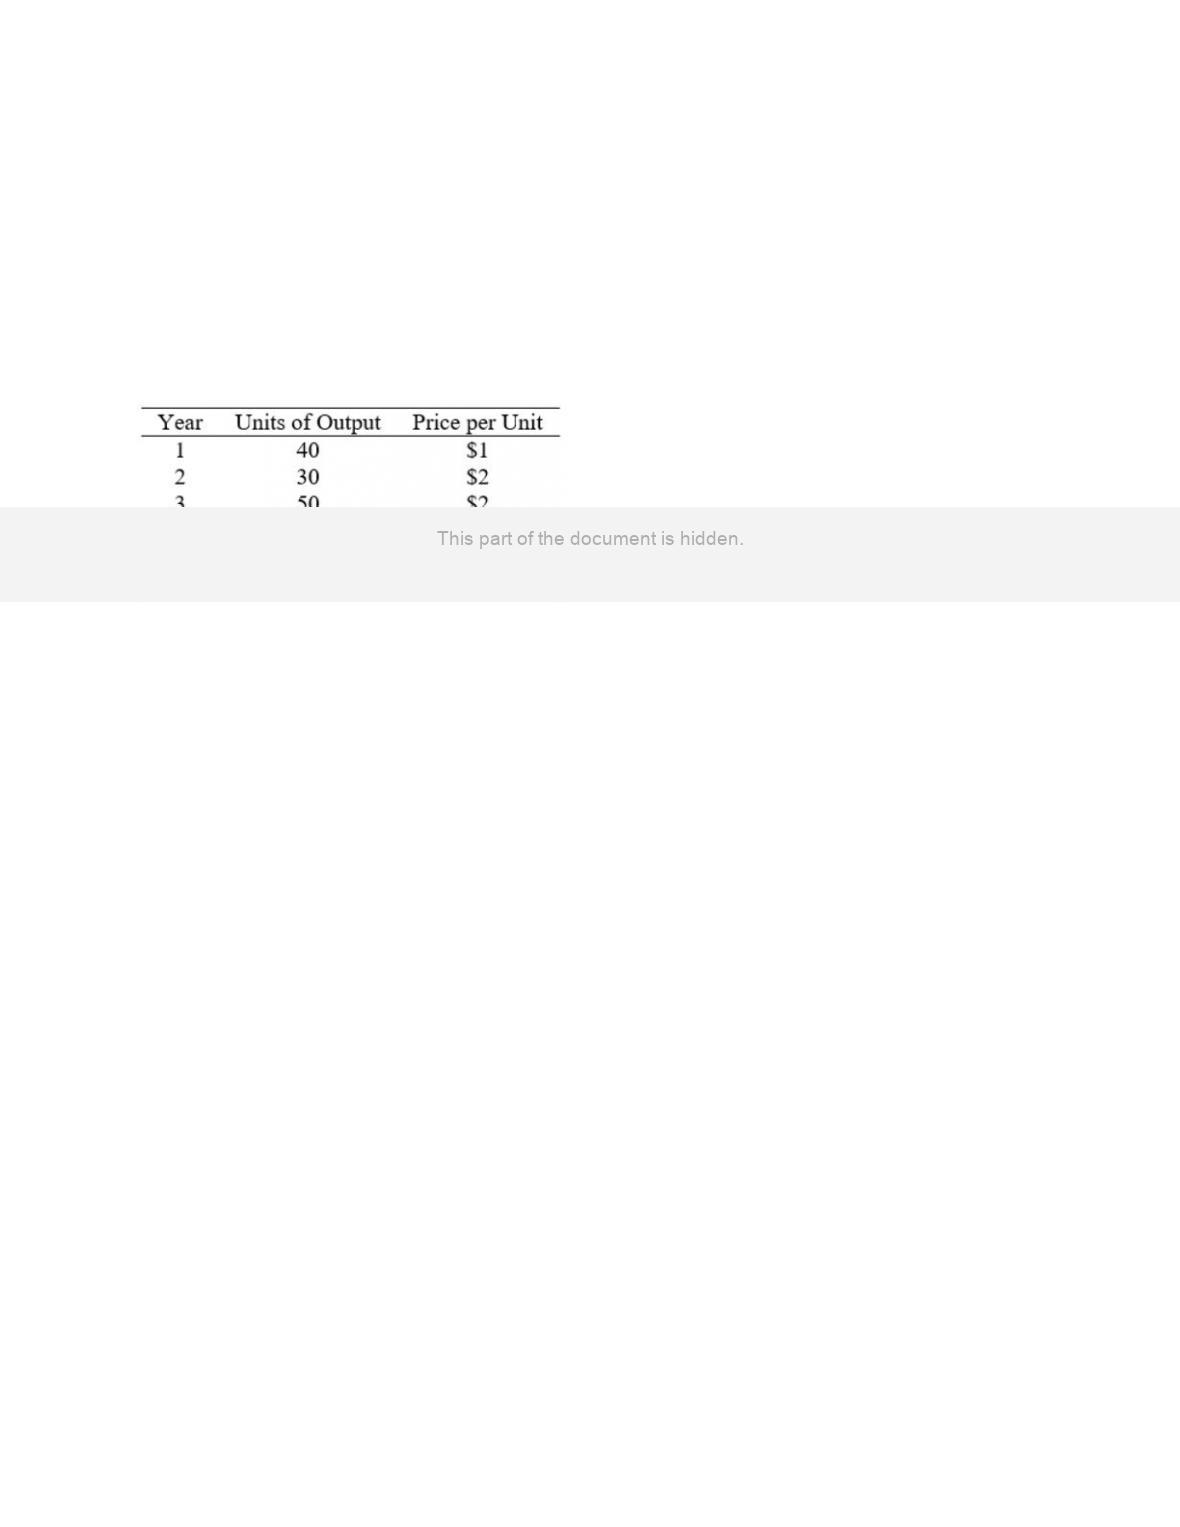
Page 46
222.
(Table: Market Basket of School Supplies) Use Table: Market Basket of School
Supplies. It shows the prices of three common school supplies in 2010 and 2011 and the
quantities of each school supply that consumers bought in 2010, the base year. A school
supply price index for 2011 would be:
A)
81.8.
B)
100.
C)
122.2.
D)
124.
223.
(Table: Market Basket of School Supplies) Use Table: Market Basket of School
Supplies. It shows the prices of three common school supplies in 2010 and 2011 and the
quantities of each school supply that consumers bought in 2010, the base year. A school
supply index used to measure the rate at which average school supply prices have
changed would show an inflation rate of:
A)
22%.
B)
122%.
C)
82%.
D)
18%.
224.
If the cost of a market basket is $200 in year 1 and $230 in year 2, the price index for
year 2 using year 1 as the base is:
A)
100.
B)
115.
C)
130.
D)
200.
225.
If the cost of a market basket is $150 in year 1 and $200 in year 2, the price index for
year 1 using year 2 as the base is:
A)
75.
B)
100.
C)
133.
D)
150.
226.
Suppose that the market basket for the university student price index (USPI) consists of
5 textbooks and 100 gallons of gasoline. In 2010, the base year for this index, textbooks
cost $50 each and gasoline costs $1 per gallon. In 2011, textbooks cost $80 each and
gasoline costs $3 per gallon. The USPI for 2011 is:
A)
100.
B)
150.
C)
200.
D)
250.
Page 47
227.
Suppose that the market basket for the university student price index (USPI) consists of
4 textbooks and 100 gallons of gasoline. In 2010, the base year for this index, textbooks
cost $50 each and gasoline costs $1 per gallon. In 2011, textbooks still cost $50 each
and gasoline costs $4 per gallon. The USPI for 2011 is:
A)
250.
B)
200.
C)
150.
D)
100.
228.
The inflation or deflation rate is:
A)
the change in a price index divided by the initial value of the index.
B)
the change in a price index divided by the new index number.
C)
the difference between the initial price index number and the new price index
number.
D)
computed by dividing the old price index number by the new price index number.
229.
Inflation can be measured by the:
A)
percentage change in the consumer price index.
B)
absolute change in the consumer price index.
C)
absolute change in the GDP deflator.
D)
percentage change in GDP.
230.
If the consumer price index is 120 in year 1 and 150 in year 2, then the rate of inflation
from year 1 to year 2 is:
A)
10%.
B)
20%.
C)
25%.
D)
30%.
Use the following to answer questions 231-233:
Page 48
231.
(Table: The Consumer Price Index) Use Table: The Consumer Price Index. The
approximate rate of inflation in year 3 is:
A)
5%.
B)
10%.
C)
19%.
D)
20%.
232.
(Table: The Consumer Price Index) Use Table: The Consumer Price Index. The
approximate rate of inflation in year 5 is:
A)
25%.
B)
10%.
C)
19%.
D)
20%.
233.
(Table: The Consumer Price Index) Use Table: The Consumer Price Index. The
approximate rate of inflation in year 2 is:
A)
10%.
B)
19%.
C)
20%.
D)
25%.
234.
If the consumer price index changes from 120 to 125 between December 2009 and
December 2010, the:
A)
inflation rate for 2010 is 4.2%.
B)
inflation rate for 2010 is 5%.
C)
deflation rate for 2010 is 5%.
D)
deflation rate for 2010 is 4.2%.
235.
If the price index in year 1 is 146 and in year 2 is 163, the rate of inflation between year
1 and year 2 is:
A)
8.2%.
B)
10.43%.
C)
11.64%.
D)
17.0%.
Page 49
236.
If the consumer price index is 180 in year 1 and 190 in year 2, the inflation rate between
year 1 and year 2 is about:
A)
5.26%.
B)
5.56%.
C)
6.5%.
D)
10%.
237.
Assume that the consumer price index for 2009 was 72.6 and for 2010 was 82.4. What
was the inflation rate between the two years?
A)
0.88%
B)
9.8%
C)
11.9%
D)
13.5%
238.
Assume that the consumer price index for 2009 was 103.9 and for 2010 was 107.6.
What was the inflation rate between the two years?
A)
0.97%
B)
1.04%
C)
3.56%
D)
3.70%
239.
Assume that the consumer price index for 2009 was 124.0 and for 2010 was 130.7.
What was the inflation rate between the two years?
A)
0.95%
B)
5.40%
C)
6.70%
D)
3.20%
240.
If the consumer price index for 2009 was 148.3 and for 2010 was 152.5, what was the
inflation rate between the two years?
A)
0.97%
B)
2.83%
C)
4.20%
D)
9.72%
Page 50
241.
If the consumer price index for 2010 was 160.6 and for 2011 was 163.1, what was the
inflation rate between the two years?
A)
0.25%
B)
1.56%
C)
2.59%
D)
5%
242.
You read in the newspaper that the consumer price index in 2011 was 120. You
conclude that a typical market basket in 2011 would have cost _____ more than the
same market basket purchased in _____.
A)
20%; 2010
B)
120%; 2010
C)
20%; the base year
D)
120%; the base year
Use the following to answer questions 243-244:
243.
(Table: Price Index) Use Table: Price Index. Which year is MOST likely to be the base
year?
A)
2009
B)
2011
C)
2010
D)
2008
244.
(Table: Price Index) What is the inflation rate between 2010 and 2011?
A)
6.8%
B)
4%
C)
7%
D)
6%
Page 51
Use the following to answer question 245:
245.
(Table: CPI II) Use Table: CPI II. Prices _____ between 2010 and 2011.
A)
fell by 5%
B)
fell by 4%
C)
increased by 4%
D)
increased by 5%
Use the following to answer questions 246-253:
246.
(Table: Peanut Butter and Jelly) Use Table: Peanut Butter and Jelly. Suppose a market
basket consists of 20 jars of peanut butter and 10 jars of jelly. What is the value of the
market basket in 2012?
A)
$3
B)
$40
C)
$42
D)
$44.50
247.
(Table: Peanut Butter and Jelly) Use Table: Peanut Butter and Jelly. Suppose a market
basket consists of 20 jars of peanut butter and 10 jars of jelly. What is the value of the
market basket in 2013?
A)
$3.35
B)
$40
C)
$42
D)
$44.50
Page 52
248.
(Table: Peanut Butter and Jelly) Use Table: Peanut Butter and Jelly. Suppose a market
basket consists of 20 jars of peanut butter and 10 jars of jelly. What is the value of the
market basket in 2014?
A)
$62
B)
$49
C)
$42
D)
$44.50
249.
(Table: Peanut Butter and Jelly) Use Table: Peanut Butter and Jelly. Suppose a market
basket consists of 20 jars of peanut butter and 10 jars of jelly. If 2012 is the base year,
what is the value of the price index in 2012?
A)
0
B)
90
C)
100
D)
111.25
250.
(Table: Peanut Butter and Jelly) Use Table: Peanut Butter and Jelly. Suppose a market
basket consists of 20 jars of peanut butter and 10 jars of jelly. If 2012 is the base year,
what is the value of the price index in 2013?
A)
0
B)
90
C)
100
D)
111.25
251.
(Table: Peanut Butter and Jelly) Use Table: Peanut Butter and Jelly. Suppose a market
basket consists of 20 jars of peanut butter and 10 jars of jelly. If 2012 is the base year,
what is the value of the price index in 2014?
A)
122.5
B)
111.25
C)
90
D)
81.6
252.
(Table: Peanut Butter and Jelly) Use Table: Peanut Butter and Jelly. Suppose a market
basket consists of 20 jars of peanut butter and 10 jars of jelly. If 2012 is the base year,
what is the rate of inflation between 2012 and 2013?
A)
4.5%
B)
11.25%
C)
22.5%
D)
44.5%
Page 53
253.
(Table: Peanut Butter and Jelly) Use Table: Peanut Butter and Jelly. Suppose a market
basket consists of 20 jars of peanut butter and 10 jars of jelly. If 2012 is the base year,
what is the rate of inflation between 2013 and 2014?
A)
4.9%
B)
11.25%
C)
22.5%
D)
10.1%
254.
The price index in a given year is the cost of the market basket in that year _____ the
cost of the market basket in the base year times 100.
A)
divided by
B)
times
C)
minus
D)
plus
255.
If the cost of the market basket in the base year is $2,000 and in 2014 it is $2,100, the
price index for 2014 is:
A)
2,100.
B)
105.
C)
100.
D)
95.
256.
The _____ is MOST widely used to measure inflation in the United States.
A)
producer price index
B)
consumer price index
C)
GDP deflator
D)
national income account
257.
The consumer price index reflects:
A)
changes in the prices of goods and services typically purchased by consumers.
B)
the level of prices for intermediate goods and services purchased by businesses.
C)
the level of prices for raw materials.
D)
the prices of all goods and services computed from the ratio of nominal GDP to
real GDP.
258.
Which statement regarding the consumer price index is FALSE?
A)
CPI reflects changes in the prices of goods typically purchased by consumers.
B)
CPI contains hundreds of goods and services.
C)
CPI is calculated by the Bureau of Labor Statistics.
D)
CPI changes only in the base year, every five to seven years.
Page 54
259.
Approximately how many prices are used to calculate the consumer price index each
month?
A)
9
B)
1,000
C)
80,000
D)
1 million
260.
Which factor is a measure of changes in the cost of a market basket of raw commodities,
such as steel, electricity, and coal?
A)
the GDP deflator
B)
the Dow Jones Industrial Average
C)
the consumer price index
D)
the producer price index
261.
Which measure is likely to reflect an increasing price level the fastest?
A)
the GDP deflator
B)
the Dow Jones Industrial Average
C)
the consumer price index
D)
the producer price index
262.
The GDP deflator for a given year is 100 times _____ GDP for that year _____ GDP for
that year.
A)
nominal; divided by real
B)
real; divided by nominal
C)
nominal; minus real
D)
real; plus nominal
263.
The consumer price index is used to set payments from the U.S. government to
individuals. To the extent that the index is biased upward, this index:
A)
leads to lower benefits.
B)
raises government expenditures.
C)
lowers government expenditures.
D)
leads to lower benefits and raises government expenditures.
264.
Which price index measures the cost of living?
A)
the producer price index
B)
the wholesale price index
C)
the consumer price index
D)
the GDP deflator
Page 55
265.
The GDP deflator is equal to:
A)
nominal GDP divided by real GDP times 100.
B)
real GDP divided by nominal GDP times 100.
C)
real GDP times nominal GDP times 100.
D)
[(real GDP times nominal GDP) divided by real GDP] times 100.
Use the following to answer questions 266-267:
266.
(Table: GDP II) Use Table: GDP II. Calculate the GDP deflator for 2010.
A)
111
B)
104
C)
90
D)
96
267.
(Table: GDP II) Use Table: GDP II. Calculate the GDP deflator for 2011.
A)
111
B)
104
C)
90
D)
96
268.
Which price index is used to measure changes in the prices that firms pay for goods and
services?
A)
the producer price index
B)
the consumer price index
C)
the GDP deflator
D)
the cost of living index
Page 56
269.
Which statement about the producer price index is TRUE?
A)
The producer price index is just another term for the GDP deflator.
B)
Changes in the producer price index generally follow changes in the consumer
price index.
C)
The producer price index measures the cost of a basket of goods typically
purchased by producers.
D)
The producer price index shows how the cost of all purchases by urban families
changes.
270.
The major difference between the producer price index and the consumer price index is
that the producer price index _____ and the consumer price index _____.
A)
is based on retail prices; is based on wholesale prices
B)
measures the cost of living of self-employed workers; measures the cost of living
of salaried workers
C)
generally registers a higher rate of inflation; generally registers a lower rate of
inflation
D)
is based on the cost of a basket typically purchased by producers; is based on the
cost of a basket typically purchased by consumers
271.
The producer price index is often regarded as a warning sign of inflation because:
A)
prices of inputs will ultimately be reflected in prices of final products.
B)
producers are likely to have monopoly control over prices.
C)
consumers have to pay the prices charged.
D)
commodity producers can sell whatever they want at higher prices.
272.
The purpose of indexing Social Security payments to the consumer price index is to:
A)
increase corporate profits.
B)
justify continued government funding of the Bureau of Labor Statistics.
C)
avoid the privatization of Social Security.
D)
maintain the purchasing power of retirees.
273.
Payments to Social Security recipients are indexed to the rate of inflation, as measured
by the consumer price index. This means that, when the rate of inflation increases, the
_____ Social Security recipients _____.
A)
market basket for; increases
B)
market basket for; decreases
C)
payments to; increase
D)
payments to; decrease
Page 57
Use the following to answer questions 274-288:
274.
(Table: Price and Output Data) Use Table: Price and Output Data. The value of year 4’s
output in nominal dollars is:
A)
$6.
B)
$24.
C)
$30.
D)
$36.
275.
(Table: Price and Output Data) Use Table: Price and Output Data. The value of year 2’s
output in real dollars is:
A)
$4.
B)
$12.
C)
$15.
D)
$16.
276.
(Table: Price and Output Data) Use Table: Price and Output Data. The value of year 3’s
output in real dollars is:
A)
$5.
B)
$20.
C)
$27.
D)
$36.
277.
(Table: Price and Output Data) Use Table: Price and Output Data. The value of year 3’s
output in nominal dollars is:
A)
$5.
B)
$5.20.
C)
$20.
D)
$36.
Page 58
278.
(Table: Price and Output Data) Use Table: Price and Output Data. The value of year 4’s
output in real dollars is:
A)
$5.20.
B)
$6.
C)
$30.
D)
$36.
279.
(Table: Price and Output Data) Use Table: Price and Output Data. The price index for
year 2 is:
A)
4.
B)
12.
C)
60.
D)
80.
280.
(Table: Price and Output Data) Use Table: Price and Output Data. The price index for
year 4 is:
A)
80.
B)
120.
C)
0.
D)
6.
281.
(Table: Price and Output Data) Use Table: Price and Output Data. Between years 2 and
3, nominal GDP increased by:
A)
33%.
B)
25%.
C)
67%.
D)
8%.
282.
(Table: Price and Output Data) Use Table: Price and Output Data. Between years 2 and
3, real GDP increased by:
A)
10%.
B)
20%.
C)
30%.
D)
33%.
Page 59
283.
(Table: Price and Output Data) Use Table: Price and Output Data. Between years 2 and
3 the amount of change in nominal GDP due to inflation was:
A)
100%.
B)
34%.
C)
22%.
D)
5%.
284.
(Table: Price and Output Data) Use Table: Price and Output Data. Nominal GDP in year
5 is:
A)
$1.29.
B)
$16.
C)
$45.
D)
$63.
285.
(Table: Price and Output Data) Use Table: Price and Output Data. Real GDP in year 5
is:
A)
$1.29.
B)
$16.
C)
$35.
D)
$63.
286.
(Table: Price and Output Data) Use Table: Price and Output Data. Between years 4 and
5, nominal GDP increased by:
A)
33%.
B)
75%.
C)
50%.
D)
13%.
287.
(Table: Price and Output Data) Use Table: Price and Output Data. Between years 4 and
5, real GDP:
A)
decreased by 14%.
B)
did not change.
C)
increased by 3%.
D)
increased by 17%.
Page 60
288.
(Table: Price and Output Data) Use Table: Price and Output Data. Between years 4 and
5, _____ of the increase in nominal GDP was due to inflation.
A)
none
B)
58%
C)
92%
D)
all
Use the following to answer questions 289-300:
289.
(Table: Real and Nominal Output) Use Table: Real and Nominal Output. Nominal GDP
in year 4 is equal to:
A)
$40.
B)
$60.
C)
$100.
D)
$280.
290.
(Table: Real and Nominal Output) Use Table: Real and Nominal Output. Nominal GDP
in year 2 is equal to:
A)
$40.
B)
$60.
C)
$100.
D)
$280.
291.
(Table: Real and Nominal Output) Use Table: Real and Nominal Output. The year in
which the increase in nominal GDP is exclusively due to the increase in the price level
rather than physical output is year:
A)
2.
B)
3.
C)
4.
D)
6.