Page 41
Use the following to answer questions 157-164:
\\
157.
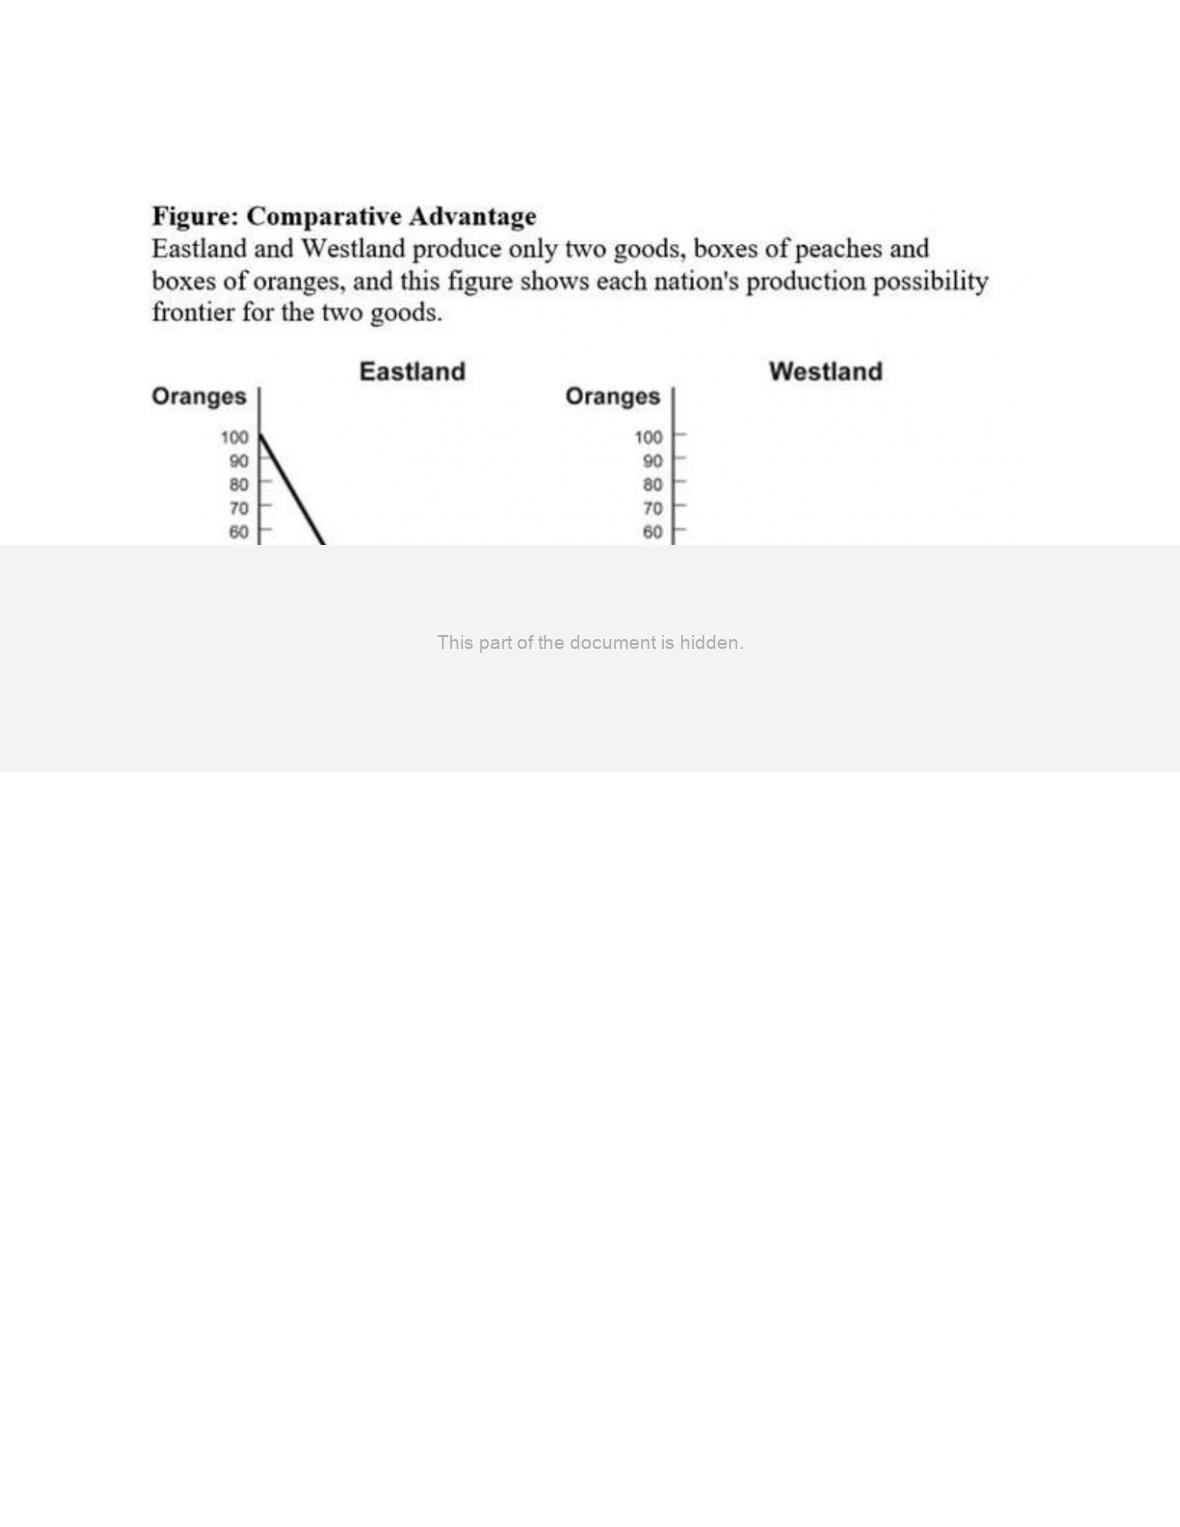
(Figure: Comparative Advantage) Use Figure: Comparative Advantage. Eastland has an
absolute advantage in producing:
A)
oranges only.
B)
peaches only.
C)
both oranges and peaches.
D)
neither oranges nor peaches.
158.
(Figure: Comparative Advantage) Use Figure: Comparative Advantage. Westland has
an absolute advantage in producing:
A)
oranges only.
B)
peaches only.
C)
both oranges and peaches.
D)
neither oranges or peaches.
Page 42
159.
(Figure: Comparative Advantage) Use Figure: Comparative Advantage. The opportunity
cost of producing 1 box of oranges for Eastland is _____ box(es) of peaches.
A)
1
B)
0.25
C)
4
D)
10
160.
(Figure: Comparative Advantage) Use Figure: Comparative Advantage. The opportunity
cost of producing 1 box of oranges for Westland is _____ box(es) of peaches.
A)
1
B)
0.25
C)
4
D)
10
161.
(Figure: Comparative Advantage) Use Figure: Comparative Advantage. The opportunity
cost of producing 1 box of peaches for Eastland is _____ box(es) of oranges.
A)
1
B)
0.25
C)
4
D)
10
162.
(Figure: Comparative Advantage) Use Figure: Comparative Advantage. The opportunity
cost of producing 1 box of peaches for Westland is _____ box(es) of oranges.
A)
1
B)
0.25
C)
4
D)
10
163.
(Figure: Comparative Advantage) Use Figure: Comparative Advantage. Eastland has a
comparative advantage in producing:
A)
oranges only.
B)
peaches only.
C)
both oranges and peaches.
D)
neither oranges nor peaches.

Page 43
164.
(Figure: Comparative Advantage) Use Figure: Comparative Advantage. Westland has a
comparative advantage in producing:
A)
oranges only.
B)
peaches only.
C)
both oranges and peaches.
D)
neither oranges nor peaches.
165.
Which statement is TRUE?
A)
Very talented people may have a comparative advantage in everything they do.
B)
Very untalented people have a comparative advantage in something they do.
C)
Very talented people may have a low opportunity cost in most things they do.
D)
Very untalented people may have a high opportunity cost in most things they do.
166.
In a single day, George can bake 10 cakes and Greta can bake 5 cakes. We know that
_____ has a(n) _____ advantage in baking cakes.
A)
George; comparative
B)
George; absolute
C)
Greta; comparative
D)
Greta; absolute
167.
If they bake only cakes, in a single day George can bake 10 cakes, and Greta can bake 5
cakes. If they make only pies, in a single day George can bake 10 pies, while Greta can
bake 4 pies. We know that _____ has an absolute advantage and a comparative
advantage in making _____.
A)
George; cakes
B)
George; pies
C)
Greta; cakes
D)
Greta; pies
168.
Greta starts using a new baking technique, and she can now do twice as much of
everything. In a single day, Greta can now make 10 cakes or 8 pies, rather than the 5
cakes and 4 pies she could previously bake. Greta’s production possibility frontier has
_____, and her opportunity cost of making pies _____.
A)
shifted right; is unchanged
B)
shifted right; has decreased
C)
not changed; has increased
D)
not changed; has decreased

Page 44
169.
Coworkers Yvonne and Rodney are washing dishes and sweeping the floors of the store.
They know that to finish both tasks as quickly as possible, each of them should focus on
just one task, but they don’t know who should do what. Yvonne and Rodney should
determine which one:
A)
has the absolute advantage in both sweeping and dishwashing.
B)
has the comparative advantage in dishwashing.
C)
has the production possibility frontier that is farthest from the origin in
dishwashing.
D)
can wash the dishes faster.
170.
To achieve gains from trade, each nation should specialize in the production of a good
or service if:
A)
its production possibility frontier is farther from the origin than that of any other
country.
B)
its production possibility frontier is closer to the origin than that of any other
country.
C)
the country can make that good or service using fewer resources than any other
country.
D)
the country can make that good or service while forgoing the production of fewer
alternative products than any other country.
171.
Dr. Colgate is a dentist who employs an assistant, Ms. Crest. If Dr. Colgate worked all
day at the front desk, she could answer 40 phone calls. If she worked all day with
patients, she could clean the teeth of 40 patients. If Ms. Crest worked all day at the front
desk, she could answer 60 phone calls. If she worked all day with patients, she could
clean the teeth of 20 patients. _____ has a(n) _____ advantage in _____.
A)
Dr. Colgate; absolute; answering phones
B)
Ms. Crest; comparative; answering phones
C)
Ms. Crest; absolute; cleaning patients’ teeth
D)
Dr. Colgate; comparative; answering phones
Page 45
Use the following to answer questions 172-173:
\\
172.
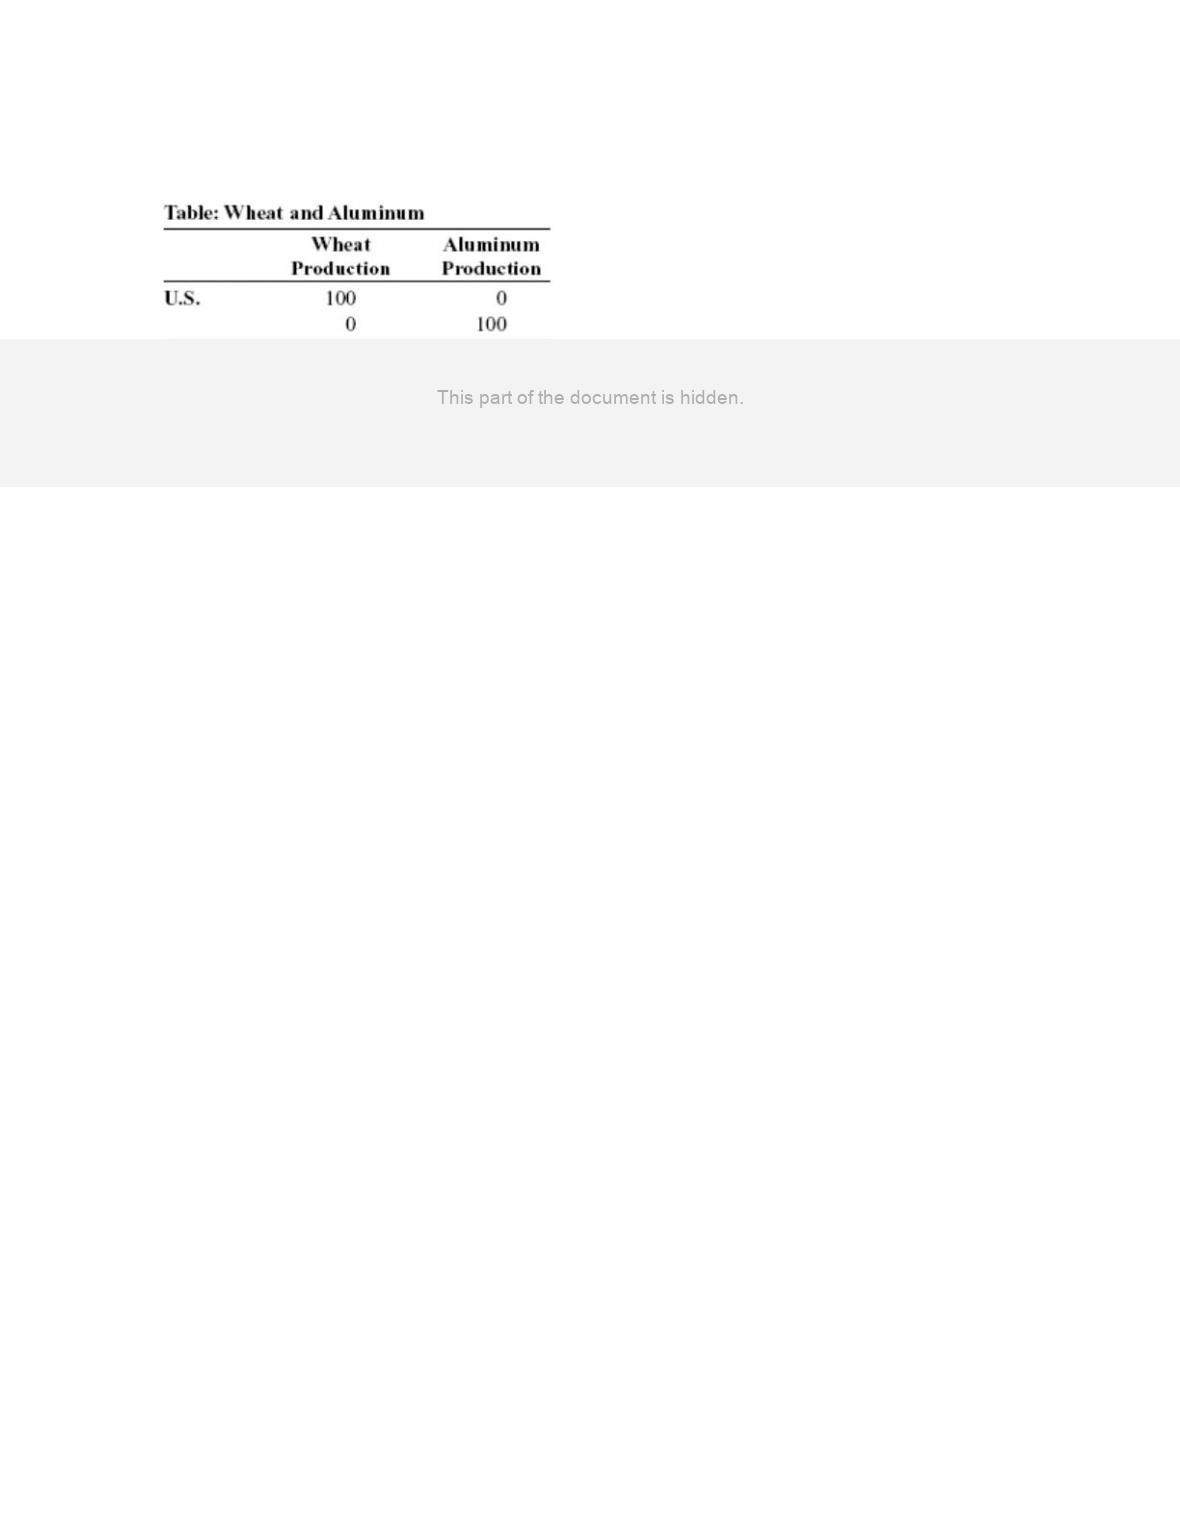
(Table: Wheat and Aluminum) Use Table: Wheat and Aluminum. The United States and
Germany can produce both wheat and aluminum. The table shows, in tonnage, the
maximum annual output combinations of wheat and aluminum that can be produced.
Which choice represents a possible trade based on specialization and comparative
advantage?
A)
Germany would trade 2 tons of wheat to the United States for 1 ton of aluminum.
B)
Germany would trade 2 tons of aluminum to the United States for 0.5 ton of wheat.
C)
The United States would trade 1 ton of wheat to Germany for 1 ton of aluminum.
D)
The United States would trade 1 ton of wheat to Germany for 1.5 tons of
aluminum.
173.
(Table: Wheat and Aluminum) Use Table: Wheat and Aluminum. The United States and
Germany can produce both wheat and aluminum. The table shows the maximum annual
output combinations of wheat and aluminum that can be produced. Based on the table:
A)
the United States has a comparative advantage in wheat and an absolute advantage
in wheat.
B)
Germany has an absolute advantage in aluminum and a comparative advantage in
wheat.
C)
the United States has a comparative advantage in both aluminum and wheat.
D)
Germany has a comparative advantage in aluminum and an absolute advantage in
aluminum.
Page 46
174.
In one day, Kessy can bake 10 cookies or mix 15 glasses of lemonade. His friend Ava
can make 10 cookies or 10 glasses of lemonade. His other friend, Ian, can make 10
cookies or 20 glasses of lemonade. Who has the LOWEST opportunity cost in cookie
production?
A)
Kessy
B)
Ava
C)
Ian
D)
Kessy and Ava have the same opportunity cost in cookie production.
175.
Because Casey can type reports faster and more accurately than Ahmet, Casey has a(n)
_____ in typing reports.
A)
comparative advantage
B)
absolute advantage
C)
opportunity cost
D)
specialization
176.
Mark and Julie are going to sell brownies and cookies for their third annual fundraiser
bake sale. In one day, Mark can make 40 brownies or 20 cookies, and Julie can make 15
brownies or 15 cookies. Based on this information, _____ has the comparative
advantage in making brownies and _____ has the comparative advantage in making
cookies.
A)
Mark; Julie
B)
Mark; Mark
C)
Julie; Mark
D)
Julie; Julie
177.
Mark and Julie are going to sell brownies and cookies for their third annual fundraiser
bake sale. In one day, Mark can make 40 brownies or 20 cookies, and Julie can make 15
brownies or 15 cookies. What is Mark’s opportunity cost to produce one brownie?
A)
1 cookie
B)
1 brownie
C)
0.5 cookie
D)
0.5 brownie
Page 47
178.
Mark and Julie are going to sell brownies and cookies for their third annual fundraiser
bake sale. In one day, Mark can make 40 brownies or 20 cookies, and Julie can make 15
brownies or 15 cookies. With specialization, _____ brownies and _____ cookies will be
made in one day.
A)
15; 20
B)
40; 20
C)
40; 15
D)
55; 35
179.
Mark and Julie are going to sell brownies and cookies for their third annual fundraiser
bake sale. In one day, Mark can make 40 brownies or 20 cookies, and Julie can make 15
brownies or 15 cookies. Based on this information, _____ has the absolute advantage in
making brownies and _____ has the absolute advantage in making cookies.
A)
Mark; Julie
B)
Mark; Mark
C)
Julie; Mark
D)
Mark; neither Mark nor Julie
Use the following to answer questions 180-181:
\\
180.
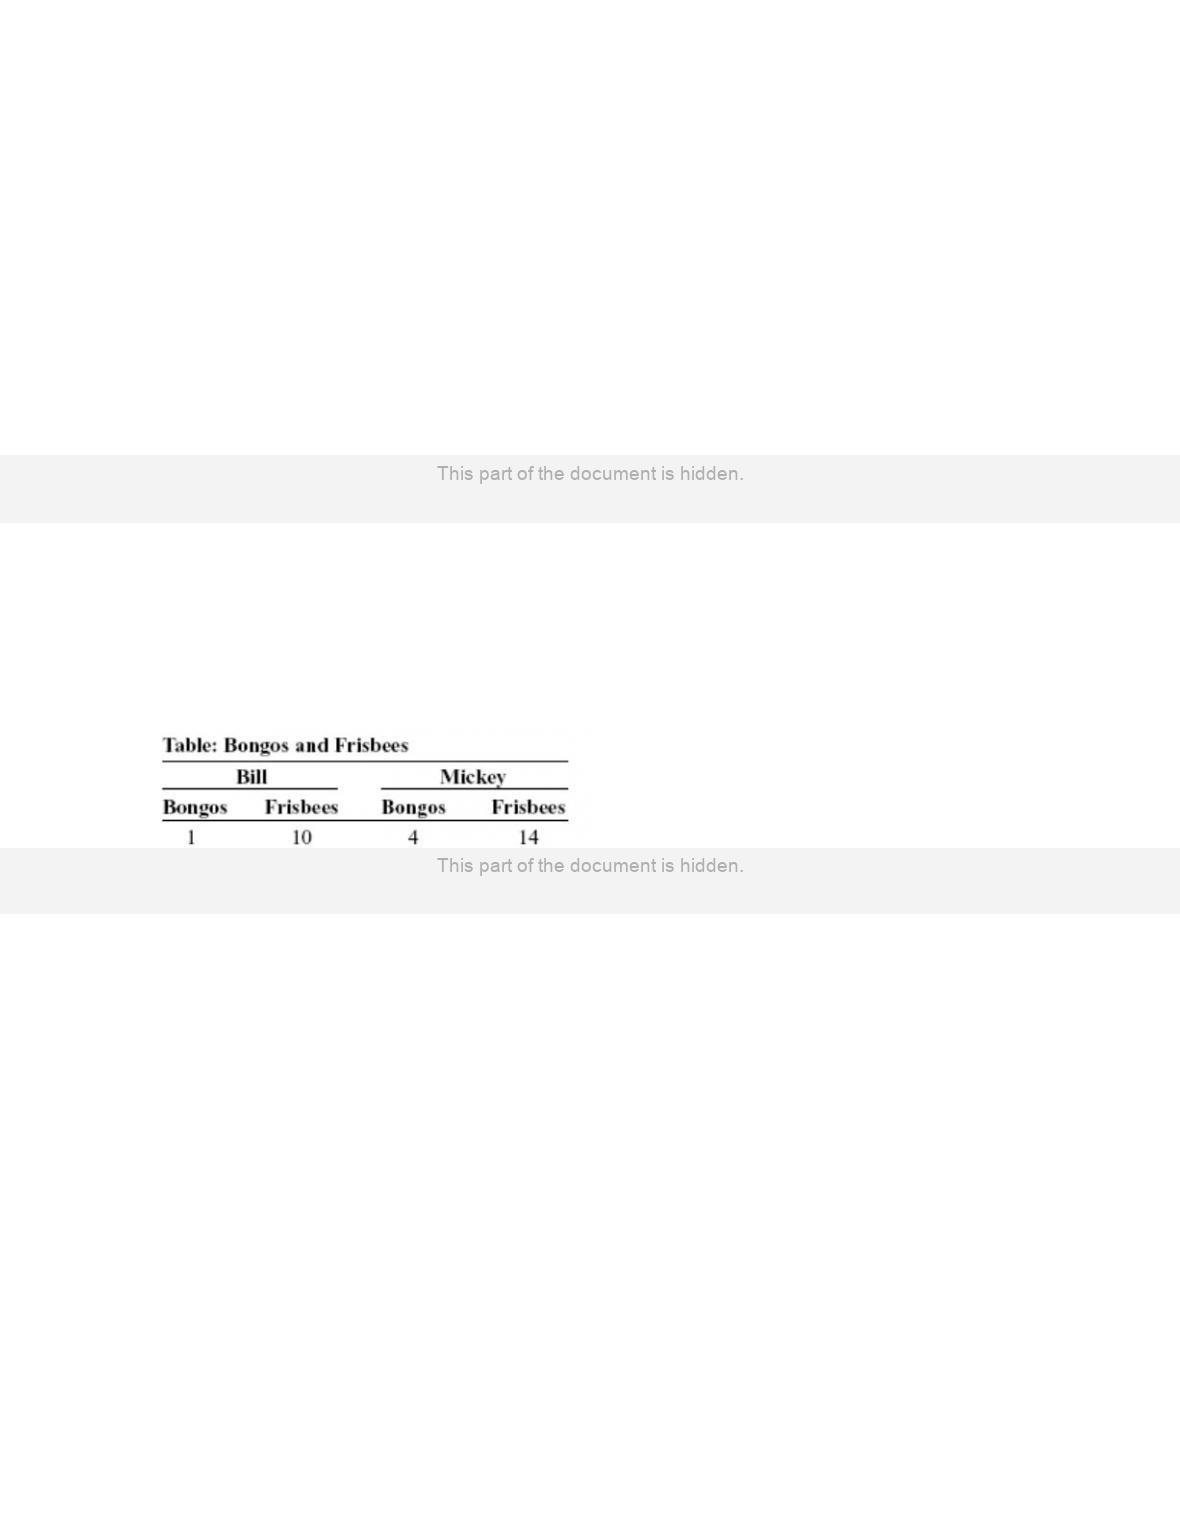
(Table: Bongos and Frisbees) Use Table: Bongos and Frisbees. Bill and Mickey make
bongos and Frisbees. Who has the comparative advantage in producing Frisbees?
A)
Bill
B)
Mickey
C)
both
D)
neither
181.
(Table: Bongos and Frisbees) Use Table: Bongos and Frisbees. Bill and Mickey make
bongos and Frisbees. Who should specialize in the production of bongos?
A)
Bill
B)
Mickey
C)
both
D)
neither

Page 48
182.
If the opportunity cost of manufacturing automobiles is lower in the United States than
in Britain and the opportunity cost of manufacturing airplanes is higher in the United
States than in Britain, then the United States will:
A)
export both airplanes and automobiles to Britain.
B)
import both airplanes and automobiles from Britain.
C)
export airplanes to Britain and import automobiles from Britain.
D)
import airplanes from Britain and export automobiles to Britain.
183.
If the opportunity cost of manufacturing automobiles is higher in the United States than
in Britain and the opportunity cost of manufacturing airplanes is lower in the United
States than in Britain, then the United States will:
A)
export both airplanes and automobiles to Britain.
B)
import both airplanes and automobiles from Britain.
C)
export airplanes to Britain and import automobiles from Britain.
D)
import airplanes from Britain and export automobiles to Britain.
184.
Assume that Colombia gives up three motorcycles for each ton of coffee it produces,
while Bolivia gives up seven motorcycles for each ton of coffee it produces. Colombia
has a comparative advantage in _____ production and should specialize in _____.
A)
motorcycle; coffee
B)
coffee; motorcycles
C)
coffee; coffee
D)
motorcycle; motorcycles
185.
Economists are generally in support of:
A)
government restrictions on trade.
B)
free international trade.
C)
tariffs to restrict trade.
D)
subsidizing exports.
186.
Trade takes the form of _____ when people directly exchange goods they have for
goods they want.
A)
exploitation
B)
benevolence
C)
barter
D)
a zero-sum game
Page 49
187.
The simplest circular-flow model shows the interaction between households and firms.
In this model:
A)
only barter transactions take place.
B)
households and firms interact in the market for goods and services, but firms are
the only participants in the factor markets.
C)
firms supply goods and services to households, which in turn supply factors of
production to firms.
D)
attention is focused on real flows of goods, services, and factors of production, but
money flows between households and firms are ignored for simplicity.
188.
A high-school graduate who gets a college degree is adding to the economy’s stock of:
A)
labor.
B)
capital.
C)
human capital.
D)
financial capital.
Use the following to answer questions 189-192:
\\

Page 50
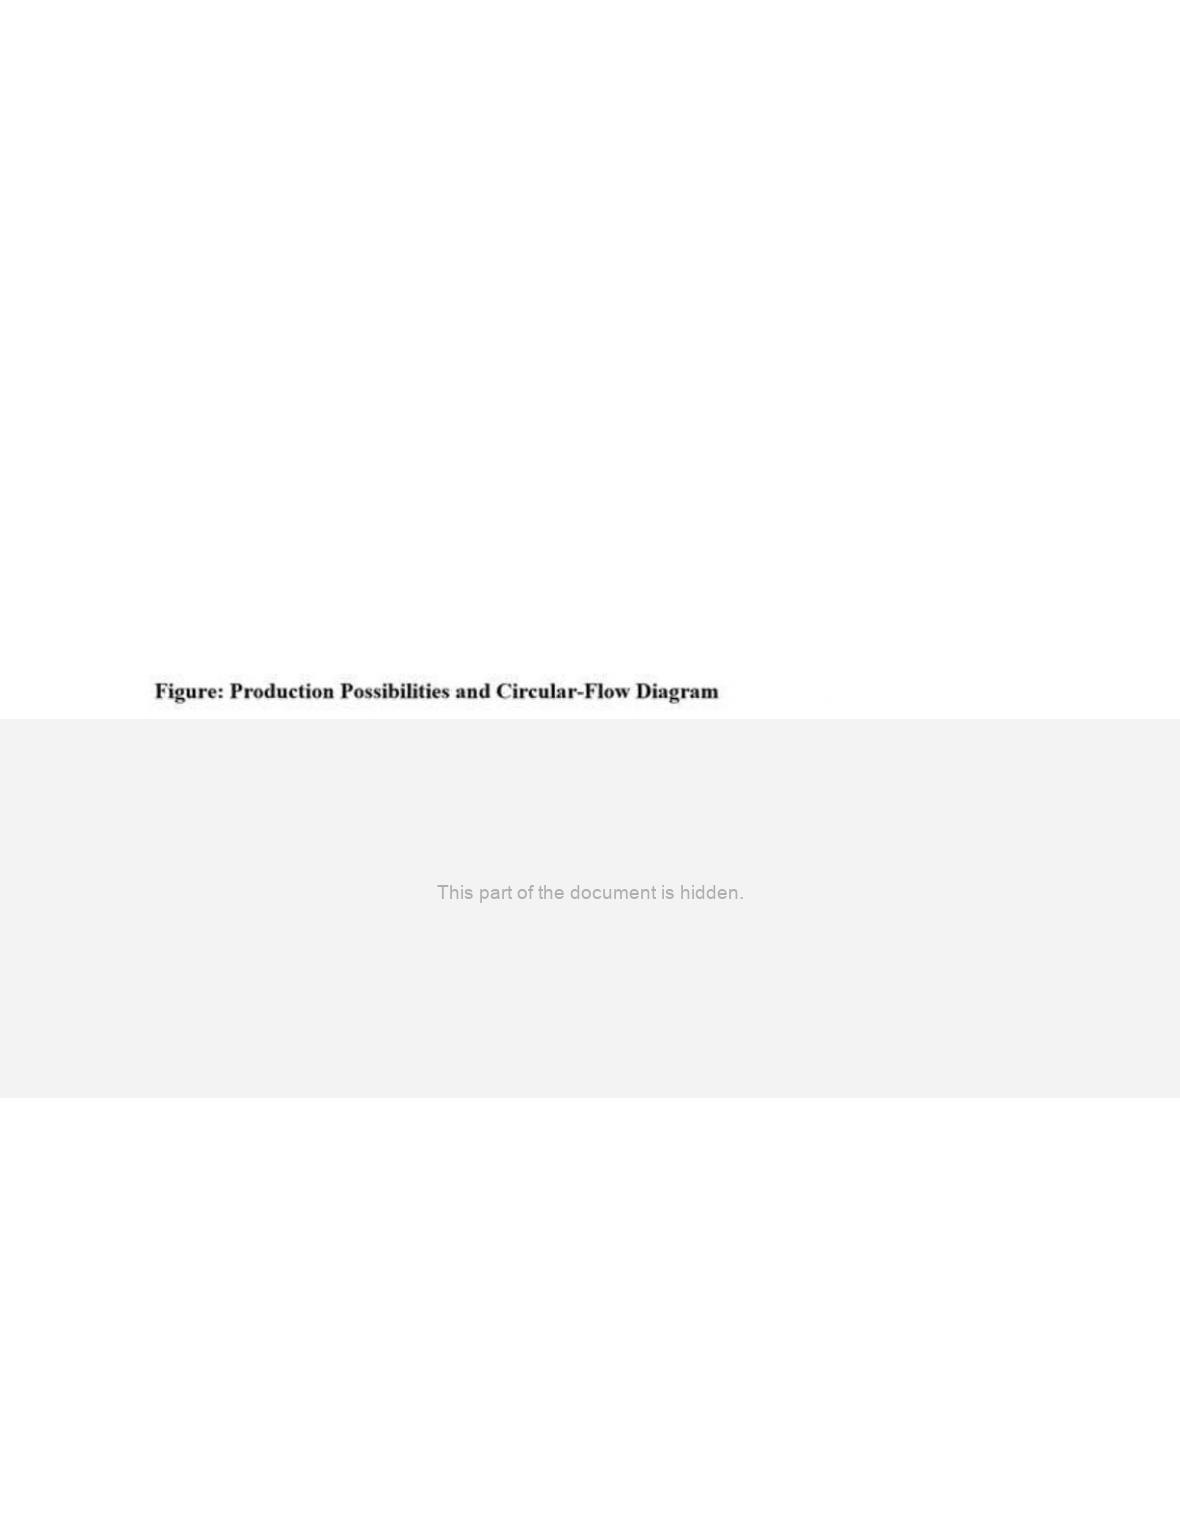
189.
(Figure: Production Possibilities and Circular-Flow Diagram) Use Figure: Production
Possibilities and Circular-Flow Diagram. Assume the two figures represent the same
economy. Suppose that in the circular-flow diagram there is a significant decrease in the
amount of labor flowing to the firms that produce coconuts. If all other variables remain
unchanged, this adjustment in the economy would be BEST represented in the
production possibilities figure by a move from point A toward:
A)
point A (no movement).
B)
point B (a decrease in coconut production and an increase in fish production).
C)
point C (a decrease in coconut production).
D)
point D (an outward shift of the entire curve).
190.
(Figure: Production Possibilities and Circular-Flow Diagram) Use Figure: Production
Possibilities and Circular-Flow Diagram. Assume the two figures represent the same
economy. Suppose that in the circular-flow diagram capital that used to flow to firms
producing coconuts now flows to firms producing fish. This adjustment in the economy
would be BEST represented in the production possibilities figure by a move from point
A toward:
A)
point A (no movement).
B)
point B (a decrease in coconut production and an increase in fish production).
C)
point C (a decrease in coconut production).
D)
point D (an outward shift of the entire curve).
191.
(Figure: Production Possibilities and Circular-Flow Diagram) Use Figure: Production
Possibilities and Circular-Flow Diagram. Assume the two figures represent the same
economy. Suppose that in the circular-flow diagram there is a significant increase in the
amount of human capital flowing to both coconut producers and fish producers. If all
other variables remain unchanged, then the adjustment in this economy would be BEST
represented in the production possibilities figure by a movement from point A toward:
A)
point A (no movement).
B)
point B (a decrease in coconut production and an increase in fish production).
C)
point C (a decrease in coconut production).
D)
point D (an outward shift of the entire curve).
Page 51
192.
(Figure: Production Possibilities and Circular-Flow Diagram) Use Figure: Production
Possibilities and Circular-Flow Diagram. Assume the two figures represent the same
economy. Suppose that in the circular-flow diagram most firms undergo a significant
increase in productivity. This results in a significant increase in the output of both
coconuts and fish. If all other variables remain unchanged, then the adjustment in this
economy would be BEST represented in the production possibilities figure by a
movement from point A toward:
A)
point A (no movement).
B)
point B (a decrease in coconut production and an increase in fish production).
C)
point C (a decrease in coconut production).
D)
point D (an outward shift of the entire curve).
193.
If LeRoyce trades two cookies for one of Amir’s brownies, we say that they are
engaging in:
A)
exploitation.
B)
benevolence.
C)
barter.
D)
a zero-sum game.
194.
Which statement is FALSE about the circular-flow diagram?
A)
Households are the primary demanders of goods and services.
B)
Firms are the primary suppliers of goods and services.
C)
Money flows from households to firms as households offer factors of production
for sale.
D)
Money flows in the direction opposite to goods and services and factors of
production.
195.
Which item is NOT a factor of production?
A)
labor
B)
machines and buildings
C)
land
D)
money
196.
The circular-flow diagram illustrates how households _____ goods and services and
_____ factors of production.
A)
buy; sell
B)
buy; buy
C)
own; buy
D)
own; sell

Page 52
197.
The circular-flow diagram illustrates how firms _____ goods and services and _____
factors of production.
A)
buy; sell
B)
buy; buy
C)
sell; buy
D)
sell; sell
198.
In the simplest circular-flow model, households supply _____ and demand _____.
A)
capital; barter
B)
wages and income; capital markets
C)
factors of production; goods and services
D)
firms; markets
199.
The circular-flow diagram represents the market for _____ and the market for _____.
A)
goods and services; factors of production
B)
households; firms
C)
money; goods and services
D)
factors of production; money
200.
The circular-flow diagram shows the flow of _____, the flow of _____, and the flow
of_______.
A)
goods and services; factors of production; and markets
B)
households; firms; money
C)
money; goods and services; factors of production.
D)
factors of production; money; households.
201.
The circular-flow diagram shows how:
A)
banks receive deposits and create money.
B)
money, goods and services, and factors of production flow through the economy.
C)
the various levels of government allocate tax revenues to meet the needs of society.
D)
the work force is educated and trained to increase labor productivity.
202.
The basis of the circular-flow diagram is that:
A)
the best models avoid making assumptions.
B)
goods and services flow in a circle in the factor market.
C)
resources are sold along with goods and services in the resource market.
D)
the flow of money into each market or sector is equal to the flow of money coming
out of that market or sector.
Page 53
203.
In the circular-flow diagram, the flow of money going into each sector or market is
_____ the flow of money coming out of that market or sector.
A)
equal to
B)
greater than
C)
less than
D)
unrelated to
204.
In the circular-flow diagram, an individual or a group of people (usually a family) who
share their income is a(n):
A)
market.
B)
factor.
C)
household.
D)
business.
205.
In the circular-flow diagram, a household is a(n):
A)
entity that sells goods and services.
B)
individual or group of people who share their income.
C)
entity that purchases factors of production.
D)
member of a group that is prohibited from buying imported goods and services.
206.
In the circular-flow diagram, an organization that produces goods or services for sale is
a:
A)
market.
B)
household.
C)
factor.
D)
firm.
207.
In the circular-flow diagram, a firm is an:
A)
organization that produces goods or services for sale.
B)
individual or a group of people who share their income.
C)
organization that sells factors of production.
D)
organization that purchases goods and services.
208.
In the circular-flow diagram, the product market is where:
A)
firms buy goods and services.
B)
firms buy resources used to produce goods and services.
C)
households buy goods and services.
D)
households buy resources used to produce goods and services.

Page 54
209.
Households buy goods and services in the _____ markets.
A)
factor
B)
product
C)
resource
D)
financial
210.
In the circular-flow diagram, the factor market is where:
A)
households buy factors of production.
B)
households buy goods and services.
C)
businesses buy goods and services.
D)
businesses buy factors of production.
211.
Businesses buy resources used to produce goods and services in the:
A)
factor market.
B)
product market.
C)
market for goods and services.
D)
foreign exchange market.
212.
Jim is being paid $7.25 an hour to work at a restaurant. In the circular flow, this is an
example of a:
A)
business selling goods and services in the product market.
B)
household buying goods and services in the product market.
C)
household buying goods and services in the factor market.
D)
household selling a resource in the factor market.
213.
Jim is being paid $7.25 an hour to work at a restaurant. In the circular flow, this is an
example of a:
A)
business selling goods and services in the product market.
B)
household buying goods and services in the product market.
C)
business buying a resource in the factor market.
D)
household buying a resource in the factor market.
214.
Mary spends $5 on food for her cat. This is an example of a:
A)
business buying goods and services in the product market.
B)
household buying goods and services in the product market.
C)
household buying goods and services in the factor market.
D)
household selling a resource in the factor market.
Page 55
215.
Which of the following is sold in the factor market?
A)
hamburgers
B)
video games
C)
haircuts
D)
labor
216.
Which of the following is sold in the factor market?
A)
hot dogs
B)
bulldozers
C)
nail polish
D)
appendectomies
217.
Which of the following is sold in the product market?
A)
land
B)
labor
C)
cell phones
D)
human capital
218.
Which of the following is sold in the product market?
A)
footballs
B)
labor
C)
physical capital
D)
human capital
219.
In the circular-flow diagram, households buy _____ in the _____ market.
A)
goods and services; product
B)
goods and services; factor
C)
resources; factor
D)
resources; product
220.
In the circular-flow diagram, households receive money for _____ in the _____ market.
A)
producing and selling goods and services; product
B)
selling resources; product
C)
selling resources; factor
D)
selling goods and services; factor

Page 56
221.
In the circular-flow diagram, firms buy _____ in the _____ market.
A)
goods and services; product
B)
goods and services; factor
C)
resources; product
D)
resources; factor
222.
In the circular-flow diagram, firms receive money for _____ in the _____ market.
A)
selling goods and services; product
B)
selling resources; product
C)
selling resources; factor
D)
selling goods and services; factor
223.
Which statement is positive? Which statement is normative?
I. The federal minimum wage in 2016 was $7.25 an hour.
II. The minimum wage should be high enough that families will not live in poverty.
A)
I is positive; II is normative.
B)
I is positive; II is positive.
C)
I is normative; II is positive.
D)
I is normative; II is normative.
224.
Which statement is normative?
A)
Women’s labor force participation rate has increased during the past 100 years.
B)
The federal minimum wage is higher today than it was in 1990.
C)
Children in the United States are required to go to school until they reach a certain
age.
D)
The best way to encourage growth in the economy is through government
spending.
225.
Which statement is normative?
A)
The minimum wage has not kept pace with inflation.
B)
The minimum wage is an important tool in fighting poverty and should be
increased.
C)
The minimum wage can cause higher unemployment for teens and unskilled
workers.
D)
A higher minimum wage is expected to increase the price of a fast-food
cheeseburger.

Page 57
226.
Which statement is normative?
A)
International trade leads to expanded consumption opportunities.
B)
Higher expenditures on health care will reduce infant mortality rates.
C)
To improve our economic security, we should reduce our dependence on oil
imports.
D)
Increased defense spending will lead to higher budget deficits.
227.
Which statement is a positive economic statement?
A)
Government has grown too large and should be reduced.
B)
There has been an increase in the rate of inflation.
C)
Government should be subject to the same rules as all other institutions.
D)
Women should be paid as much as men are for the same work.
228.
Which statement is positive?
A)
The rate of unemployment is 4%.
B)
A high rate of economic growth is the most important economic goal for the
country.
C)
Everyone in the country should be covered by national health insurance.
D)
Baseball players should not be paid higher salaries than is the president of the
United States.
229.
Which statement is positive?
A)
The rate of unemployment should be 4%.
B)
A high rate of economic growth should be a more important economic goal than a
low rate of inflation.
C)
The federal government spends half of its budget on national defense.
D)
Everyone in the country should be covered by national health insurance.
230.
“Unemployment of 5% is too high” is:
A)
a normative statement.
B)
a positive statement.
C)
the circular-flow model.
D)
an example of comparative advantage.
231.
Which statement is normative?
A)
Government has grown too large and should be reduced.
B)
The rate of inflation has increased.
C)
Government is subject to the same rules as all other institutions.
D)
The money supply grew by 3% last year.
Page 58
232.
Which statement is positive?
A)
The poverty rate is 14%.
B)
A high rate of inflation is the most important economic goal for the country.
C)
Everyone in the country should save money for retirement.
D)
Basketball players should not be paid higher salaries than are teachers.
233.
Which statement is positive?
A)
The poverty rate should be 4%.
B)
A high rate of economic growth should be a more important goal for the country
than should a low rate of unemployment.
C)
The federal government pays for 46% of U.S. health care costs.
D)
Everyone in the country should be covered by national health insurance.
234.
Statements that make value judgments are:
A)
pecuniary.
B)
positive.
C)
nominal.
D)
normative.
235.
Which statement is normative?
A)
The rate of unemployment is 9%.
B)
The price of gasoline should be less than $4 per gallon.
C)
The federal government spends half of its budget on national defense.
D)
Millions of Americans lack health insurance.
236.
Which statement is normative?
A)
The rate of unemployment is 9%.
B)
A high rate of economic growth creates jobs.
C)
The federal government spends half of its budget on national defense.
D)
Everyone in the United States deserves to be covered by national health insurance.
237.
“The current unemployment rate of 9% is too high” is a _____ statement.
A)
normative
B)
ceteris paribus
C)
positive
D)
marginal
Page 59
238.
“The rate of unemployment is 9%.” This statement:
A)
is positive.
B)
is normative.
C)
involves a value judgment.
D)
is a personal reflection and has no value in economics.
239.
Unemployment decreased to its lowest level in 10 years last month. This statement is
a(n):
A)
example of an opportunity cost.
B)
positive economic statement.
C)
normative economic statement.
D)
value judgment.
240.
A statement that the minimum wage should be increased is a:
A)
positive statement.
B)
normative statement.
C)
ceteris paribus assumption.
D)
scientific conclusion based on marginal analysis.
241.
A normative statement deals with:
A)
the facts.
B)
what was, is, or will be.
C)
what ought to be.
D)
the scientific method.
242.
Which office of the U.S. government is a major employer of economists?
A)
the International Monetary Fund
B)
the United Nations
C)
the World Bank
D)
the Bureau of Labor Statistics
243.
Economists who are asked to choose between two government policies may disagree
because:
A)
they make the same value judgments about the desirability of the policies.
B)
they base their conclusions on models that make different assumptions.
C)
as a matter of course, economists often take opposing points of view so that all
sides of a question may be discussed.
D)
economists are trained ignore facts and focus on theory.
Page 60
244.
Economists may disagree about policies because they:
A)
approach the issue using the same sets of values.
B)
use different economic models.
C)
enjoy disagreeing with each other.
D)
only consider issues in positive economics.
245.
Economic models that make unrealistic assumptions may be useful in analyzing some
economic problems.
A)
True
B)
False
246.
It is impossible for economists to use computers to simulate how the economy works.
A)
True
B)
False
247.
In building models, economists avoid making any assumptions that might leave out any
aspect of reality.
A)
True
B)
False
248.
In building models, economists often assume that opportunity costs don’t matter.
A)
True
B)
False
249.
The assumption ceteris paribus in a model means “other things equal.”
A)
True
B)
False
250.
Because models make simplifying assumptions, they are of very little use in the real
world.
A)
True
B)
False
251.
An economic model is a simplified version of reality that is used to analyze real-world
economic situations.
A)
True
B)
False