Page 1
Name: __________________________ Date: _____________
1.
A simplified representation that is used to study a real situation is called a(n):
A)
model.
B)
production possibility frontier.
C)
assumption.
D)
trade-off.
2.
The models that economists construct:
A)
usually make simplifying assumptions.
B)
often rely on physical constructs, such as those used by architects.
C)
rarely use mathematical equations or graphs.
D)
attempt to precisely replicate the real world.
3.
When building a model, economists:
A)
simplify reality to highlight what really matters.
B)
attempt to duplicate reality in all of its complexity.
C)
ignore the facts and instead try to determine what the facts should be.
D)
are careful to avoid the scientific method.
4.
The models used in economics:
A)
are always limited to variables that are directly related.
B)
are essentially not reliable because they are not testable in the real world.
C)
are of necessity unrealistic and not related to the real world.
D)
emphasize basic relationships by abstracting from complexities in the everyday
world.
5.
Economic models are:
A)
set up and used to precisely mirror reality.
B)
useless if they are simple.
C)
made generally of wood, plastic, and/or metal.
D)
potentially useful in forming economic policy.
6.
The importance of an economic model is that it allows us to:
A)
build a complex and accurate model of how the economy should work.
B)
build an accurate mathematical model of every aspect of the economy.
C)
focus on the effects of only one change at a time.
D)
avoid opportunity costs.

Page 2
7.
In constructing a model, economists:
A)
might use a computer simulation.
B)
avoid making any assumptions.
C)
assume that all relevant factors are constantly changing.
D)
are prohibited from using mathematics.
8.
A simplified version of reality that is used to clarify economic situations is called a(n):
A)
economic fact.
B)
current event.
C)
model.
D)
scarce resource.
9.
An economic model:
A)
is useful for explaining past economic conditions but not for predicting future
outcomes.
B)
often leads to faulty conclusions because of the ceteris paribus assumption.
C)
allows nothing to change in the economic situation that is being described.
D)
is a simplified version of reality used to understand real-world economic
conditions.
10.
The financial meltdown of 2008–2009:
A)
was accurately predicted by an economic model.
B)
was due to excessive investment in Internet companies.
C)
was the result of the breakup of the European Union.
D)
resulted partially from a faulty economic model.
11.
A mortgage-backed security is an asset that:
A)
only homeowners are allowed to purchase.
B)
provides earnings to its owner based on payments made by people on their home
loans.
C)
the Federal Reserve uses to implement monetary policy.
D)
is an important part of the circular-flow diagram.
12.
Before 2000, the mortgage-backed securities market was relatively small because:
A)
economic models predicted that they were bad investments.
B)
they were illegal in many states.
C)
the complexity of these securities made them hard to price properly.
D)
it was difficult to obtain the foreign currencies that were required for purchasing
them.
Page 3
13.
The financial crisis of 2008 showed that:
A)
models can be used in all cases to understand financial assets.
B)
homeowners were able to pay their mortgages reliably.
C)
a faulty economic model can have devastating macroeconomic consequences.
D)
the average price of a house should not increase.
14.
The production possibility frontier illustrates that:
A)
the economy will automatically end up at full employment.
B)
an economy’s productive capacity increases one-for-one with its population.
C)
if all resources of an economy are being used efficiently, more of one good can be
produced only if less of another good is produced.
D)
economic production possibilities have no limit.
Use the following to answer questions 15-20:
\\
15.
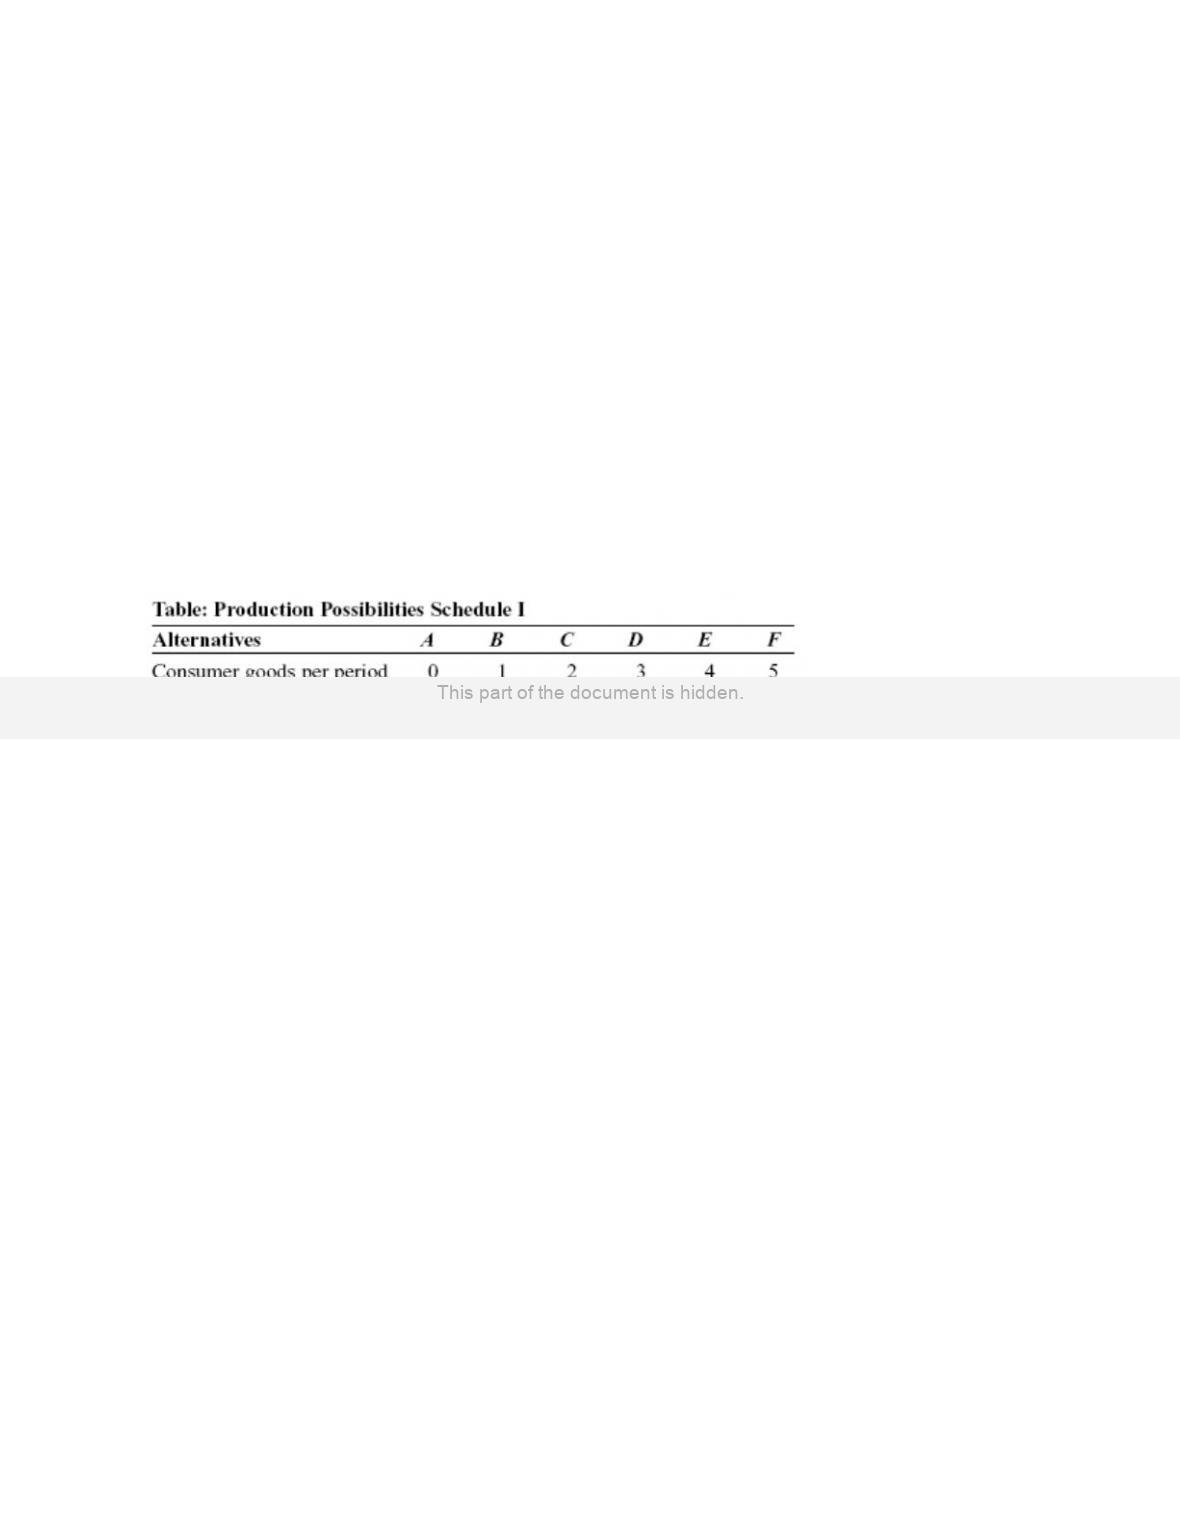
(Table: Production Possibilities Schedule I) Use Table: Production Possibilities
Schedule I. If the economy produces two units of consumer goods per period, it also can
produce, at MOST, _____ units of capital goods per period.
A)
30
B)
28
C)
24
D)
18
16.
(Table: Production Possibilities Schedule I) Use Table: Production Possibilities
Schedule I. If the economy produces 10 units of capital goods per period, it also can
produce, at MOST, _____ units of consumer goods per period.
A)
5
B)
4
C)
3
D)
2
Page 4
17.
(Table: Production Possibilities Schedule I) Use Table: Production Possibilities
Schedule I. The opportunity cost of producing the fourth unit of consumer goods is
_____ units of capital goods.
A)
2
B)
4
C)
6
D)
8
18.
(Table: Production Possibilities Schedule I) Use Table: Production Possibilities
Schedule I. If the economy produces 4 units of consumer goods per period, it also can
produce, at MOST, _____ units of capital goods per period.
A)
30
B)
28
C)
10
D)
18
19.
(Table: Production Possibilities Schedule I) Use Table: Production Possibilities
Schedule I. If the economy produces 24 units of capital goods per period, it also can
produce, at MOST, _____ units of consumer goods per period.
A)
5
B)
4
C)
3
D)
2
20.
(Table: Production Possibilities Schedule I) Use Table: Production Possibilities
Schedule I. The opportunity cost of producing the third unit of consumer goods is _____
units of capital goods.
A)
2
B)
4
C)
6
D)
8
Page 5
Use the following to answer questions 21-25:
\\
21.
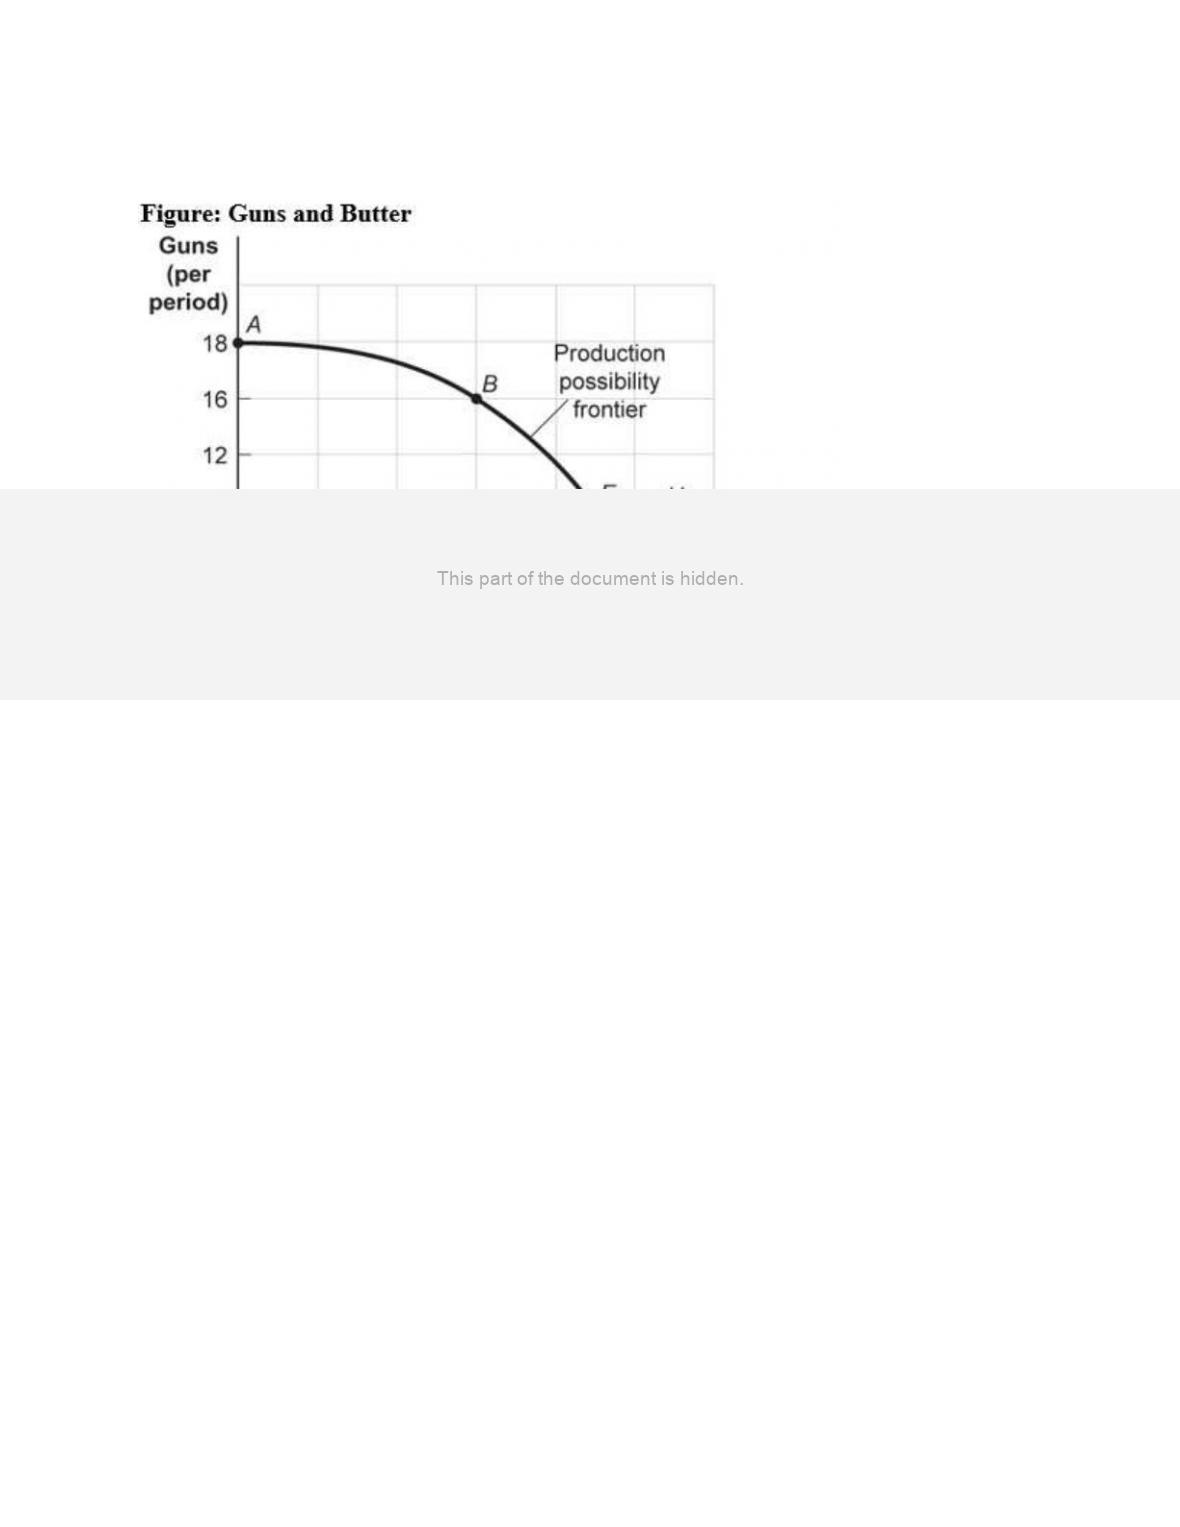
(Figure: Guns and Butter) Use Figure: Guns and Butter. On this figure, points A, B, E,
and F:
A)
indicate combinations of guns and butter that society can produce using all of its
factors efficiently.
B)
indicate increasing opportunity costs for guns but decreasing opportunity costs for
butter.
C)
indicate that society wants butter more than it wants guns.
D)
indicate constant opportunity costs for guns and increasing costs for butter.
22.
(Figure: Guns and Butter) Use Figure: Guns and Butter. This production possibility
frontier is:
A)
bowed out because of increasing opportunity costs.
B)
bowed in because of increasing opportunity costs.
C)
bowed in because of constant costs of guns and butter.
D)
linear because of constant costs.

Page 6
23.
(Figure: Guns and Butter) Use Figure: Guns and Butter. If the economy is operating at
point B, producing 16 guns and 12 pounds of butter per period, a decision to move to
point E and produce 18 pounds of butter:
A)
indicates that you can have more butter and guns simultaneously.
B)
makes it clear that this economy has decreasing opportunity costs.
C)
necessitates a loss of 8 guns per period.
D)
necessitates a loss of 4 guns per period.
24.
(Figure: Guns and Butter) Use Figure: Guns and Butter. The combination of guns and
butter at point H:
A)
can be attained but would cost too much.
B)
cannot be attained, given the level of technology and the factors of production
available.
C)
has no meaning since it does not relate to the preferences of consumers.
D)
is attainable but would increase unemployment.
25.
(Figure: Guns and Butter) Use Figure: Guns and Butter. Suppose the economy produced
8 guns and 12 pounds of butter per period. Given that, which statement is TRUE?
A)
This is a possible choice, but it is inefficient.
B)
This combination invalidates the notion of increasing opportunity cost.
C)
The economy is still efficient but does not buy as much as it could.
D)
Something must be done to reduce the amount of employment.
26.
If an economy has to sacrifice only one unit of good X for each unit of good Y produced
throughout the relevant range, then its production possibility frontier has a(n):
A)
zero slope.
B)
constant negative slope.
C)
increasing negative slope.
D)
decreasing negative slope.
27.
A production possibility frontier that is a straight line sloping down from left to right
suggests that:
A)
more of both goods could be produced moving along the frontier.
B)
the two products must have the same price.
C)
the opportunity costs of the products are constant.
D)
there are no opportunity costs.

Page 7
Use the following to answer questions 28-30:
\\
28.
(Table: Production Possibilities Schedule II) Use Table: Production Possibilities
Schedule II. If the economy is producing at alternative X, the opportunity cost of
producing at Y instead of X is _____ units of consumer goods per period.
A)
0
B)
6
C)
8
D)
14
29.
(Table: Production Possibilities Schedule II) Use Table: Production Possibilities
Schedule II. If an economy is producing at alternative W, the opportunity cost of
producing at X is _____ unit(s) of consumer goods per period.
A)
0
B)
1
C)
4
D)
18
30.
(Table: Production Possibilities Schedule II) Use Table: Production Possibilities
Schedule II. The production of 14 units of consumer goods and 1 unit of capital goods
per period would result in:
A)
full employment.
B)
no unused resources.
C)
some unused or inefficiently used resources.
D)
an increase in economic growth.
31.
In movement along a production possibility frontier, the opportunity cost to society of
getting more of one good:
A)
is always constant.
B)
is measured in dollar terms.
C)
is measured by the amount of the other good that must be given up.
D)
usually decreases.
Page 8
32.
If an economy has to sacrifice increasing amounts of good X for each additional unit of
good Y produced, then its production possibility frontier is:
A)
bowed out.
B)
bowed in.
C)
a straight line.
D)
a vertical line.
33.
The fact that a society’s production possibility frontier is bowed out, or concave to the
origin of a graph, demonstrates the law of _____ opportunity cost.
A)
increasing
B)
decreasing
C)
constant
D)
concave
34.
The economy’s factors of production are not equally suitable for producing different
types of goods. This principle generates:
A)
economic growth.
B)
technical efficiency.
C)
underuse of resources.
D)
the law of increasing opportunity cost.
Use the following to answer questions 35-37:
\\
Page 9
35.
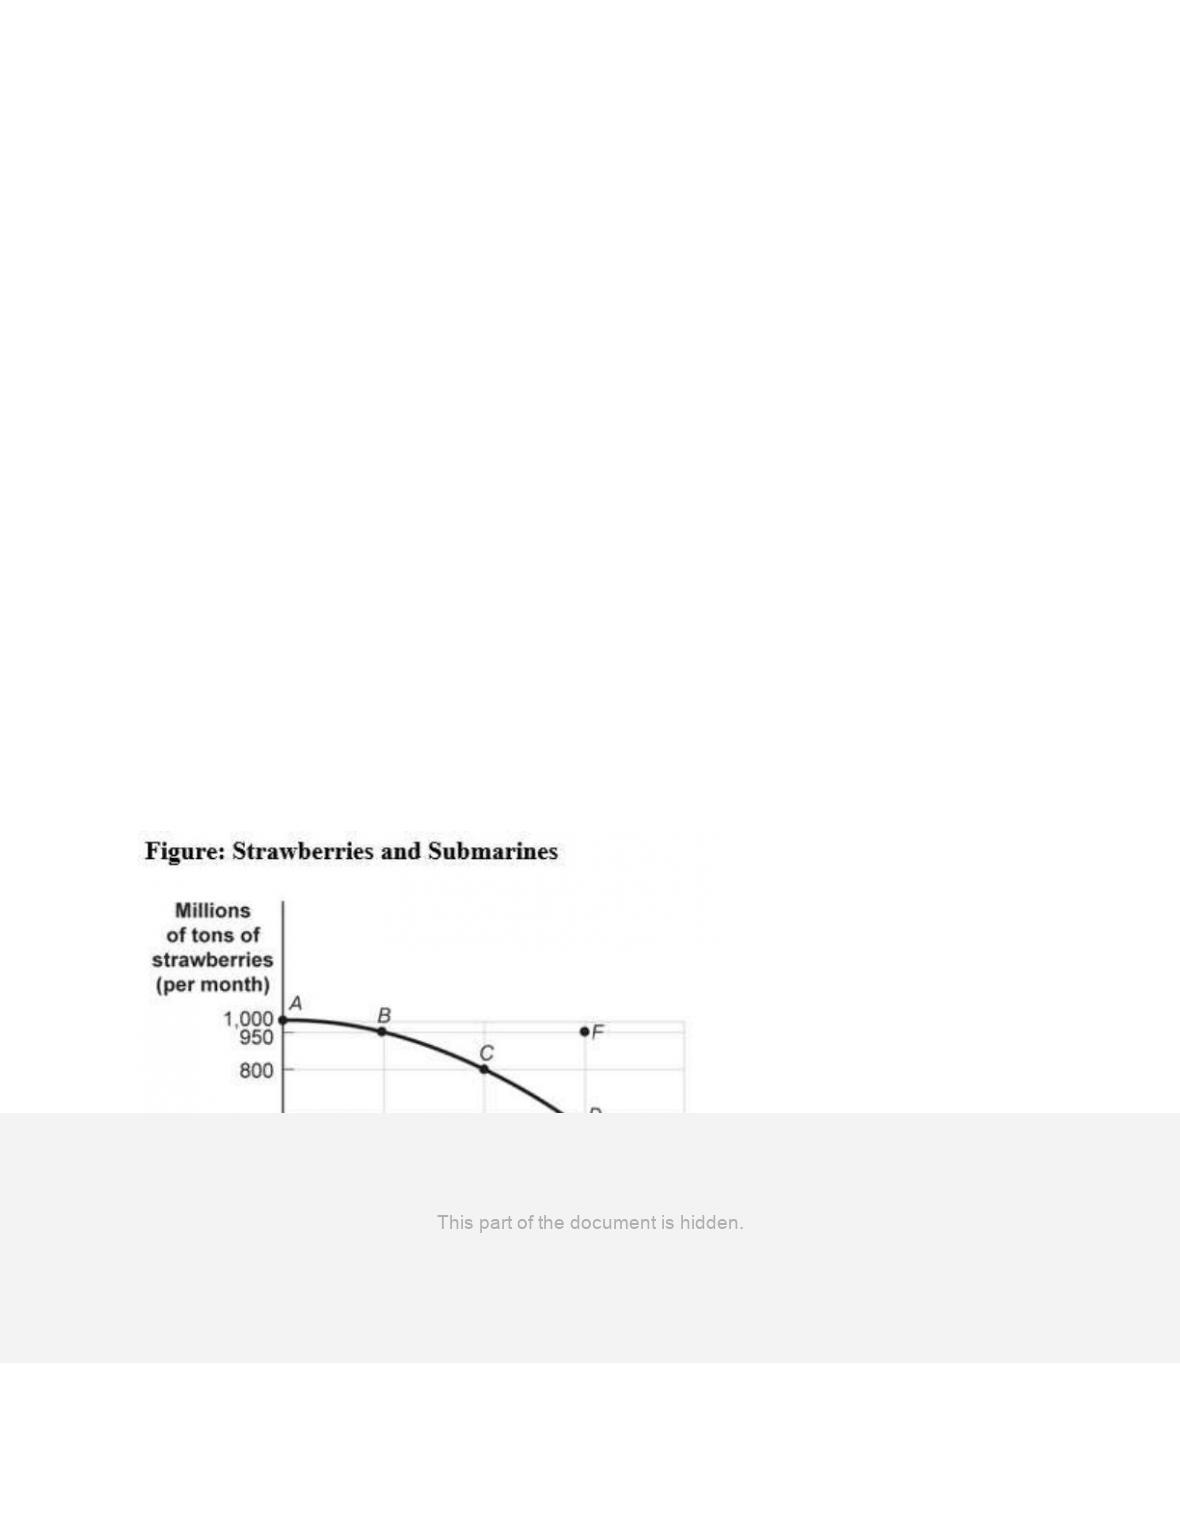
(Figure: Strawberries and Submarines) Use Figure: Strawberries and Submarines.
Suppose the economy is operating at point G. This implies that:
A)
the economy can move to a point such as C only if it improves its technology.
B)
the economy has unemployment and/or inefficiently allocates resources.
C)
the economy lacks the resources to achieve a combination such as C.
D)
people in this economy don’t really like strawberries or submarines.
36.
(Figure: Strawberries and Submarines) Use Figure: Strawberries and Submarines. As
the economy moves from point A toward point D, it will find that the opportunity cost of
each additional submarine:
A)
falls.
B)
rises.
C)
remains unchanged.
D)
doubles.
37.
(Figure: Strawberries and Submarines) Use Figure: Strawberries and Submarines.
Suppose the economy now operates at point C. Moving to point E would require that the
economy:
A)
achieve full employment and an efficient allocation of resources.
B)
eliminate its production of strawberries.
C)
reduce its production of submarines.
D)
improve its technology or increase its quantities of factors of production.
38.
If an economy is producing a level of output that is on its production possibility frontier,
the economy has:
A)
idle resources.
B)
idle resources but is using resources efficiently.
C)
no idle resources but is using resources inefficiently.
D)
no idle resources and is using resources efficiently.
Page 10
Use the following to answer questions 39-40:
\\
39.
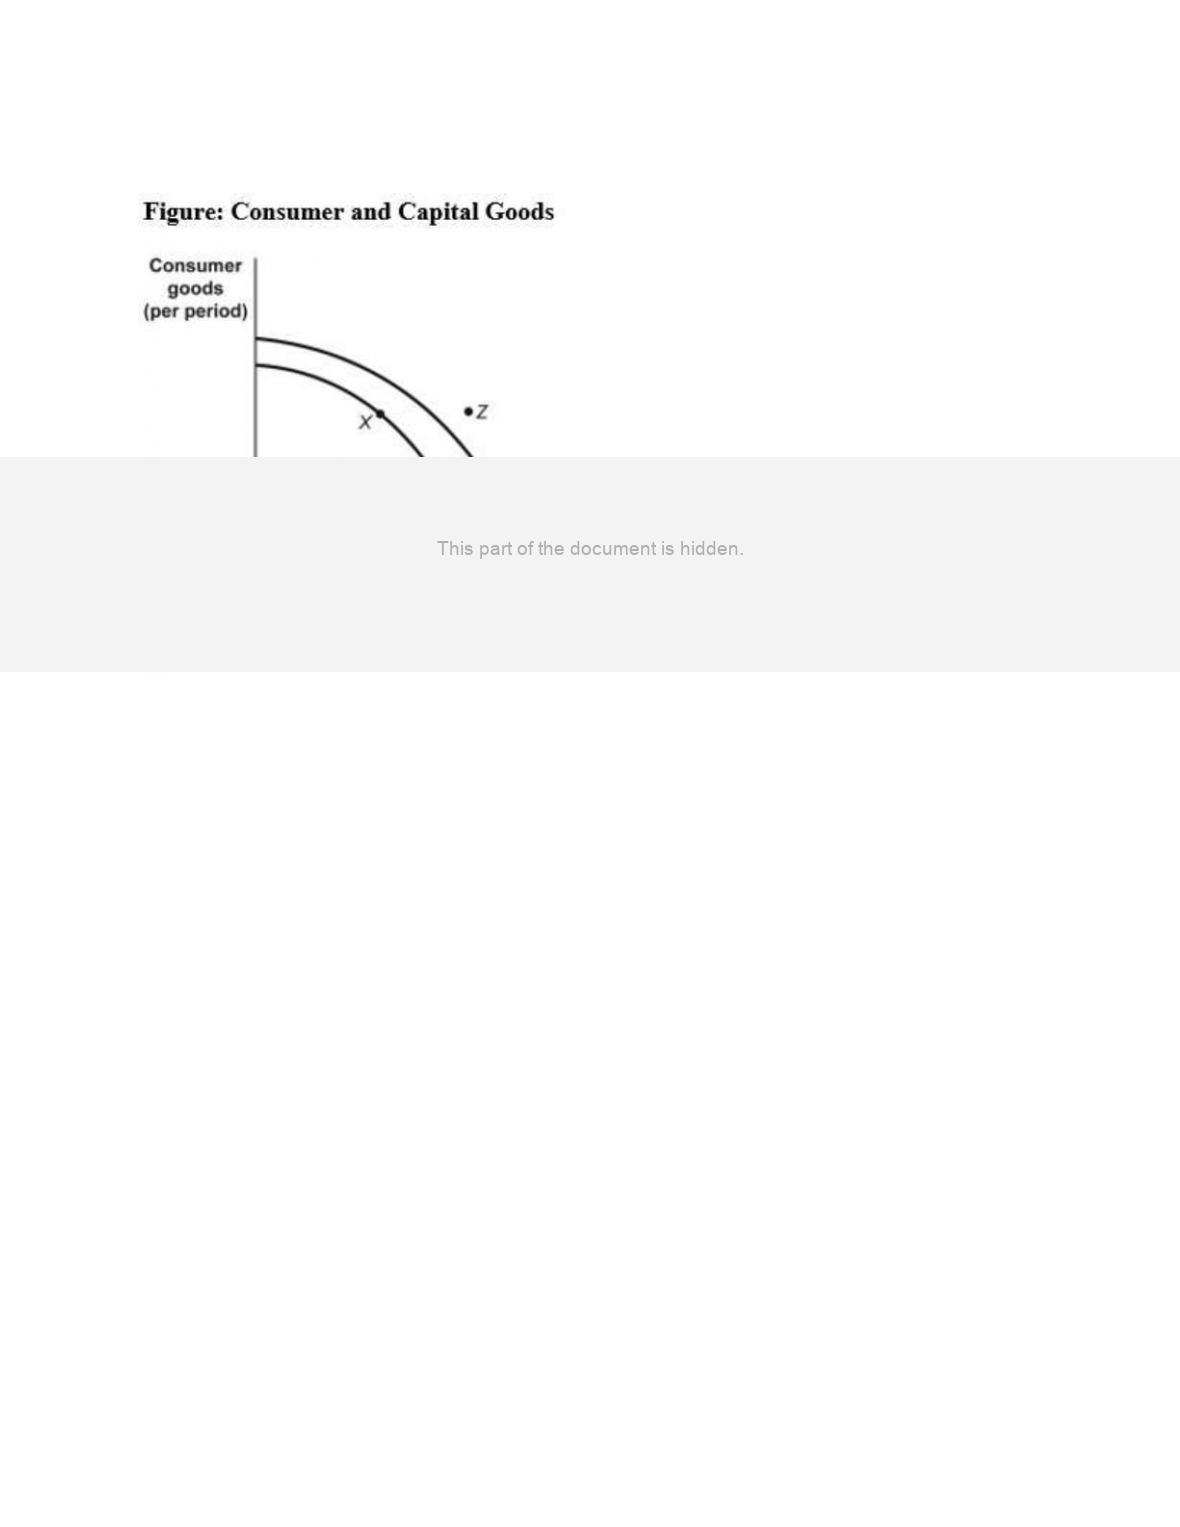
(Figure: Consumer and Capital Goods) Use Figure: Consumer and Capital Goods. The
movement from curve 1 to curve 2 indicates:
A)
economic growth.
B)
a change from unemployment to full employment.
C)
a decrease in the level of technology.
D)
instability.
40.
(Figure: Consumer and Capital Goods) Use Figure: Consumer and Capital Goods.
Assume the economy’s current production possibilities frontier is given by curve 1.
Point Z:
A)
is unattainable, all other things unchanged.
B)
is attainable if the economy is able to reach full employment.
C)
is attainable if the quantity and/or quality of factors decreases.
D)
will be attained as soon as the economy becomes efficient and moves to curve 2.
41.
Technological improvements will:
A)
leave the production possibility frontier unchanged.
B)
shift the production possibility frontier inward.
C)
shift the production possibility frontier outward.
D)
necessarily lead to increased unemployment.
Page 11
42.
A two-dimensional production possibility frontier illustrates the _____ facing an
economy that _____ only two goods.
A)
prices; sells
B)
trade-offs; produces
C)
trade-offs; sells
D)
shortages; produces
43.
Suppose Oklahoma decides to produce only two goods, oil and football helmets. If
Oklahoma is producing on its production possibility frontier, as oil production increases,
the production of football helmets will:
A)
increase.
B)
not change.
C)
decrease at a necessarily decreasing rate.
D)
decrease at some rate.
44.
One of the controversies surrounding the United States’ energy markets is the trade-off
between energy production and clean air. Assuming clean air has value, the United
States will be on its production possibility frontier if and only if:
A)
resources used to produce clean air and energy are not being fully used.
B)
pollution is eliminated.
C)
the price of energy is relatively low.
D)
resources used to produce clean air and energy are being fully used.
45.
If an economy is producing at a point on its production possibilities frontier, it is:
A)
efficient in production and allocation.
B)
efficient in production but not necessarily in allocation.
C)
efficient in allocation but not necessarily in production.
D)
not necessarily efficient in production or allocation.
46.
Consider a production possibility frontier for Italy. If in 2016 Italy’s resources are not
being fully utilized, Italy will be somewhere _____ of its production possibility frontier.
A)
inside
B)
outside
C)
near the bottom
D)
near the top
Page 12
47.
All points inside the production possibility frontier represent:
A)
efficient production points.
B)
inefficient production points.
C)
infeasible production points.
D)
regions of economic growth.
48.
All points on the production possibility frontier are:
A)
efficient.
B)
inefficient.
C)
infeasible.
D)
regions of economic growth.
49.
All points outside the production possibility frontier are:
A)
efficient.
B)
inefficient.
C)
infeasible.
D)
regions of economic growth.
Use the following to answer questions 50-52:
\\
Page 13
50.
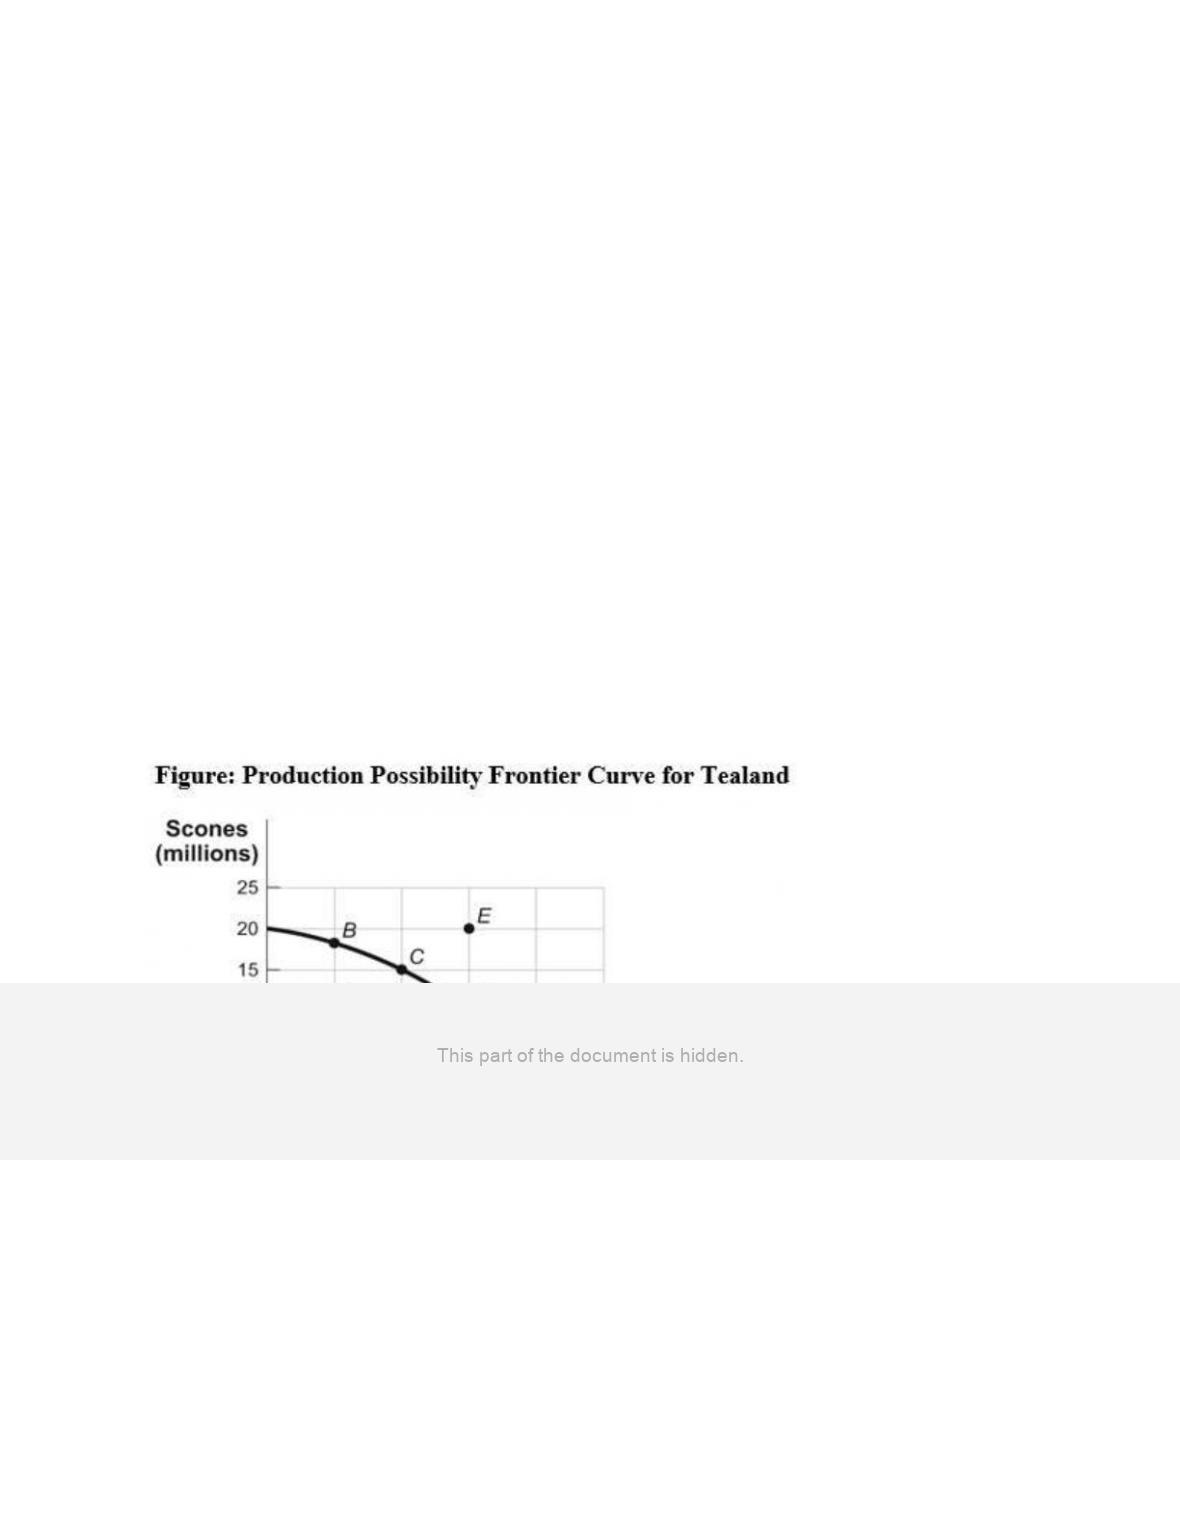
(Figure: Production Possibility Frontier for Tealand) Use Figure: Production Possibility
Frontier for Tealand. If Tealand is producing 10 million scones and 10 million cups of
tea (point A), we know that the economy:
A)
is using its resources efficiently.
B)
is using its resources inefficiently.
C)
is fully employing its resources.
D)
has found new resources.
51.
(Figure: Production Possibility Frontier for Tealand) Use Figure: Production Possibility
Frontier for Tealand. Tealand is producing at point C on its production possibility
frontier. What is the opportunity cost of increasing the production of tea from 20 million
cups to 30 million cups?
A)
10 million cups of tea
B)
5 million scones
C)
10 million scones
D)
The answer is impossible to determine from the information given.
52.
(Figure: Production Possibility Frontier for Tealand) Use Figure: Production Possibility
Frontier for Tealand. Tealand can produce at point E only if:
A)
the government eliminates unemployment.
B)
the government raises taxes.
C)
the country experiences economic growth.
D)
increases the cost of production by decreasing the use of technology.
53.
The production possibility frontier is bowed out because:
A)
resources are not equally suited for the production of both goods.
B)
resources are scarce.
C)
economic growth leads to inefficiency.
D)
resources are inefficiently used.
54.
The opportunity cost of production:
A)
is the price of a good.
B)
is what you give up to produce the good.
C)
decreases as production increases.
D)
is what you gain by producing the good.
Page 14
55.
Suppose Poland is producing on its production possibilities frontier, and it decides to
increase the production of steel and decrease the production of vodka. The bowed-out
production possibility frontier suggests that there will be a(n) _____ opportunity cost of
producing more steel.
A)
increasing
B)
decreasing
C)
nonexistent
D)
unchanged
56.
Economists usually assume that production is subject to increasing opportunity costs
because:
A)
higher production usually results in more inflation.
B)
not all resources are equally suited to producing every good.
C)
individuals desire constantly increasing opportunities to make themselves better
off.
D)
if production is efficient, it is not possible to increase the production of all goods
simultaneously.
57.
The production possibility frontier will shift outward because of:
A)
a decrease in the labor force.
B)
an increase in infrastructure spending.
C)
better technology that improves worker productivity.
D)
a decrease in the unemployment rate.
58.
In terms of the production possibility frontier, the inefficient use of available resources
is shown by:
A)
an increase in the labor force growth rate.
B)
a movement from one point to another along the production possibility frontier.
C)
an inward shift of the production possibility frontier due to the lack of opportunity.
D)
production at a point inside the production possibility frontier.
59.
The production possibility frontier will NOT shift outward due to an:
A)
increase in the unemployment rate.
B)
increase in the labor force.
C)
improvement in technology.
D)
increase in worker productivity.
Page 15
60.
The effect of an increase in productive inputs such as labor and capital can be shown by
a(n):
A)
point inside of the production possibility frontier.
B)
outward shift of the production possibility frontier.
C)
movement from one point to another along the production possibility frontier.
D)
inward shift of the production possibility frontier.
61.
The effect of a natural disaster can be shown by a(n) _____ the production possibility
frontier.
A)
point inside of
B)
outward shift of
C)
movement from one point to another along
D)
inward shift of
62.
An inward shift in the U.S. economy’s production possibility frontier could represent:
A)
U.S. workers moving to Canada.
B)
workers moving from New Jersey to Massachusetts.
C)
U.S. economic growth.
D)
a movement from labor-intensive to capital-intensive industries in some states.
63.
If the production possibility frontier is a straight line:
A)
opportunity costs are constant.
B)
firms face increasing costs.
C)
firms face decreasing costs.
D)
there is no trade-off between the two goods represented.
Page 16
Use the following to answer questions 64-70:
\\
64.
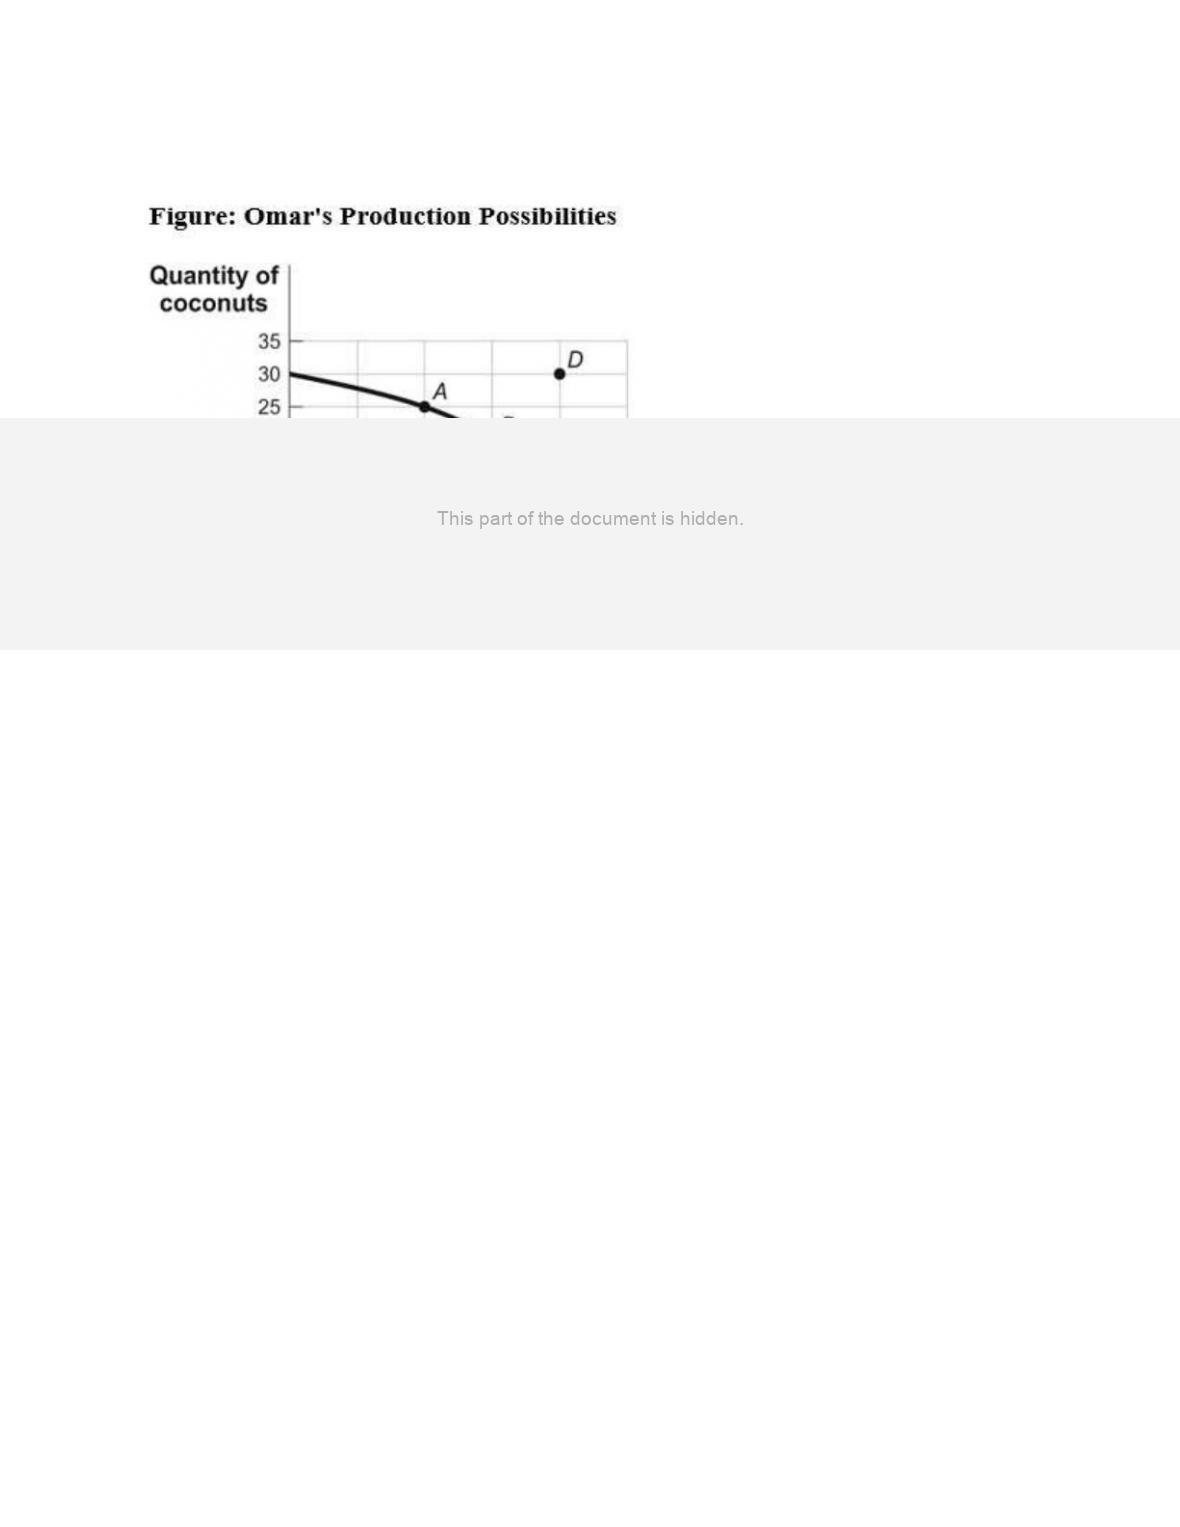
(Figure: Omar’s Production Possibilities) Use Figure: Omar’s Production Possibilities.
Which point or points represent(s) a combination of coconuts and fish that is efficient in
production?
A)
A only
B)
A and B
C)
B and C
D)
D only
65.
(Figure: Omar’s Production Possibilities) Use Figure: Omar’s Production Possibilities.
Which point or points represent(s) an inefficient combination of coconuts and fish?
A)
A only
B)
A and B
C)
C only
D)
B and D
66.
(Figure: Omar’s Production Possibilities) Use Figure: Omar’s Production Possibilities.
Which point or points represent(s) an infeasible combination of coconuts and fish?
A)
A only
B)
A and B
C)
B and C
D)
D only
Page 17
67.
(Figure: Omar’s Production Possibilities) Use Figure: Omar’s Production Possibilities.
Which point or points represent(s) a feasible combination of coconuts and fish?
A)
A only
B)
A and B
C)
A, B, and C
D)
D only
68.
(Figure: Omar’s Production Possibilities) Use Figure: Omar’s Production Possibilities.
The opportunity cost for Tom to move from point A on the curve to point B is:
A)
10 coconuts.
B)
10 fish.
C)
5 coconuts.
D)
5 fish.
69.
(Figure: Omar’s Production Possibilities) Use Figure: Omar’s Production Possibilities.
The opportunity cost for Tom to move from point B on the curve to point A is:
A)
10 coconuts.
B)
10 fish.
C)
5 coconuts.
D)
5 fish.
70.
(Figure: Omar’s Production Possibilities) Use Figure: Omar’s Production Possibilities.
The opportunity cost for Tom to move from point C on the curve to point A is:
A)
10 coconuts.
B)
30 fish.
C)
5 coconuts.
D)
There is no opportunity cost.
71.
The _____ illustrates the trade-offs facing an economy that produces only two goods.
A)
production possibility frontier
B)
circular-flow diagram
C)
all else equal assumption
D)
income distribution

Page 18
Use the following to answer questions 72-74:
\\
72.
(Table: Trade-off of Study Time and Leisure Time) Use Table: Trade-off of Study Time
and Leisure Time. A student sleeps 8 hours per day and divides the remaining time
between study time and leisure time. The table shows the combinations of study and
leisure time that can be produced in the 16 waking hours of each day. If a student
decides to consume one additional hour of leisure time, how many hours of study time
must she give up?
A)
4
B)
0.25
C)
1
D)
16
73.
(Table: Trade-off of Study Time and Leisure Time) Use Table: Trade-off of Study Time
and Leisure Time. A student sleeps 8 hours per day and divides the remaining time
between study and leisure time. The table shows the combinations of study and leisure
time that can be produced in the 16 waking hours of each day. Suppose this student is
studying 4 hours and spending 10 hours doing leisure activities. This point is:
A)
outside the production possibility frontier.
B)
inside the production possibility frontier.
C)
on the production possibility frontier.
D)
both efficient and feasible.
74.
(Table: Trade-off of Study Time and Leisure Time) Use Table: Trade-off of Study Time
and Leisure Time. A student sleeps 8 hours per day and divides the remaining time
between study time and leisure time. The table shows the combinations of study and
leisure time that can be produced in the 16 waking hours of each day. Suppose the
student completes a speed-reading course that allows him to do the same amount of
studying in half as many hours. His opportunity cost:
A)
of leisure has increased.
B)
of studying has increased.
C)
of leisure has decreased.
D)
has not changed.
Page 19
75.
If a production possibility frontier is a straight line, it tells us that the opportunity cost of
producing one more unit of good X is:
A)
an increasing amount of good Y.
B)
a decreasing amount of good Y.
C)
equal to the inverse of the amount of good Y.
D)
a constant amount of good Y.
76.
Suppose Indiana produces only steel and corn, with fixed amounts of land, labor, and
capital resources. Which scenario BEST sets the stage for economic growth?
A)
The unemployment rate in Indiana rises from 5% to 6%.
B)
The Midwest has a devastating drought.
C)
The percentage of Indiana residents with a college degree rises from 25% to 30%.
D)
The United States imports more and more low-cost steel from Asian countries.
77.
The production possibility frontier illustrates:
A)
the maximum quantity of one good that can be produced given the quantity of the
other good produced.
B)
that, when markets don’t achieve efficiency, government intervention can improve
society’s welfare.
C)
the inverse relation between price and quantity of a particular good.
D)
that people usually exploit opportunities to make themselves better off.
Use the following to answer questions 78-83:
\\
Page 20
78.
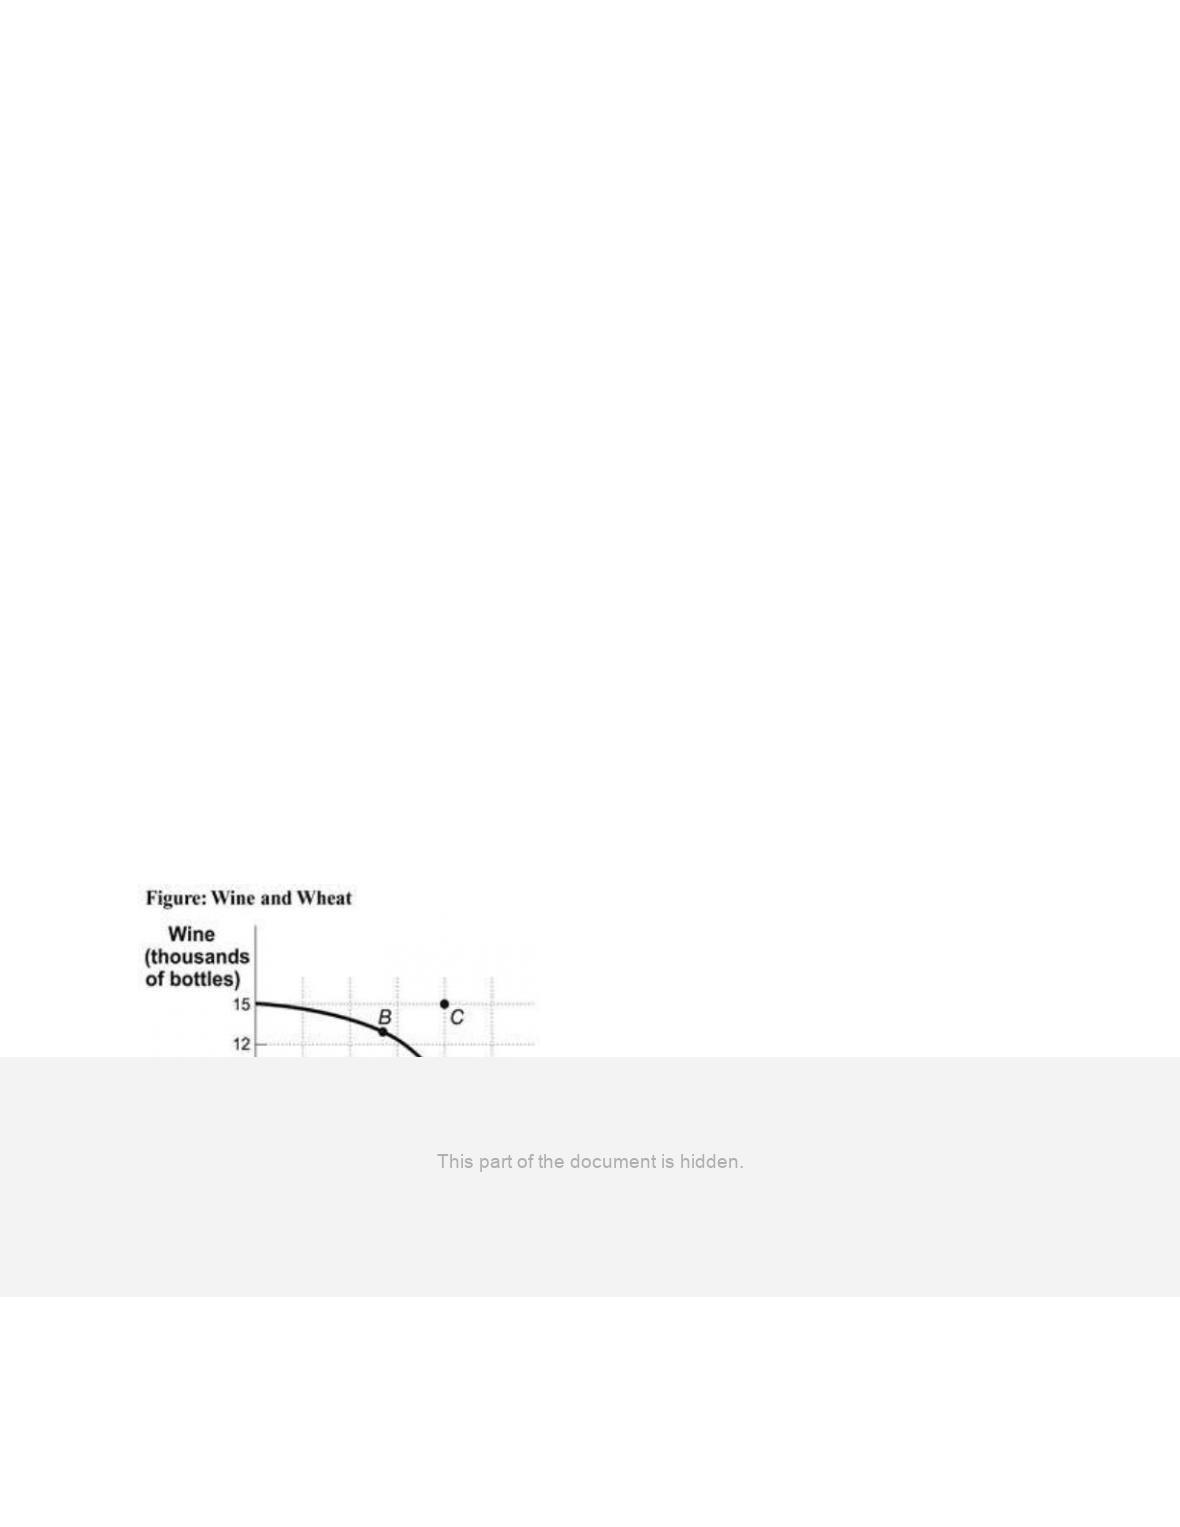
(Figure: Wine and Wheat) Use Figure: Wine and Wheat. If this economy is producing
12 tons of wheat and 9,000 bottles of wine, we know the economy:
A)
is using its resources efficiently.
B)
is using its resources inefficiently.
C)
is producing at an unattainable point.
D)
has unemployment.
79.
(Figure: Wine and Wheat) Use Figure: Wine and Wheat. If this economy is producing at
point A, we know the economy is:
A)
using its resources efficiently.
B)
using its resources inefficiently.
C)
producing at an unattainable point.
D)
trading with another country.
80.
(Figure: Wine and Wheat) Use Figure: Wine and Wheat. If this economy is producing at
point A and wants to produce at point B, it must:
A)
trade with another country.
B)
increase its resources.
C)
decrease production.
D)
use its existing resources efficiently.
81.
(Figure: Wine and Wheat) Use Figure: Wine and Wheat. The opportunity cost of
moving from producing ONLY wheat to producing ONLY wine is _____ tons of wheat.
A)
3
B)
6
C)
9
D)
15
82.
(Figure: Wine and Wheat) Use Figure: Wine and Wheat. The opportunity cost of
moving from producing ONLY wheat to producing at point D is _____ tons of wheat.
A)
3
B)
6
C)
9
D)
15