
Page 21
98.
(Figure: An Individual’s Marginal Benefit from a Public Good) Use Figure: An
Individual’s Marginal Benefit from a Public Good. Assume that two individuals will
share consumption of a public good; each individual has the marginal benefit curve
shown in the figure. If the marginal cost of the good is $24, what is the total benefit of
the level of the public good that maximizes society’s welfare?
A)
$0
B)
$24
C)
$124
D)
$248
99.
(Figure: An Individual’s Marginal Benefit from a Public Good) Use Figure: An
Individual’s Marginal Benefit from a Public Good. Assume that two individuals will
share consumption of a public good; each individual has the marginal benefit curve
shown in the figure. If the marginal cost of the good is $8, how many units of the public
good will be provided by the private market?
A)
0
B)
8
C)
12
D)
16
100.
(Figure: An Individual’s Marginal Benefit from a Public Good) Use Figure: An
Individual’s Marginal Benefit from a Public Good. Assume that two individuals will
share consumption of a public good; each individual has the marginal benefit curve
shown in the figure. If the marginal cost of the good is $8, how many units of this public
good will maximize society’s welfare?
A)
0
B)
8
C)
12
D)
16
101.
For a public good, which statement(s) accurately describe(s) the marginal social benefit
(MSB)?
I. MSB equals the sum of the individual marginal benefits for all of the consumers of
that unit.
II. MSB equals the sum of each consumer’s willingness to pay for that unit.
III. MSB is greater than any individual marginal benefit.
A)
I only
B)
II only
C)
I and II only
D)
I, II, and III
Page 22
Use the following to answer questions 102-104:
102.
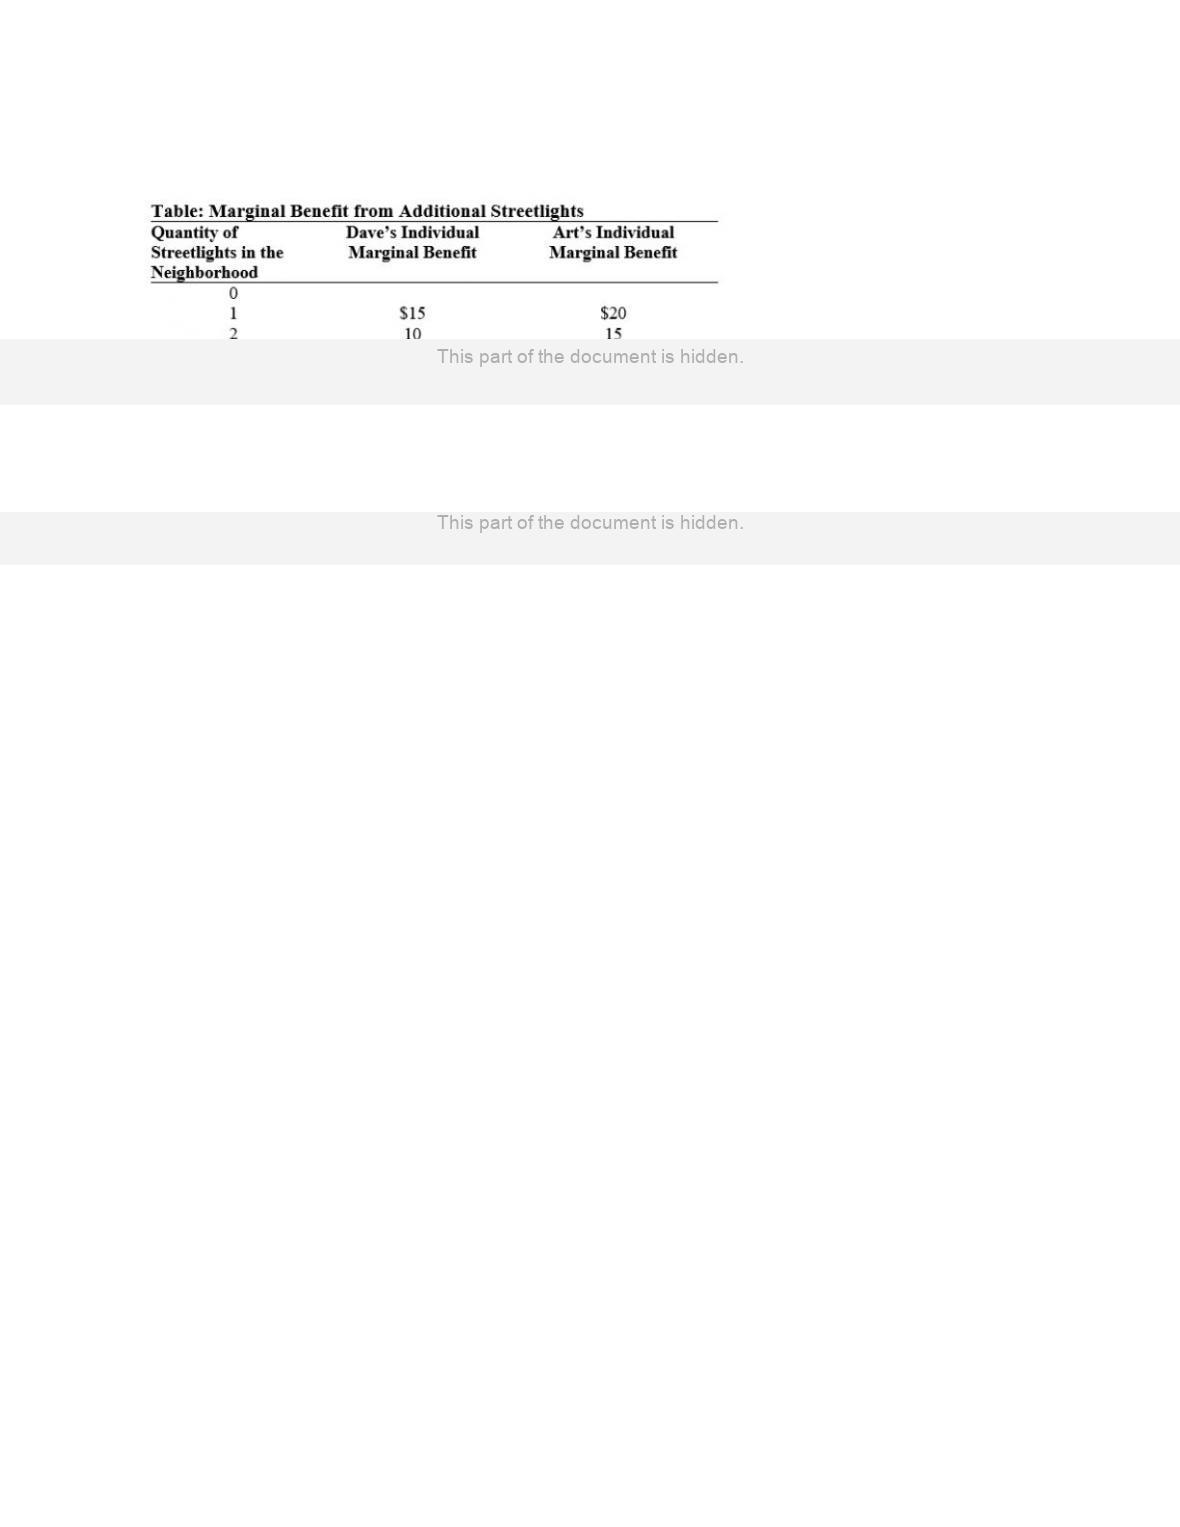
(Table: Marginal Benefit from Additional Streetlights) Use Table: Marginal Benefit
from Additional Streetlights. Suppose that the marginal cost of installing a streetlight is
$6. What is the maximum that Art would be willing to pay to have one streetlight
installed in the neighborhood?
A)
$20
B)
$15
C)
$35
D)
$5
103.
(Table: Marginal Benefit from Additional Streetlights) Use Table: Marginal Benefit
from Additional Streetlights. Suppose that the marginal cost of installing a streetlight is
$6. If Dave had to pay for streetlights on his own, how many streetlights would there
be?
A)
0
B)
1
C)
2
D)
3
104.
(Table: Marginal Benefit from Additional Streetlights) Use Table: Marginal Benefit
from Additional Streetlights. Suppose that the marginal cost of installing a streetlight is
$6. What is the socially optimal number of streetlights in the neighborhood?
A)
1
B)
2
C)
3
D)
4
Page 23
105.
Which statement is TRUE?
A)
It is possible to observe how much people benefit from consuming an additional
unit of a public good.
B)
It is difficult to get an accurate estimate of the marginal social benefits of public
goods because individuals have an incentive to distort the truth about their
willingness to pay.
C)
Individuals tend to underestimate the amount of a public good that they desire.
D)
It is straightforward to estimate the marginal social benefits of public goods.
106.
What is difficult about using cost-benefit analysis to estimate the level of a public good
that will maximize social welfare?
A)
The government cannot use cost-benefit analysis to estimate this.
B)
It is difficult to estimate the marginal costs of supplying a public good.
C)
It is difficult to estimate the marginal social benefits of supplying a public good.
D)
The costs of using it may make the provision of the public good prohibitive.
107.
Which example is considered a common resource?
A)
a public beach with free access
B)
a seat on an airplane
C)
a highway to which access is granted only to those who pay a specified toll
D)
a city sewer system
108.
Which example is BEST characterized as a common resource?
A)
national defense
B)
a bottle opener
C)
a dorm kitchen
D)
a pair of boots
109.
Common resources tend to be _____ in private markets.
A)
priced too high
B)
efficiently priced
C)
overconsumed
D)
underconsumed
110.
If the marginal social benefit received from a good is equal to the marginal social cost of
production:
A)
an increase in production will improve society’s well-being.
B)
a decrease in production will improve society’s well-being.
C)
no change in production can improve society’s well-being.
D)
the market is producing too much of the good.
Page 24
111.
If the marginal social benefit received from a good is less than the marginal social cost
of production:
A)
an increase in production will improve society’s well-being.
B)
a decrease in production will improve society’s well-being.
C)
no change in production can improve society’s well-being.
D)
the market is producing too little of the good.
112.
If the marginal social benefit received from a good is greater than the marginal social
cost of production:
A)
an increase in production will improve society’s well-being.
B)
a decrease in production will improve society’s well-being.
C)
no change in production can improve society’s well-being.
D)
the market is producing too much of the good.
113.
If the extent to which common resources (such as fish in the sea) should be used is left
to the private market:
A)
resource use will be efficient and will maximize social welfare.
B)
each individual will use the resource until his or her marginal benefit is equal to the
marginal social cost.
C)
the marginal social cost and each individual’s marginal private cost will be the
same.
D)
the marginal social cost will be greater than the marginal private cost, and the
resource will be overused.
114.
If the use of a common resource is determined in the private market, the resource will be
_____ since the marginal social benefit will be equal to the marginal private cost of
production, which is _____ than the marginal social cost.
A)
underused; greater than
B)
overused; less than
C)
overused; greater than
D)
underused; equal to
115.
Common resources tend to be overused because:
A)
individuals tend to ignore the cost to others of their use of the resource.
B)
the individual marginal cost is greater than the marginal social cost.
C)
common resources are nonrival and nonexcludable.
D)
the marginal cost of allowing one more unit of consumption is zero.
Page 25
116.
For a common resource, the marginal social benefit at the quantity provided by a private
market is _____ the marginal social cost.
A)
equal to
B)
greater than
C)
less than
D)
irrelevant to
117.
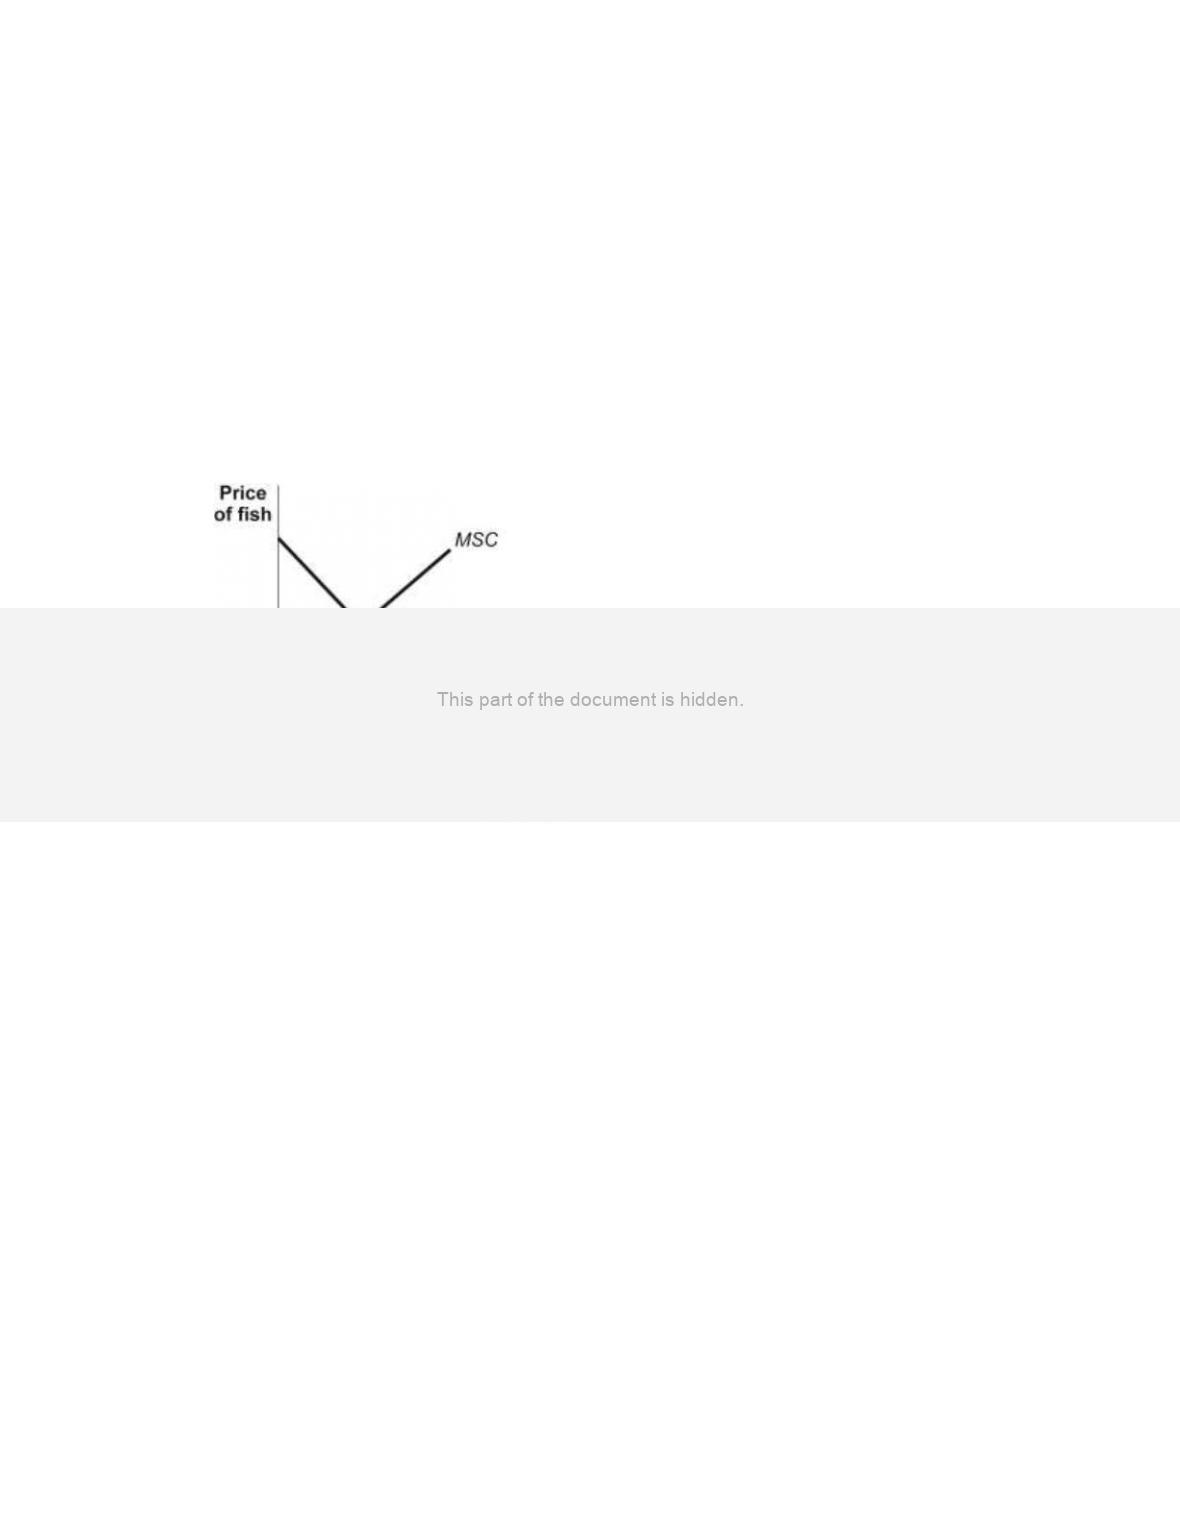
(Figure: Marginal Social Cost and Supply) Use Figure: Marginal Social Cost and
Supply. The marginal social cost curve lies above the supply curve:
Figure: Marginal Social Cost and Supply
A)
because the marginal social benefit is greater for a common resource.
B)
and the efficient quantity of this common resource is point E.
C)
because the marginal social cost includes the cost to society of depleting this
common resource.
D)
because this is a public good.
118.
Consumption of a common resource is inefficiently too _____ because the marginal
social cost of the resource is _____ than the private marginal cost.
A)
low; higher
B)
low; less
C)
high; higher
D)
high; less
Page 26
119.
Traffic congestion imposes higher costs and discomfort to residents of a city because the
marginal social cost of any one individual’s use of the roads is _____ the individual
marginal cost.
A)
less than
B)
greater than
C)
equal to
D)
irrelevant to
120.
If the market supply and demand curves for a common resource include all costs and
benefits to society from production and consumption, the common resource will:
A)
be underused.
B)
be overused.
C)
be used at the socially optimal level.
D)
impose an external cost on society.
121.
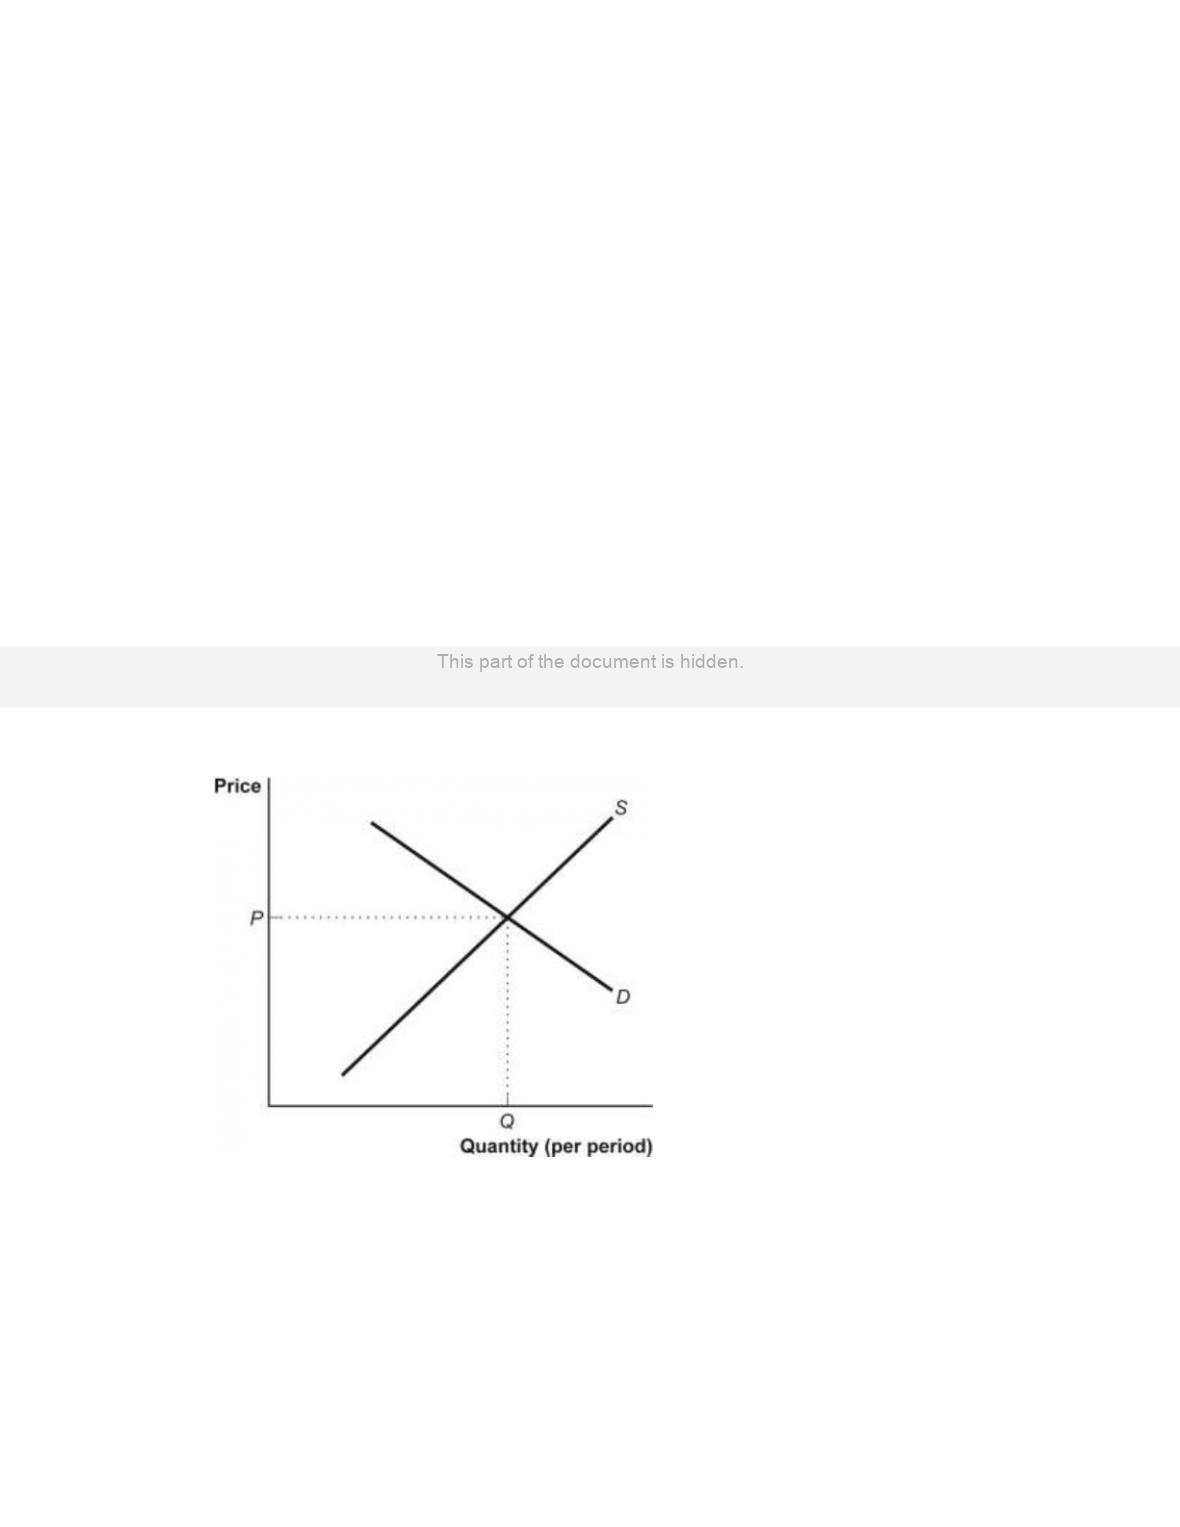
(Figure: Model of a Market for a Common Resource) Use Figure: Model of a Market
for a Common Resource. The figure shows the intersection of the private supply and
demand curves. Without any consideration of the marginal social cost of using a
common resource, the quantity of the common resource used at Q will be:
Figure: Model of a Market for a Common Resource
A)
larger than is socially desirable.
B)
smaller than is socially desirable.
C)
efficient.
D)
indeterminate without more information.
Page 27
122.
If an individual does not have to pay to use a common resource, that individual will
continue to use a common resource until his or her:
A)
marginal benefit is zero.
B)
marginal cost is zero.
C)
marginal benefit exceeds marginal cost.
D)
marginal benefit equals the marginal social cost.
123.
The marginal social cost of a common resource is _____ than an individual’s marginal
cost, and without government intervention the market will allow provision of _____ of
the common resource than is socially optimal.
A)
less; more
B)
less; less
C)
greater; more
D)
greater; less
124.
Suppose the Alaskan king crab harvest is unregulated, and any person with a boat can
go offshore, lower a crab pot, and harvest king crab. This common resource will likely
be _____ because the marginal social cost of harvesting crabs _____ the market price of
crab.
A)
overfished; is equal to
B)
overfished; is less than
C)
efficiently fished; is equal to
D)
overfished; exceeds
125.
The problem with common resources is similar to the problem with negative
externalities because:
A)
both issues deal with natural resources.
B)
the marginal social benefit of producing another unit exceeds the individual’s
marginal benefit.
C)
the marginal social cost of producing another unit exceeds the individual’s marginal
cost.
D)
the individual’s marginal cost of producing another unit exceeds the individual’s
marginal benefit.
126.
One way the government of Alaska could prevent an inefficiently large production of
crab fishing would be to:
A)
subsidize fishermen to encourage competition.
B)
sell exclusive licenses for the right to fish.
C)
offer tax breaks for more efficient boats.
D)
allow competition from foreign fishermen.
Page 28
127.
In London, any motorist entering a particular area in the city center during certain
specified times must pay a congestion fee equal to £11.50 per day, with fines for
noncompliance rising to as high as £130. The congestion fee is:
A)
a Pigouvian subsidy aimed at encouraging the use of city streets.
B)
an attempt to internalize the costs of traffic delays and congestion.
C)
the wrong policy tool for solving the problem of congestion; instead, motorists
should be allowed to make deals to determine when and where they are permitted
to drive.
D)
likely to cause marginal private benefit from road use to decrease.
128.
A Pigouvian tax can lead to the efficient level of production and consumption of:
A)
a public good.
B)
a common resource.
C)
an artificially scarce good.
D)
no goods since all taxes cause inefficiency.
129.
Whenever a species is threatened with extinction, it is likely that:
A)
clearly defined property rights exist.
B)
no one has exclusive property rights to it.
C)
greedy people in society are increasing their share of social surplus.
D)
it is the result of too much government regulation.
130.
The government can intervene to achieve the socially optimal quantity of a common
resource by using which approach(es)?
I. assigning property rights
II. imposing a tax on usage
III. granting a limited number of tradable permits to use the good
A)
I only
B)
II only
C)
I and II only
D)
I, II, and III
131.
The government can intervene to avoid overfishing by using which approach(es)?
I. assigning property rights
II. imposing a tax on usage
III. granting a limited number of tradable fishing permits
A)
I only
B)
II only
C)
I and II only
D)
I, II, and III
Page 29
132.
If policy makers provide only enough tradable permits to provide efficient use of a
common resource, only those who _____ will use the resource.
A)
gain the most
B)
initially obtain the permit
C)
have the largest market share
D)
have monopoly power
133.
Suppose the Alaskan king crab harvest is unregulated and any person with a crab boat
and some diesel fuel can go offshore, lower a crab pot, and harvest king crab. As a
result, this common resource is overused. Which policy choice might produce the
socially optimal king crab harvest?
A)
Alaska subsidizes the purchase of crab boats.
B)
Alaska auctions a limited number of licenses to harvest king crab.
C)
Alaska removes taxes on diesel fuel, which lowers the price of diesel.
D)
The U.S. and Canadian governments remove trade barriers, which allows for more
trade of products like king crab.
Use the following to answer questions 134-137:
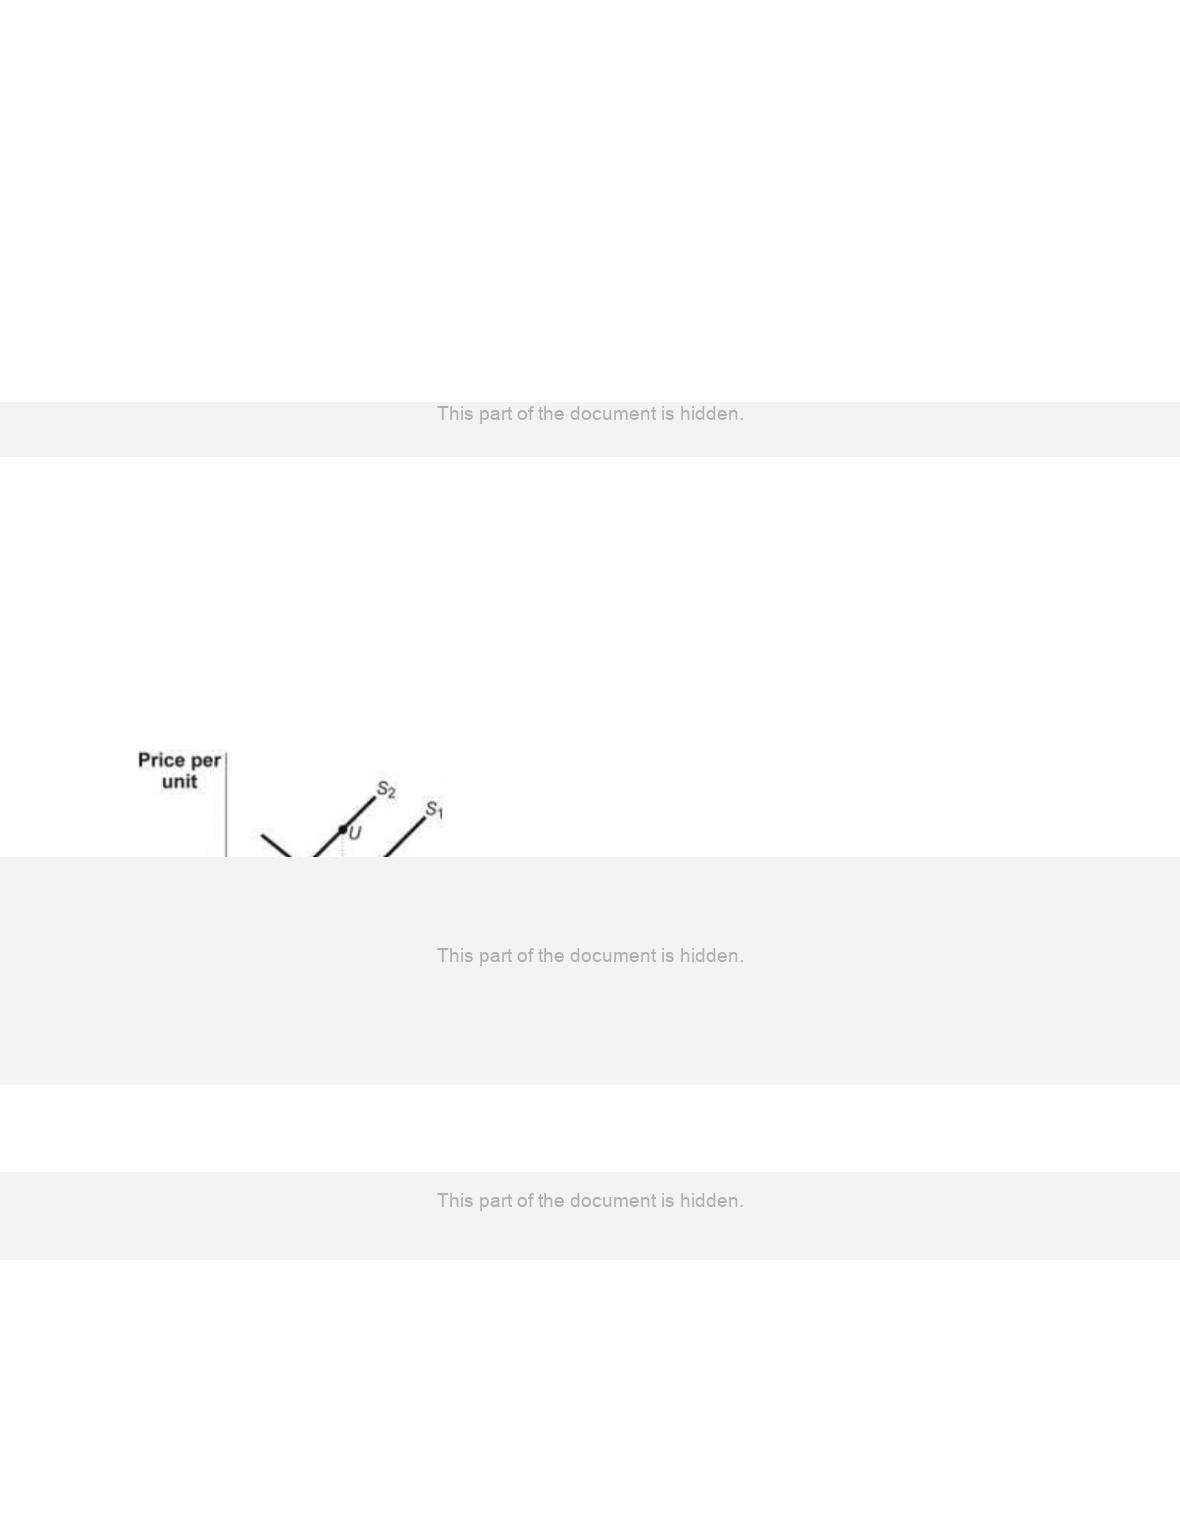
Figure: Correcting for Market Failure
134.
(Figure: Correcting for Market Failure) Use Figure: Correcting for Market Failure.
There is an external cost in the market illustrated in the figure, and the two
upward-sloping lines reflect private and social marginal costs. Economists argue that, in
an unregulated private market, too _____ is produced. In the figure, the supply curve
(S1) reflects _____ marginal cost.
A)
little; private
B)
much; private
C)
much; social
D)
little; social and private

Page 30
135.
(Figure: Correcting for Market Failure) Use Figure: Correcting for Market Failure.
There is an external cost in the market illustrated in the figure, and the two
upward-sloping lines reflect private and social marginal costs. If the government forces
the private-sector firms to internalize any external costs:
A)
the supply curve shifts to the right, from S2 to S1.
B)
the supply curve shifts to the left, from S1 to S2.
C)
the supply curve is unaffected.
D)
price per unit decreases.
136.
(Figure: Correcting for Market Failure) Use Figure: Correcting for Market Failure.
There is an external cost in the market illustrated in the figure, and the two
upward-sloping lines reflect private and social marginal costs. If the government
intervenes to correct for the external cost, the new _____ will now reflect _____ costs.
A)
supply curve S1; both private and external
B)
supply curve S2; private but not external
C)
supply curve S2; both private and external
D)
demand curve (not shown); external but not private
137.
(Figure: Correcting for Market Failure) Use Figure: Correcting for Market Failure.
There is an external cost in the market illustrated in the figure, and the two
upward-sloping lines reflect private and social marginal costs. When the government
intervenes to correct for the external cost, the output will _____ from _____ to _____.
A)
fall; W; R
B)
increase; W; R
C)
fall; R; W
D)
fall; W; 0
138.
Which example is considered an artificially scarce good?
A)
a candy bar
B)
a free art exhibit in a city park
C)
a pay-per-view boxing match on cable television
D)
an interstate highway without tolls
139.
Computer software that you can download from the Internet for a price is an artificially
scarce good because it is _____ but _____ in consumption.
A)
nonexcludable; rival
B)
excludable; nonrival
C)
nonexcludable; nonrival
D)
excludable; rival
Page 31
140.
The marginal cost of producing an artificially scarce good is usually equal to:
A)
zero.
B)
the marginal benefit if consumer surplus equals zero.
C)
the average total cost.
D)
its price.
141.
Which example is BEST characterized as an artificially scarce good?
A)
diamonds because their supply is artificially restricted by monopoly producers
B)
music that is downloadable from the Internet for a fee
C)
a daily newspaper
D)
hot dogs in a sports stadium because the number of suppliers is restricted
142.
The source of inefficiency in the use of artificially scarce goods is similar to the source
of inefficiencies created by:
A)
externalities.
B)
an oligopoly.
C)
price discrimination.
D)
a natural monopoly.
Use the following to answer questions 143-146:
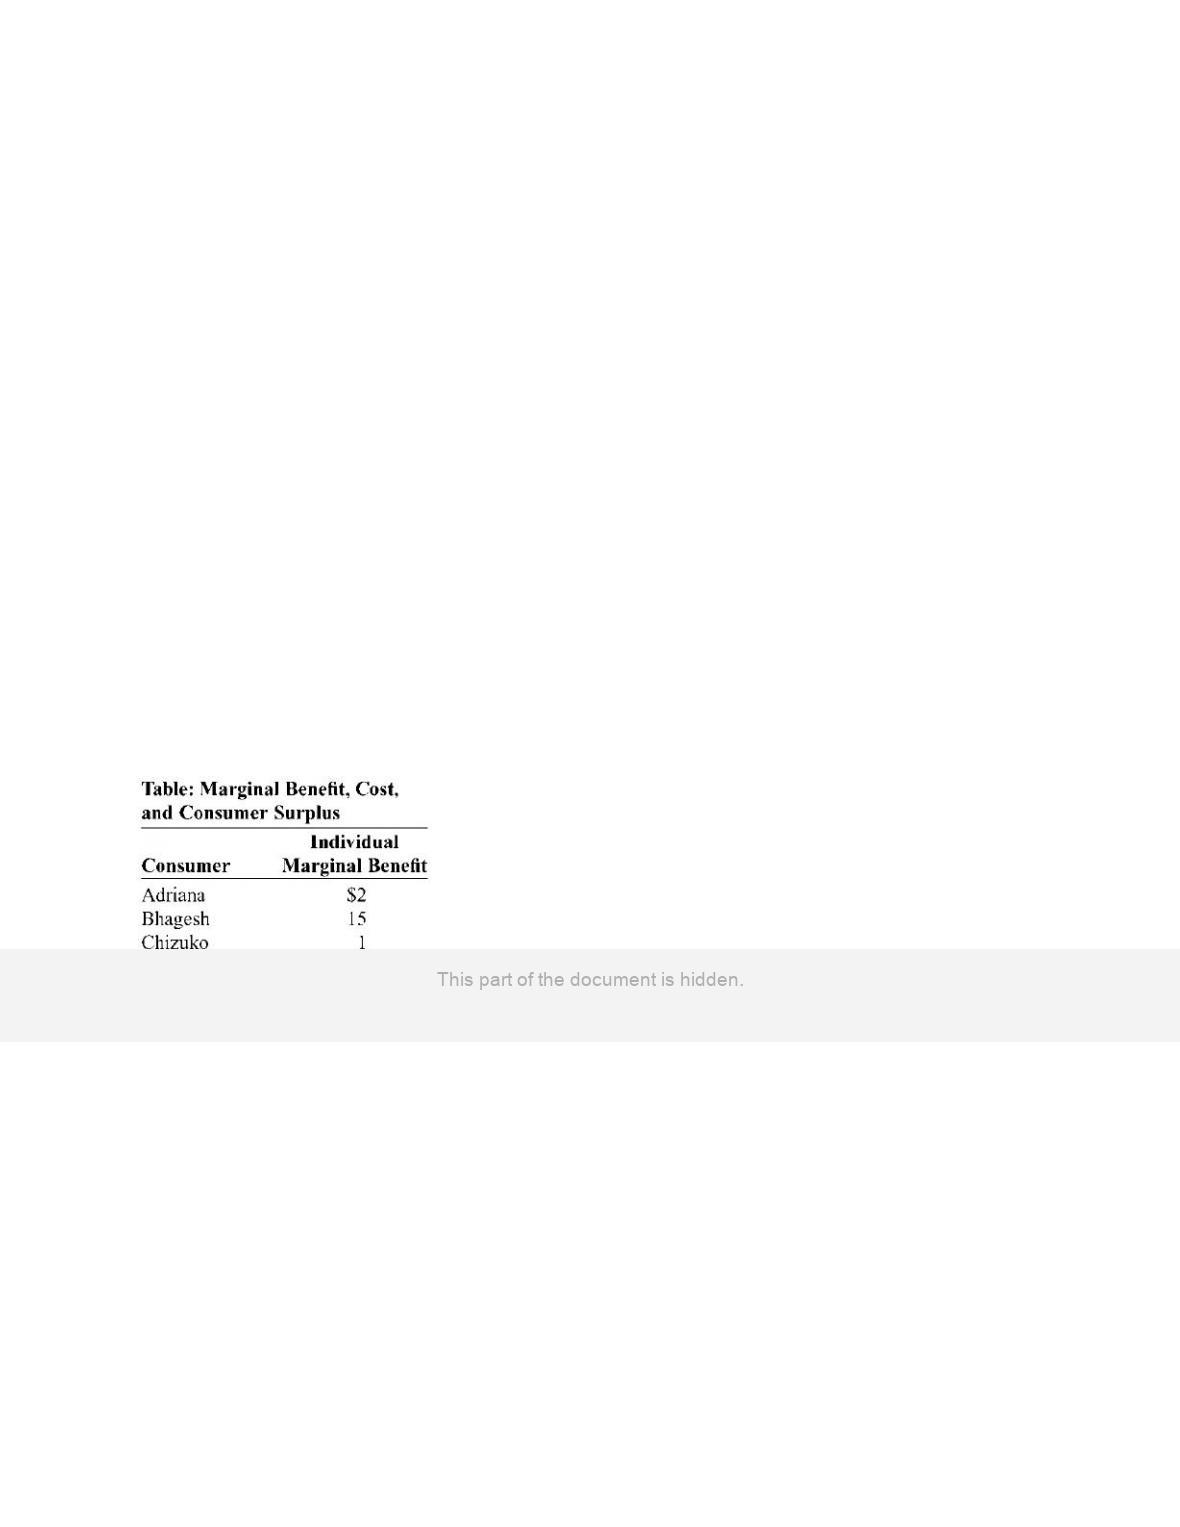
143.
(Table: Marginal Benefit, Cost, and Consumer Surplus) Use Table: Marginal Benefit,
Cost, and Consumer Surplus. The table shows six consumers’ willingness to pay for one
iTunes download. If the marginal social cost is constant at $0, then the efficient price is
_____ and consumer surplus is _____.
A)
$0; $37
B)
$1; $36
C)
$4; $33
D)
$5; $32
Page 32
144.
(Table: Marginal Benefit, Cost, and Consumer Surplus) Use Table: Marginal Benefit,
Cost, and Consumer Surplus. The table shows six consumers’ willingness to pay for one
iTunes download. If the marginal social cost is constant at _____, then _____
consumers will purchase this good, and consumer surplus is _____.
A)
$5.50; two; $14
B)
$6; three; $30
C)
$6.50; two; $13
D)
$3; four; $34
145.
(Table: Marginal Benefit, Cost, and Consumer Surplus) Use Table: Marginal Benefit,
Cost, and Consumer Surplus. The table shows six consumers’ willingness to pay for one
iTunes download. If the marginal social cost is constant at _____, then _____
consumers will purchase this good, and consumer surplus is _____.
A)
$6; three; $13
B)
$3.50; four; $20
C)
$11; two; $22
D)
$40; zero; –$37
146.
(Table: Marginal Benefit, Cost, and Consumer Surplus) Use Table: Marginal Benefit,
Cost, and Consumer Surplus. The table shows six consumers’ willingness to pay for one
iTunes download. If the marginal social cost is constant at _____, then _____
consumers will purchase this good, and consumer surplus is _____.
A)
$0; four; $12
B)
$3; four; $22
C)
$13; five; $30
D)
$20; six; $37
147.
Producers of artificially scarce goods face _____ that are similar to those of natural
monopolists; they decline over the relevant range of output.
A)
external benefits
B)
external costs
C)
total fixed costs
D)
average total costs
Page 33
Use the following to answer questions 148-151:
Figure: Demand and Marginal Revenue
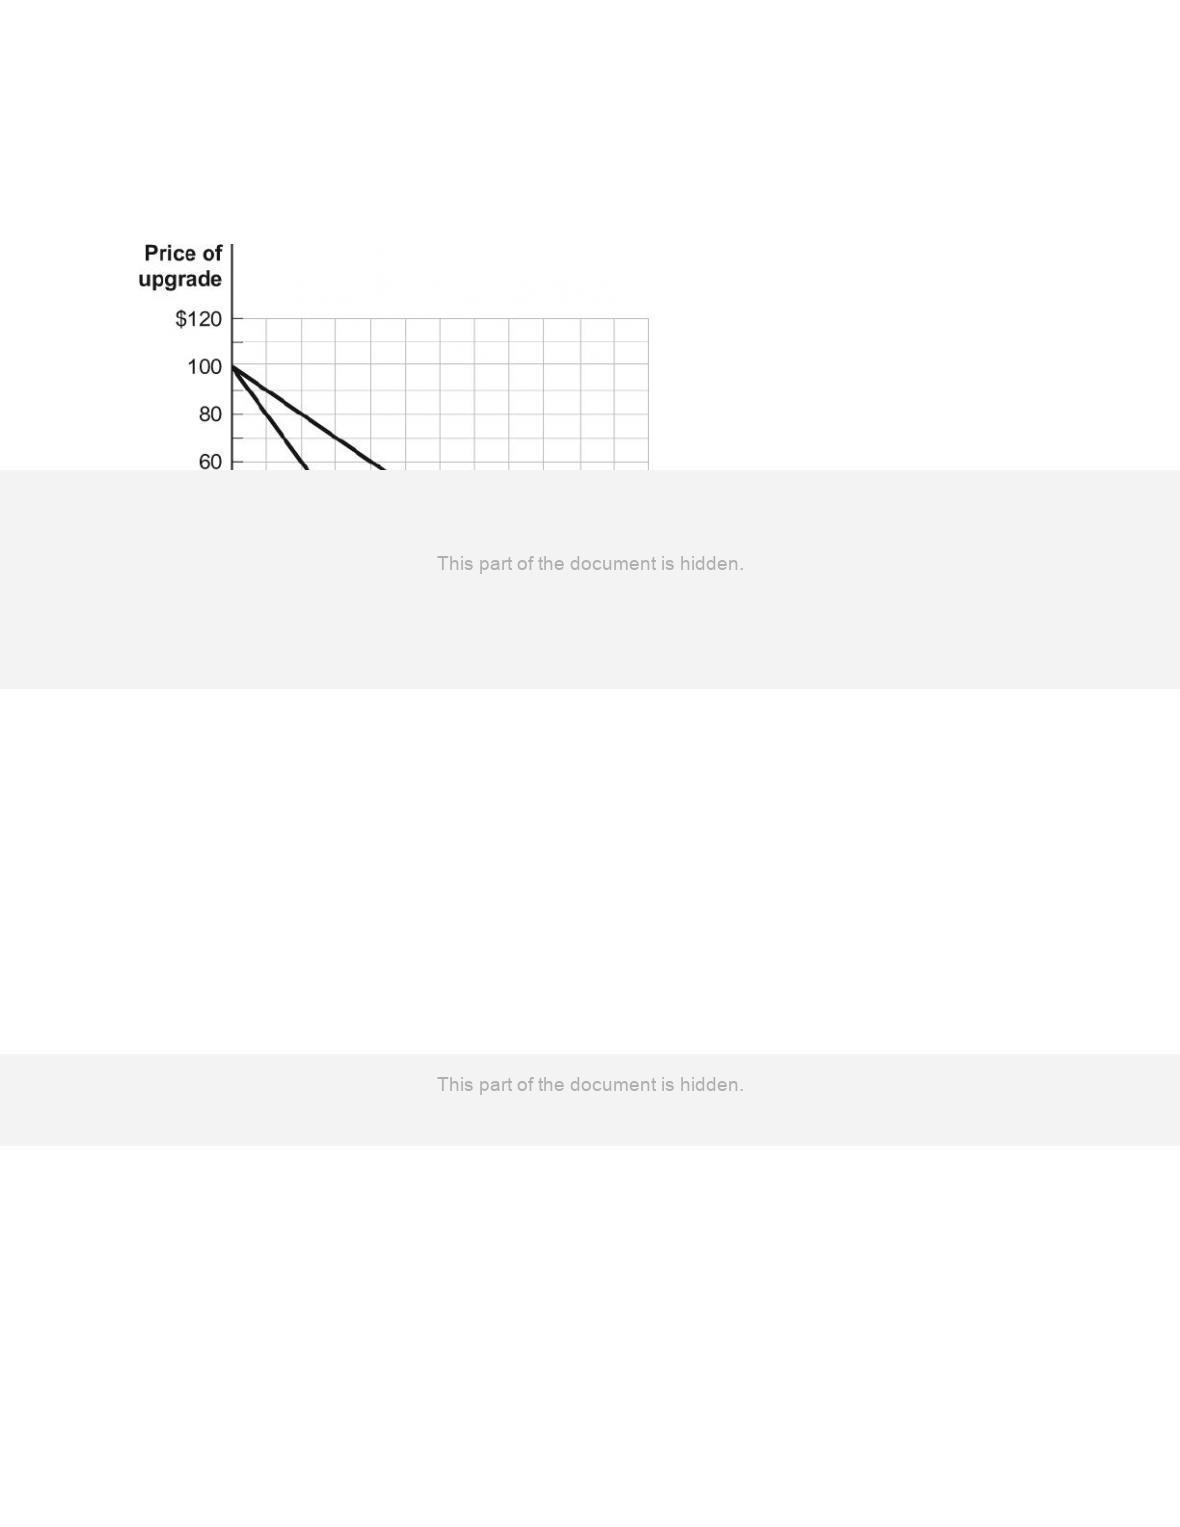
148.
(Figure: Demand and Marginal Revenue) Use Figure: Demand and Marginal Revenue.
The figure refers to a software upgrade. The producer incurred fixed costs of $10
million to produce the upgrade; the marginal cost of allowing consumers to download
the upgrade is zero. To maximize profit, the producer will set a price of _____ and
produce _____ upgrades.
A)
$100; 125,000
B)
$100; 250,000
C)
$50; 125,000
D)
$0; 250,000
149.
(Figure: Demand and Marginal Revenue) Use Figure: Demand and Marginal Revenue.
The figure refers to a software upgrade. The producer incurred fixed costs of $10
million to produce the upgrade; the marginal cost of allowing consumers to download
the upgrade is zero. What is the deadweight loss associated with the profit-maximizing
price and quantity of the upgrade?
A)
$0
B)
$1.25 million
C)
$3.125 million
D)
$6.25 million
Page 34
150.
(Figure: Demand and Marginal Revenue) Use Figure: Demand and Marginal Revenue.
The figure refers to a software upgrade. The producer incurred fixed costs of $10
million to produce the upgrade; the marginal cost of allowing consumers to download
the upgrade is zero. What is the efficient price of the upgrade?
A)
$0
B)
$50
C)
$75
D)
$100
151.
(Figure: Demand and Marginal Revenue) Use Figure: Demand and Marginal Revenue.
The figure refers to a software upgrade. The producer incurred fixed costs of $10
million to produce the upgrade; the marginal cost of allowing consumers to download
the upgrade is zero. What is the efficient level of output for the upgrade?
A)
0
B)
80,000
C)
125,000
D)
250,000
152.
Pharmaceutical companies typically face very high fixed costs when developing new
drugs. The marginal cost of producing a drug after development is very low. When these
companies set price and output to maximize profit, patients pay a _____ price for _____
amounts of the drug than are socially optimal.
A)
lower; lower
B)
higher; higher
C)
lower; higher
D)
higher; lower
153.
A very large museum could accommodate many more visitors than it does without
reducing the enjoyment of the visitors if it did not charge such a high price for
admission. Visits to the museum are a(n):
A)
private good.
B)
public good.
C)
common resource.
D)
artificially scarce good.
Page 35
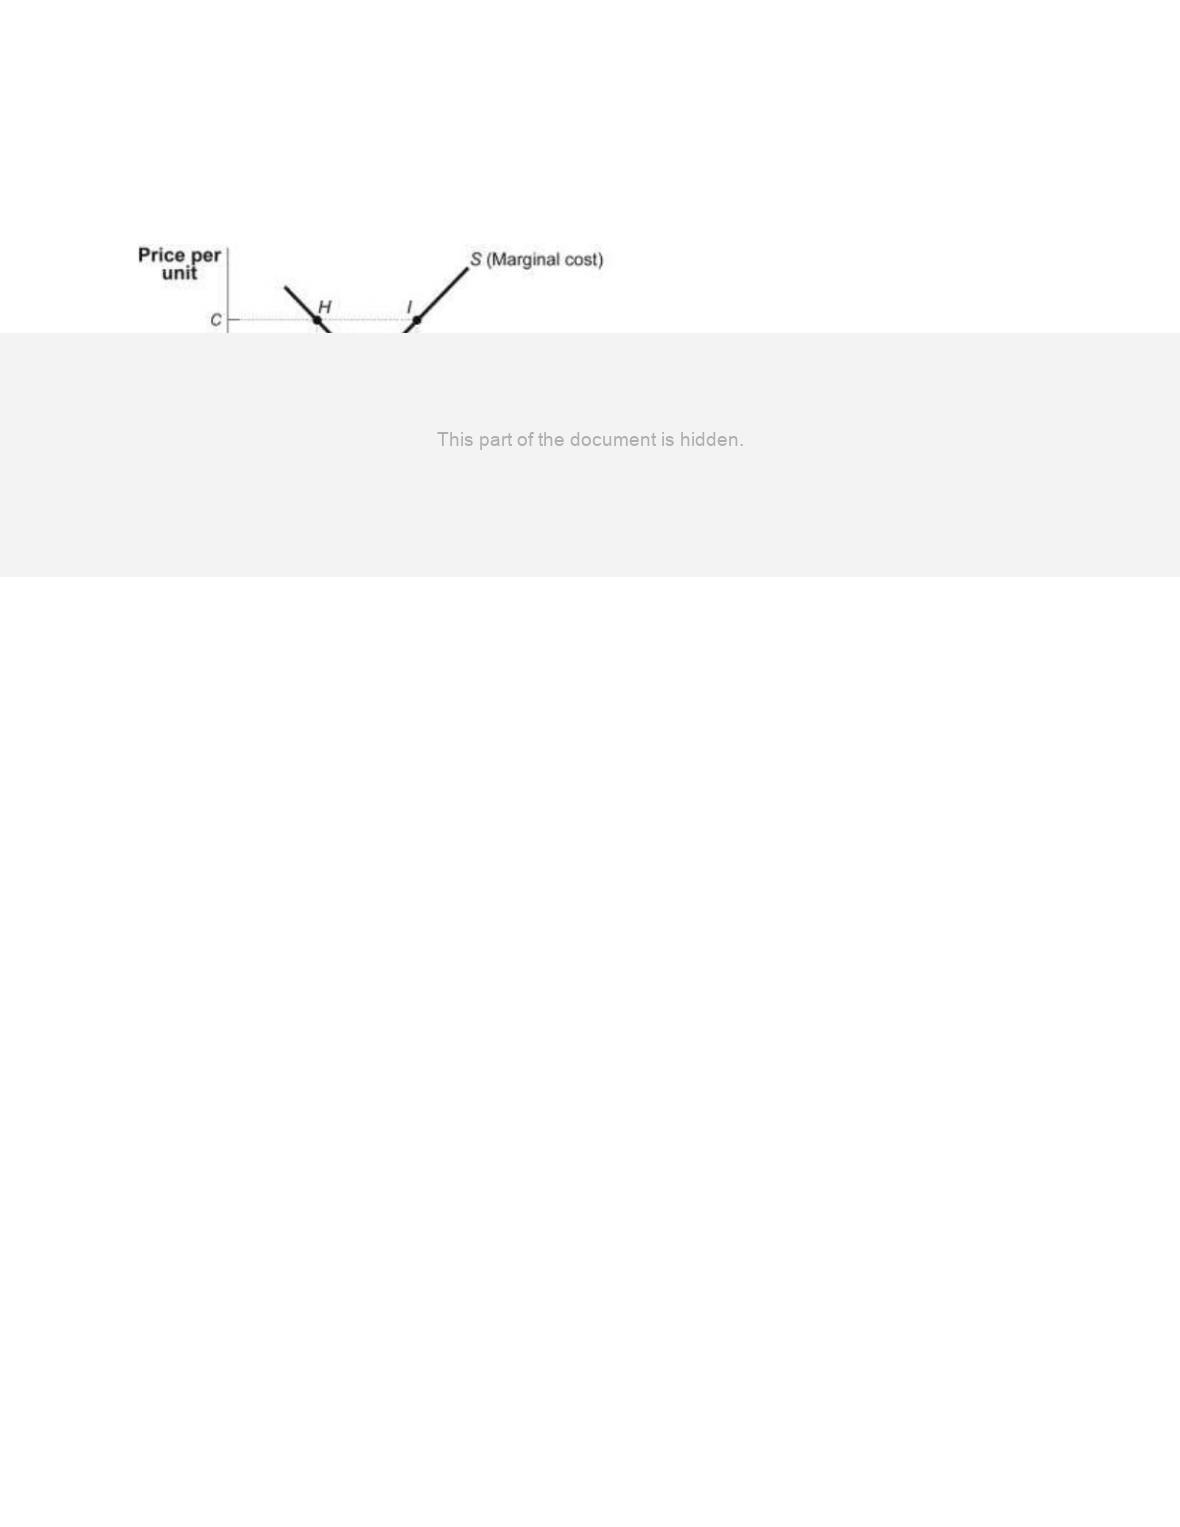
Use the following to answer questions 154-174:
Figure: Market Failure
154.
(Figure: Market Failure) Use Figure: Market Failure. In the figure, which point
coincides with the equilibrium for a competitive market?
A)
H
B)
I
C)
J
D)
K
155.
(Figure: Market Failure) Use Figure: Market Failure. In the figure, the equilibrium price
is _____, and the equilibrium quantity is _____ for a competitive market.
A)
A; E
B)
A; G
C)
B; F
D)
C; E
156.
(Figure: Market Failure) Use Figure: Market Failure. In the figure, if production in this
competitive market is at quantity E:
A)
marginal benefit is equal to marginal cost.
B)
marginal benefit is less than marginal cost.
C)
marginal benefit is greater than marginal cost.
D)
price is equal to marginal cost and greater than marginal benefit.

Page 36
157.
(Figure: Market Failure) Use Figure: Market Failure. In the figure, if production in this
competitive market is at quantity F:
A)
marginal benefit is equal to marginal cost.
B)
marginal benefit is less than marginal cost.
C)
marginal benefit is greater than marginal cost.
D)
price is equal to marginal cost and greater than marginal benefit.
158.
(Figure: Market Failure) Use Figure: Market Failure. In the figure, if production in this
competitive market is at quantity G:
A)
marginal benefit is less than marginal cost.
B)
marginal benefit is equal to marginal cost.
C)
marginal benefit is greater than marginal cost.
D)
price is equal to marginal cost and less than marginal benefit.
159.
(Figure: Market Failure) Use Figure: Market Failure. Suppose that the supply curve
represents the marginal cost of providing streetlights in a neighborhood where only two
people, Ann and Joe, reside. The demand curve represents the marginal benefit that Ann
receives from the streetlights. Suppose that Joe’s marginal benefit from the streetlights is
a constant amount equal to the vertical distance A–C. How much is Ann willing to pay
for E streetlights?
A)
0
B)
A
C)
B
D)
C
160.
(Figure: Market Failure) Use Figure: Market Failure. Suppose that the supply curve
represents the marginal cost of providing streetlights in a neighborhood where only two
people, Ann and Joe, reside. The demand curve represents the marginal benefit that Ann
receives from the streetlights. Suppose that Joe’s marginal benefit from the streetlights is
a constant amount equal to the vertical distance A–C. How much is Ann willing to pay
for F streetlights?
A)
0
B)
A
C)
B
D)
C

Page 37
161.
(Figure: Market Failure) Use Figure: Market Failure. Suppose that the supply curve
represents the marginal cost of providing streetlights in a neighborhood where only two
people, Ann and Joe, reside. The demand curve represents the marginal benefit that Ann
receives from the streetlights. Suppose that Joe’s marginal benefit from the streetlights is
a constant amount equal to the vertical distance A–C. How much is Ann willing to pay
for G streetlights?
A)
0
B)
A
C)
B
D)
C
162.
(Figure: Market Failure) Use Figure: Market Failure. Suppose that the supply curve
represents the marginal cost of providing streetlights in a neighborhood where only two
people, Ann and Joe, reside. The demand curve represents the marginal benefit that Ann
receives from the streetlights. Suppose that Joe’s marginal benefit from the streetlights is
a constant amount equal to the vertical distance A–C. If Ann is the only person to pay
for the streetlights, how many lights will be provided?
A)
0
B)
E
C)
F
D)
G
163.
(Figure: Market Failure) Use Figure: Market Failure. Suppose that the supply curve
represents the marginal cost of providing streetlights in a neighborhood where only two
people, Ann and Joe, reside. The demand curve represents the marginal benefit that Ann
receives from the streetlights. Suppose that Joe’s marginal benefit from the streetlights is
a constant amount equal to the vertical distance A–C. The marginal social benefit of F
streetlights is:
A)
0.
B)
B.
C)
less than B.
D)
greater than B.

164.
(Figure: Market Failure) Use Figure: Market Failure. Suppose that the supply curve
represents the marginal cost of providing streetlights in a neighborhood where only two
people, Ann and Joe, reside. The demand curve represents the marginal benefit that Ann
receives from the streetlights. Suppose that Joe’s marginal benefit from the streetlights is
a constant amount equal to the vertical distance A–C. The marginal social benefit of G
streetlights is:
A)
0.
B)
A.
C)
B.
D)
C.
165.
(Figure: Market Failure) Use Figure: Market Failure. Suppose that the supply curve
represents the marginal cost of providing streetlights in a neighborhood where only two
people, Ann and Joe, reside. The demand curve represents the marginal benefit that Ann
receives from the streetlights. Suppose that Joe’s marginal benefit from the streetlights is
a constant amount equal to the vertical distance A–C. Providing E streetlights is _____
because the marginal social benefit is _____ the marginal cost.
A)
efficient; equal to
B)
efficient; greater than
C)
inefficient; greater than
D)
inefficient; less than
166.
(Figure: Market Failure) Use Figure: Market Failure. Suppose that the supply curve
represents the marginal cost of providing streetlights in a neighborhood where only two
people, Ann and Joe, reside. The demand curve represents the marginal benefit that Ann
receives from the streetlights. Suppose that Joe’s marginal benefit from the streetlights is
a constant amount equal to the vertical distance A–C. Providing F streetlights is _____
because the marginal social benefit is _____ the marginal cost.
A)
efficient; equal to
B)
efficient; greater than
C)
inefficient; greater than
D)
inefficient; less than

Page 39
167.
(Figure: Market Failure) Use Figure: Market Failure. Suppose that the supply curve
represents the marginal cost of providing streetlights in a neighborhood where only two
people, Ann and Joe, reside. The demand curve represents the marginal benefit that Ann
receives from the streetlights. Suppose that Joe’s marginal benefit from the streetlights is
a constant amount equal to the vertical distance A–C. Providing G streetlights is _____
because the marginal social benefit is _____ the marginal cost.
A)
efficient; equal to
B)
efficient; greater than
C)
inefficient; greater than
D)
inefficient; less than
168.
(Figure: Market Failure) Use Figure: Market Failure. Suppose that the supply curve
represents the marginal cost of providing streetlights in a neighborhood where only two
people, Ann and Joe, reside. The demand curve represents the marginal benefit that Ann
receives from the streetlights. Suppose that Joe’s marginal benefit from the streetlights is
a constant amount equal to the vertical distance A–C. The market would provide _____
streetlights. The efficient quantity of streetlights is _____.
A)
0; F
B)
F; F
C)
E; F
D)
F; G
169.
(Figure: Market Failure) Use Figure: Market Failure. Suppose that the figure represents
the demand for and marginal private cost per pound of shrimp in the bay. The additional
cost of the shrimp due to the depletion of the common resource is equal to the vertical
distance A–C. Without government intervention, the market will produce _____ pounds
of shrimp.
A)
0
B)
E
C)
F
D)
G
170.
(Figure: Market Failure) Use Figure: Market Failure. Suppose that the figure represents
the demand for and marginal private cost per pound of shrimp in the bay. The additional
cost of the shrimp due to the depletion of the common resource is equal to the vertical
distance A–C. Without government intervention, the price of shrimp will be _____ per
pound.
A)
0
B)
A
C)
B
D)
C

Page 40
171.
(Figure: Market Failure) Use Figure: Market Failure. Suppose that the figure represents
the demand for and marginal private cost per pound of shrimp in the bay. The additional
cost of the shrimp due to the depletion of the common resource is equal to the vertical
distance A–C. The output of F is _____ because the marginal social benefit is _____ the
marginal cost.
A)
efficient; equal to
B)
efficient; greater than
C)
inefficient; greater than
D)
inefficient; less than
172.
(Figure: Market Failure) Use Figure: Market Failure. Suppose that the figure represents
the demand for and marginal private cost per pound of shrimp in the bay. The additional
cost of the shrimp due to the depletion of the common resource is equal to the vertical
distance A–C. At output F, _____ shrimp is being produced.
A)
too much
B)
not enough
C)
the efficient amount of
D)
the socially optimum amount of
173.
(Figure: Market Failure) Use Figure: Market Failure. Suppose that the figure represents
the demand for and marginal private cost per pound of shrimp in the bay. The additional
cost of the shrimp due to the depletion of the common resource is equal to the vertical
distance A–C. The efficient output of shrimp is:
A)
0.
B)
E.
C)
F.
D)
G.
174.
(Figure: Market Failure) Use Figure: Market Failure. Suppose that the figure represents
the demand for and marginal private cost per pound of shrimp in the bay. The additional
cost of the shrimp due to the depletion of the common resource is equal to the vertical
distance A–C. The efficient price of shrimp is:
A)
0.
B)
A.
C)
B.
D)
C.
175.
A concert is excludable if the manager of the concert hall can prevent people who do not
have a ticket from entering.
A)
True
B)
False