Page 21
90.
(Figure: Three Firms that Pollute) Use Figure: Three Firms That Pollute. In the figure, at
what tax rate would firm C produce positive amount of pollution?
A)
$400
B)
$500
C)
$700
D)
$200
91.
Pigouvian taxes are designed to reduce:
A)
the marginal cost of production.
B)
the marginal benefit of consumption.
C)
external costs.
D)
external benefits.
92.
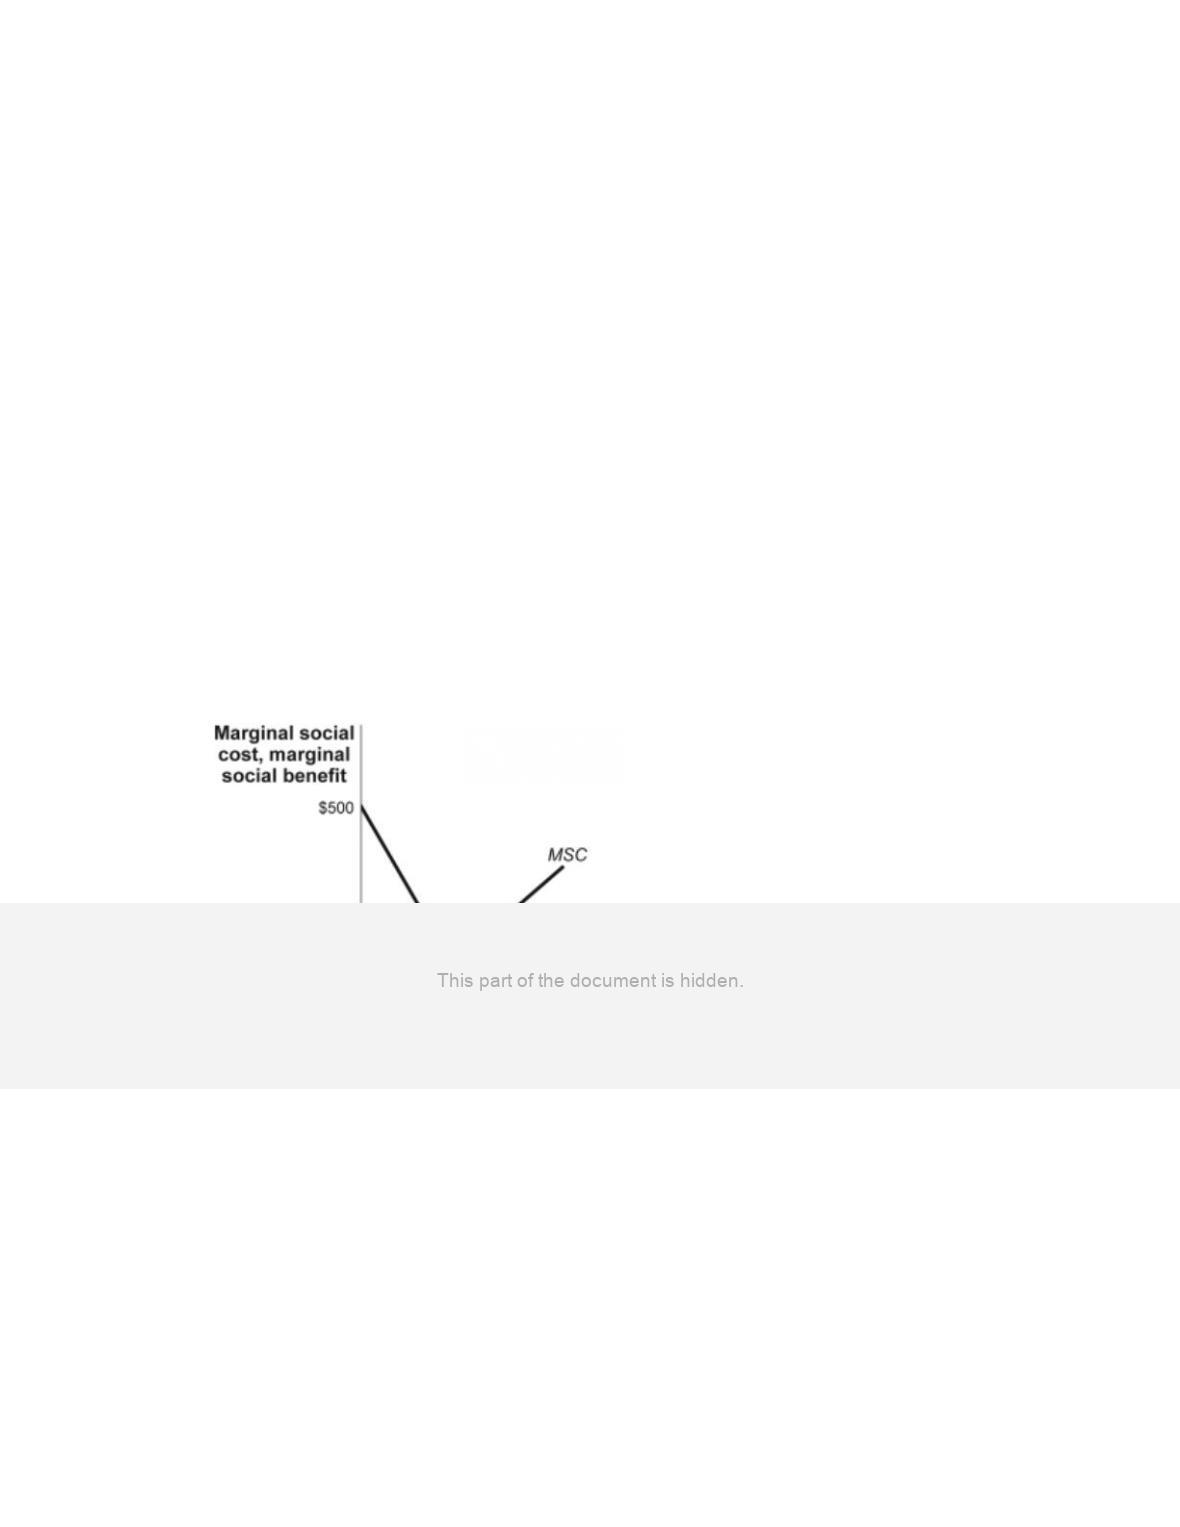
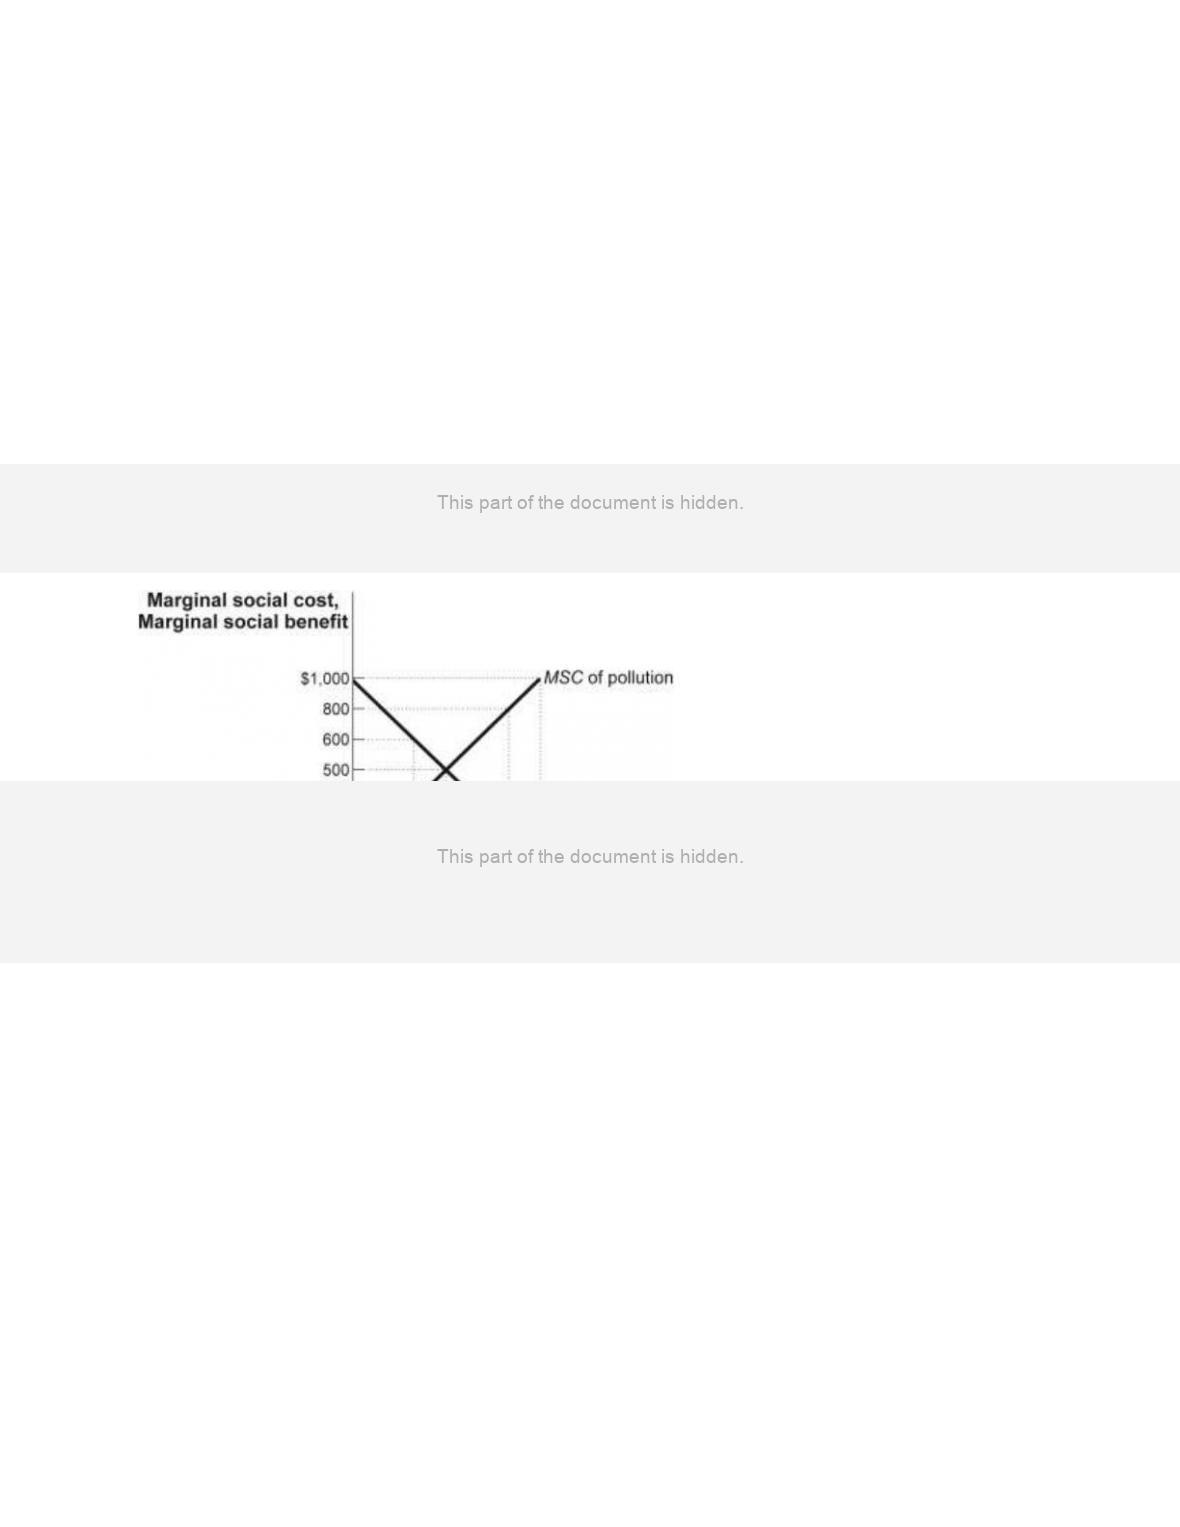
(Figure: The Optimal Quantity of Pollution) Use Figure: The Optimal Quantity of
Pollution. The figure shows the marginal social cost (MSC) and marginal social benefit
(MSB) for firms that pollute the air with sulfur dioxide. Using the figure, the optimal
Pigouvian tax per unit of pollution is:
Figure: The Optimal Quantity of Pollution
A)
$500.
B)
$250.
C)
$167.
D)
$83.
Page 22
93.
If an emissions tax is too low:
A)
there will be too little pollution.
B)
there will be too much pollution.
C)
the marginal social cost of pollution will be less than the marginal social benefit of
pollution.
D)
there could be either too much or too little pollution.
94.
Taxes are a more effective method of controlling pollution than are environmental
standards because:
A)
standards allow greater flexibility.
B)
standards require less information.
C)
standards never require the efficient level of output.
D)
taxes encourage reducing pollution at the lowest possible cost.
95.
The government has adopted an emissions tax if it:
A)
transfers the ownership of city air to a private firm that charges automobile drivers
a profit-maximizing price, based in part on the pollution capacity of the
atmosphere.
B)
charges automobile drivers $0.10 for each unit of automobile emissions.
C)
pays automobile drivers $0.10 for each 10% reduction in automobile emissions.
D)
specifies the type of catalytic converter that must be used to reduce automobile
emissions.
96.
For the same amount of pollution emitted, an emissions tax is said to be more efficient
than is an environmental standard because all polluters:
A)
emit pollution up to the point at which the marginal benefit of polluting is equal to
the emissions tax.
B)
emit the same amount of pollution, regardless of the marginal benefit of polluting.
C)
pay the same total tax bill for their pollution.
D)
reduce pollution emissions to zero.
97.
Licenses that are exchangeable and that enable the holder to pollute up to a specified
amount during a given period are called:
A)
emissions taxes.
B)
environmental standards.
C)
tradable emissions permits.
D)
Pigouvian taxes.
Page 23
98.
Tradable pollution permits are a:
A)
tax system for internalizing pollution costs to the market.
B)
subsidy system for charging consumers for the use of common property resources.
C)
system of voluntary negotiations between polluters and damaged parties.
D)
system of exchangeable licenses that enable the holder to pollute up to a specified
amount during a given period.
99.
Suppose the federal government determines the total level of municipal sewage that can
be discharged by cities along a river. If the cities are able to buy and sell rights to the
total discharge level among themselves, then the government’s environmental policy
includes:
A)
emissions taxes.
B)
Pigouvian subsidies.
C)
tradable pollution permits.
D)
command and control.
100.
Which example illustrates an environmental policy that uses tradable pollution permits?
A)
a charge of $0.10 to automobile drivers for a given level of emitted emissions
B)
paying automobile drivers $0.10 for each 10% reduction in automobile emissions
C)
allowing automobile drivers to buy and sell the right to emit a certain level of
automobile emissions
D)
ignoring pollution and letting private markets operate without government
interference
101.
Assume that the price of a tradable emissions permit for a ton of sulfur dioxide is $150.
Which statement is INCORRECT?
A)
A firm that buys permits has an incentive to limit pollution to the point at which the
marginal benefit of emissions is equal to $150.
B)
A firm that has more permits than it plans to use has an incentive to limit pollution
to the point at which the marginal benefit of emissions is equal to $150.
C)
The opportunity cost of emitting a ton of sulfur dioxide is $75 for all firms.
D)
The opportunity cost of emitting a ton of sulfur dioxide is $150 for all firms.
102.
With tradable emissions permits, the price of the permit is determined by:
A)
the government.
B)
the supply of and demand for permits.
C)
environmental protection organizations.
D)
the World Trade Organization.
Page 24
103.
Licenses that can be bought and sold by polluters and that enable the holder to pollute
up to a specified amount during a given period are called:
A)
emissions taxes.
B)
Pigouvian taxes.
C)
tradable emissions permits.
D)
environmental standards.
104.
Which example BEST describes tradable emissions permits?
A)
a tax system for internalizing emission costs to the market
B)
a subsidy system for encouraging production of goods with positive externalities
C)
a system of voluntary negotiations between polluters and damaged parties
D)
a system of licenses that can be bought and sold and that enable the holder to
pollute up to a specified amount during a given period
105.
Assume that the federal government determines the total level of pollutants that can be
discharged by city industries. A city is able to buy and sell the rights to this total
discharge level with other cities. This example illustrates a(n):
A)
emissions tax.
B)
Pigouvian tax.
C)
tradable emissions permit.
D)
environmental standard.
106.
When tradable emissions permits are used, if the demand for goods that produce
emissions shifts to the right, the equilibrium price of permits _____ and the equilibrium
quantity _____.
A)
decreases; increases
B)
increases; stays the same
C)
decreases; decreases
D)
stays the same; increases
107.
With tradable emissions permits, if the demand for goods that produce emissions shifts
to the left, the equilibrium price of permits _____ and the equilibrium quantity _____.
A)
increases; stays the same
B)
decreases; increases
C)
decreases; stays the same
D)
increases; increases

Page 25
108.
An advantage of tradable emissions permits is that:
A)
pollution costs are easier to measure than are emissions taxes.
B)
nondegradable pollutants can be more easily controlled than can degradable
pollutants.
C)
the value that future generations place on pollution damages can be determined.
D)
they provide incentives for firms to develop technologies that are less polluting.
109.
Which example illustrates an environmental policy based on tradable emission permits?
A)
a charge to companies of $1 for every 100 units of pollutants emitted
B)
paying companies $1 for each 10% reduction in emissions
C)
allowing companies to buy and sell the right to a certain level of emissions
D)
ignoring pollution and letting private markets operate without government
interference
110.
If the number of available tradable emissions permits is decreased, the equilibrium price
of the permits _____ and the equilibrium quantity of emissions _____.
A)
decreases; decreases
B)
increases; increases
C)
increases; decreases
D)
decreases; increases
111.
If the number of available tradable emissions permits increases, the equilibrium price of
the permits _____ and the equilibrium quantity _____.
A)
increases; does not change
B)
increases; increases
C)
decreases; does not change
D)
decreases; increases
112.
There are two plants in an industry. To reduce pollution, the government has imposed
environmental standards forcing each plant to cut emissions by 60%. At the emissions
standard, the marginal social benefit of pollution for plant A is $500, and the marginal
social benefit of pollution for plant B is $125. The same level of pollution can be
achieved at a lower cost by:
A)
forcing plant A to reduce emissions and allowing plant B to increase emissions.
B)
allowing plant A to pollute more and requiring plant B to pollute less.
C)
forcing both plants to reduce emissions.
D)
allowing both plants to pollute more.
Page 26
113.
With tradable emissions permits, the main problem is determining the _____, while with
emissions taxes, the main problem is determining the _____.
A)
optimal quantity of pollution; optimal tax rate
B)
optimal price of the permits; optimal level of pollution
C)
optimal quantity of pollution; marginal social benefit of pollution
D)
marginal social cost of pollution; optimal tax rate
Use the following to answer questions 114-117:
Figure: City with Two Polluters
114.
(Figure: City with Two Polluters) Use Figure: City with Two Polluters. If the
government does not intervene in the pollution market, equilibrium will occur where
firm A produces _____ tons of pollution and firm B produces _____ tons of pollution,
for a total of _____ tons.
A)
2,000; 2,000; 4,000
B)
0; 1,000; 1,000
C)
1,000; 0; 1,000
D)
800; 1,400; 2,200
Page 27
115.
(Figure: City with Two Polluters) Use Figure: City with Two Polluters. If the
government wants to limit total pollution to 2,200 tons, it could impose an emissions tax
of _____ on both firms.
A)
$100
B)
$200
C)
$300
D)
$400
116.
(Figure: City with Two Polluters) Use Figure: City with Two Polluters. If the
government imposed an emissions tax of $400, firm A would produce _____ tons of
pollution and firm B would produce _____ tons of pollution.
A)
200; 400
B)
400; 1,200
C)
800; 1,400
D)
1,200; 1,600
117.
(Figure: City with Two Polluters) Use Figure: City with Two Polluters. If the
government issued licenses to emit a total of 1,600 tons of pollution, the market price to
emit 1 ton of pollution would equal:
A)
$100.
B)
$200.
C)
$300.
D)
$400.
118.
By using _____ to reduce emissions, the government can ensure that the marginal
benefit of an additional unit of pollution is the same for all polluters.
A)
an environmental standard
B)
a subsidy
C)
a ban on pollution
D)
either an emissions tax or a tradable emissions permit
119.
An external benefit is a:
A)
negative externality.
B)
benefit that accrues to domestic firms as a result of the actions of foreign (external)
firms.
C)
benefit that accrues to foreign (external) firms as a result of the actions of domestic
firms.
D)
benefit that individuals or firms confer on others without receiving compensation.
Page 28
120.
External benefits are associated with the production of batteries. Without government
regulation, the market will:
A)
produce too many batteries.
B)
price batteries at less than the marginal social cost.
C)
price batteries at less than the marginal social benefit.
D)
price batteries above the marginal social cost.
121.
Which activity generates a positive externality?
A)
You buy a new car and find $5,000 in the door panel.
B)
Your next-door neighbor mows the lawn at 6 A.M.
C)
Your next-door neighbor installs a bat house, and the bats eat mosquitoes.
D)
Joe buys health insurance but decides not to take the time to get a flu shot.
122.
Which statement describes a positive externality?
A)
Sam dug a pond, so he could go fishing, but the pond has contributed to an
explosion of mosquitoes in your neighborhood.
B)
Sam has dozens of cats, and they come into your yard to hunt the birds that come to
your birdbath.
C)
Sam buys a dilapidated house, renovates it, and increases the property values of all
the houses in the neighborhood.
D)
Liquid waste from Sam’s chicken farm flows into a neighbor’s well water.
123.
A Pigouvian subsidy is:
A)
designed to discourage activities generating externalities.
B)
designed to encourage activities generating external benefits.
C)
appropriate when the marginal social cost curve is above the marginal cost of
production curve.
D)
appropriate when the marginal social cost curve and the marginal social benefit
curve intersect at an inefficient level.
124.
Suppose that the production of roses generates a positive externality in that travelers
enjoy the scenic beauty of the garden. An appropriate government policy yielding the
efficient outcome would be a:
A)
Pigouvian tax.
B)
Pigouvian subsidy.
C)
system of rose-production permits.
D)
reduction in transaction costs.

Page 29
125.
Betsy loves to garden, and her rose garden is enjoyed by everyone in her neighborhood.
Because her consumption of rosebushes provides a positive externality to the
community, the government should _____ because the market quantity of rosebushes is
_____ than the socially optimal quantity.
A)
provide a subsidy; greater
B)
impose a tax; lower
C)
provide a subsidy; lower
D)
impose a tax; greater
126.
Which example illustrates a policy solution to inefficiency in the free market caused by
the stated externality?
A)
The city government imposes rent control. The externality is that housing’s
quantity demanded exceeds the quantity supplied at the current price.
B)
The federal government imposes a minimum wage. The externality is that firms
pay too little to their workers.
C)
The government offers free childhood immunizations. The externality is that an
immunized child cannot transmit disease to others.
D)
The federal government provides national defense. The externality is that people
can’t be excluded from national defense, even if they don’t pay for it.
127.
Which example is a good or market activity that is associated with a positive
externality?
A)
smoking cigarettes
B)
listening to a new CD with earbuds
C)
innovation in the semiconductor industry
D)
an indoor classical music concert with tickets that cost $50
128.
When innovations by one firm are quickly emulated and improved on by rival firms in
the same industry or in other industries, it is:
A)
industrial espionage.
B)
illegal under most patents.
C)
technology spillover.
D)
technology takeover.
Page 30
Use the following to answer questions 129-139:
129.
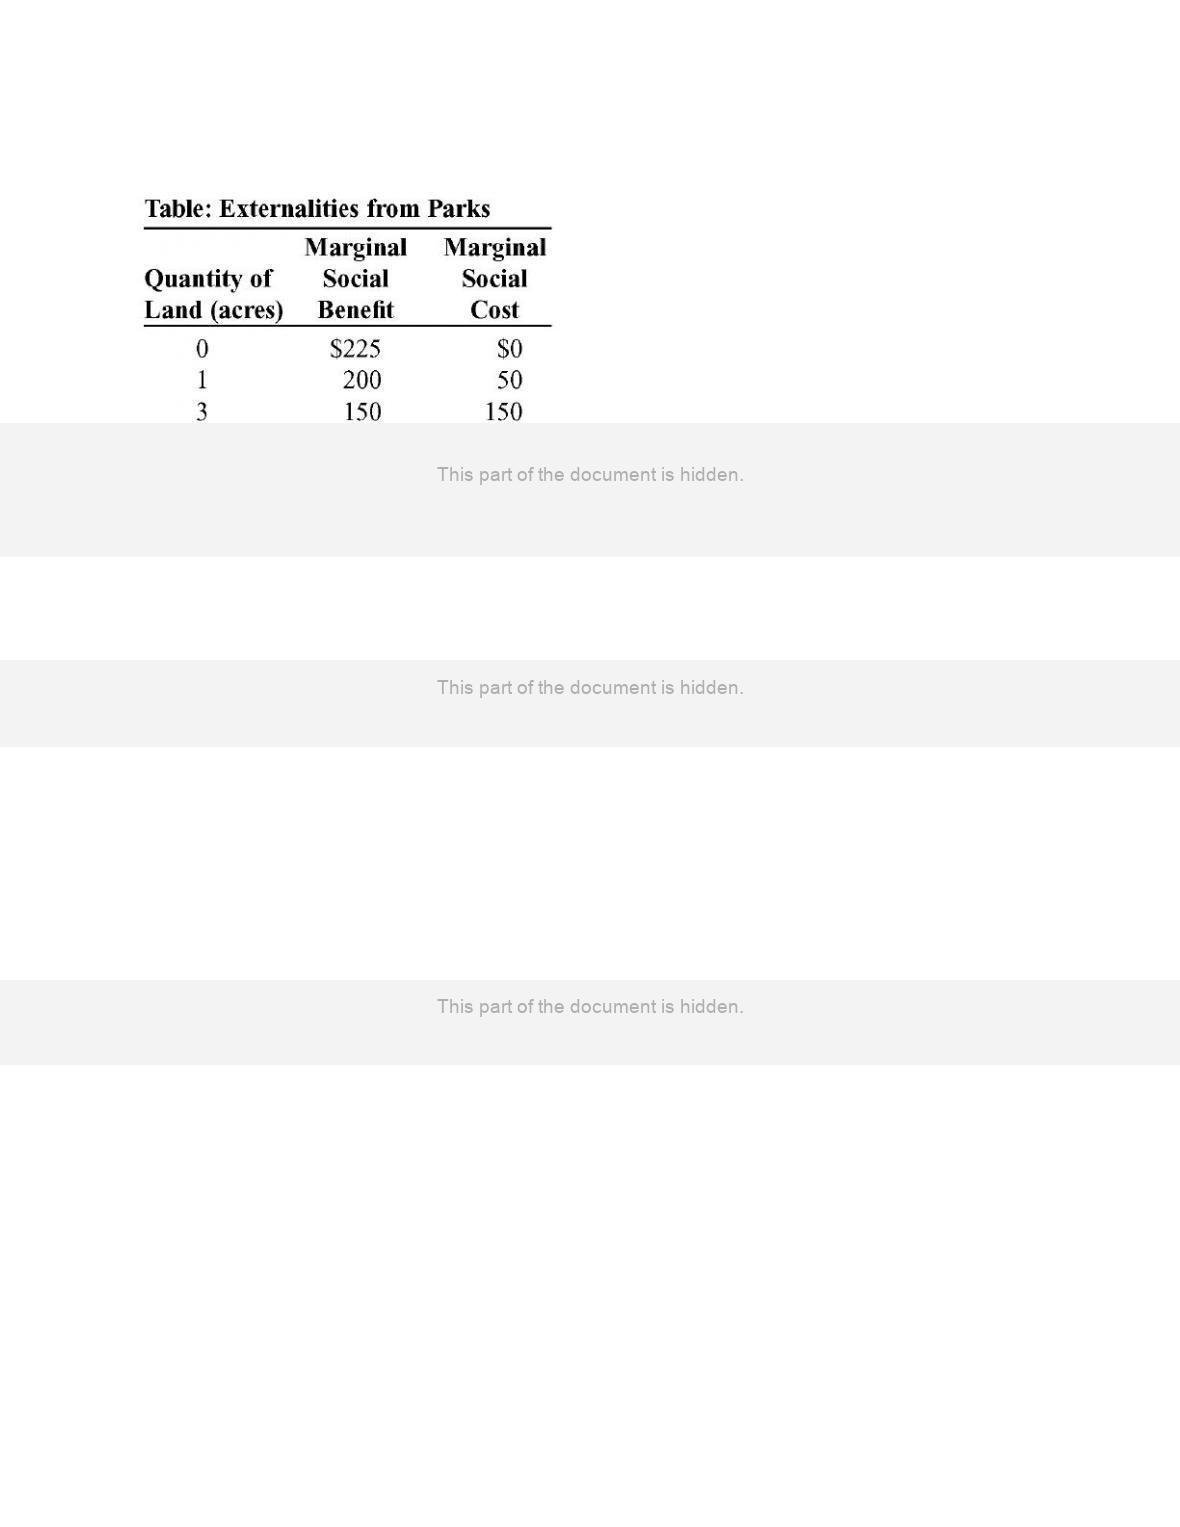
(Table: Externalities from Parks) Use: Table: Externalities from Parks. The shows the
marginal social benefit and the marginal social cost of preserving various amounts of
land in a city for a public park. Suppose that parks result in positive benefits to the
community as a whole but that the marginal private benefit that any one individual in
the community gets from parks is close to 0. Without government intervention, the
amount of land dedicated to the public park will be _____ acres.
A)
0
B)
1
C)
3
D)
9
130.
(Table: Externalities from Parks) Use: Table: Externalities from Parks. The table shows
the marginal social benefit and the marginal social cost of preserving various amounts
of land in a city for a public park. Suppose that parks result in positive benefits to the
community as a whole but the marginal private benefit that any one individual in the
community gets from parks is close to 0. Without government intervention, at the
amount of land dedicated to the public park the marginal social benefit will be:
A)
$225.
B)
$150.
C)
$100.
D)
$0.

Page 31
131.
(Table: Externalities from Parks) Use: Table: Externalities from Parks. The table shows
the marginal social benefit and the marginal social cost of preserving various amounts
of land in a city for a public park. Suppose that parks result in positive benefits to the
community as a whole but that the marginal private benefit that any one individual in
the community gets from parks is close to 0. Without government intervention, at the
amount of land dedicated to the public park the marginal social cost will be:
A)
$225.
B)
$150.
C)
$100.
D)
$0.
132.
(Table: Externalities from Parks) Use: Table: Externalities from Parks. The table shows
the marginal social benefit and the marginal social cost of preserving various amounts
of land in a city for a public park. Suppose that parks result in positive benefits to the
community as a whole but that the marginal private benefit that any one individual in
the community gets from parks is close to 0. The socially optimum amount of land
dedicated to the public park will be _____ acres.
A)
0
B)
1
C)
3
D)
9
133.
(Table: Externalities from Parks) Use: Table: Externalities from Parks. The table shows
the marginal social benefit and the marginal social cost of preserving various amounts
of land in a city for a public park. Suppose that parks result in positive benefits to the
community as a whole but that the marginal private benefit that any one individual in
the community gets from parks is close to 0. At the socially optimum amount of land
dedicated to the public park, the marginal social benefit will be:
A)
$225.
B)
$150.
C)
$100.
D)
$0.

134.
(Table: Externalities from Parks) Use: Table: Externalities from Parks. The table shows
the marginal social benefit and the marginal social cost of preserving various amounts
of land in a city for a public park. Suppose that parks result in positive benefits to the
community as a whole but that the marginal private benefit that any one individual in
the community gets from parks is close to 0. At the socially optimum amount of land
dedicated to the public park, the marginal social cost will be:
A)
$225.
B)
$150.
C)
$100.
D)
$0.
135.
(Table: Externalities from Parks) Use: Table: Externalities from Parks. The table shows
the marginal social benefit and the marginal social cost of preserving various amounts
of land in a city for a public park. Suppose that parks result in positive benefits to the
community as a whole but that the marginal private benefit that any one individual in
the community gets from parks is close to 0. If the government wants to achieve the
optimum amount of land for the park, it could use a Pigouvian _____ of _____ per park
acre.
A)
tax; $300
B)
tax; $150
C)
subsidy; $150
D)
subsidy; $450
136.
(Table: Externalities from Parks) Use: Table: Externalities from Parks. The table shows
the marginal social benefit and the marginal social cost of preserving various amounts
of land in a city for a public park. Suppose that parks result in positive benefits to the
community as a whole but that the marginal private benefit that any one individual in
the community gets from parks is close to 0. If 1 acre is dedicated to the park, this
outcome is _____ because _____.
A)
efficient; MSB = MSC
B)
efficient; MSB > MSC
C)
inefficient; MSB > MSC
D)
inefficient; MSB < MSC
Page 33
137.
(Table: Externalities from Parks) Use: Table: Externalities from Parks. The table shows
the marginal social benefit and the marginal social cost of preserving various amounts
of land in a city for a public park. Suppose that parks result in positive benefits to the
community as a whole but that the marginal private benefit that any one individual in
the community gets from parks is close to 0. If 1 acre is dedicated to the park, the park
is _____ from a social perspective.
A)
too large
B)
the socially optimum size
C)
too small
D)
the efficient size
138.
(Table: Externalities from Parks) Use: Table: Externalities from Parks. The table shows
the marginal social benefit and the marginal social cost of preserving various amounts
of land in a city for a public park. Suppose that parks result in positive benefits to the
community as a whole but that the marginal private benefit that any one individual in
the community gets from parks is close to 0. If 5 acres are dedicated to the park, this
outcome is _____ because _____.
A)
efficient; MSB = MSC
B)
efficient; MSB > MSC
C)
inefficient; MSB > MSC
D)
inefficient; MSB < MSC
139.
(Table: Externalities from Parks) Use: Table: Externalities from Parks. The table shows
the marginal social benefit and the marginal social cost of preserving various amounts
of land in a city for a public park. Suppose that parks result in positive benefits to the
community as a whole but that the marginal private benefit that any one individual in
the community gets from parks is close to 0. If 5 acres are dedicated to the park, the
park is _____ from a social perspective.
A)
too large
B)
the socially optimum size
C)
too small
D)
the efficient size
140.
Tony has a cell phone, and his service provider is Verizon. When he calls his wife,
Meleah, who is also a Verizon customer, he does not have to pay for those minutes. The
more Verizon customers there are in the market, the more benefit Tony receives. This is:
A)
a network externality.
B)
the Coase theorem.
C)
a Pigouvian subsidy.
D)
a technology spillover.

Page 34
Use the following to answer questions 141-143:
Figure: The Socially Optimal Quantity of Pollution
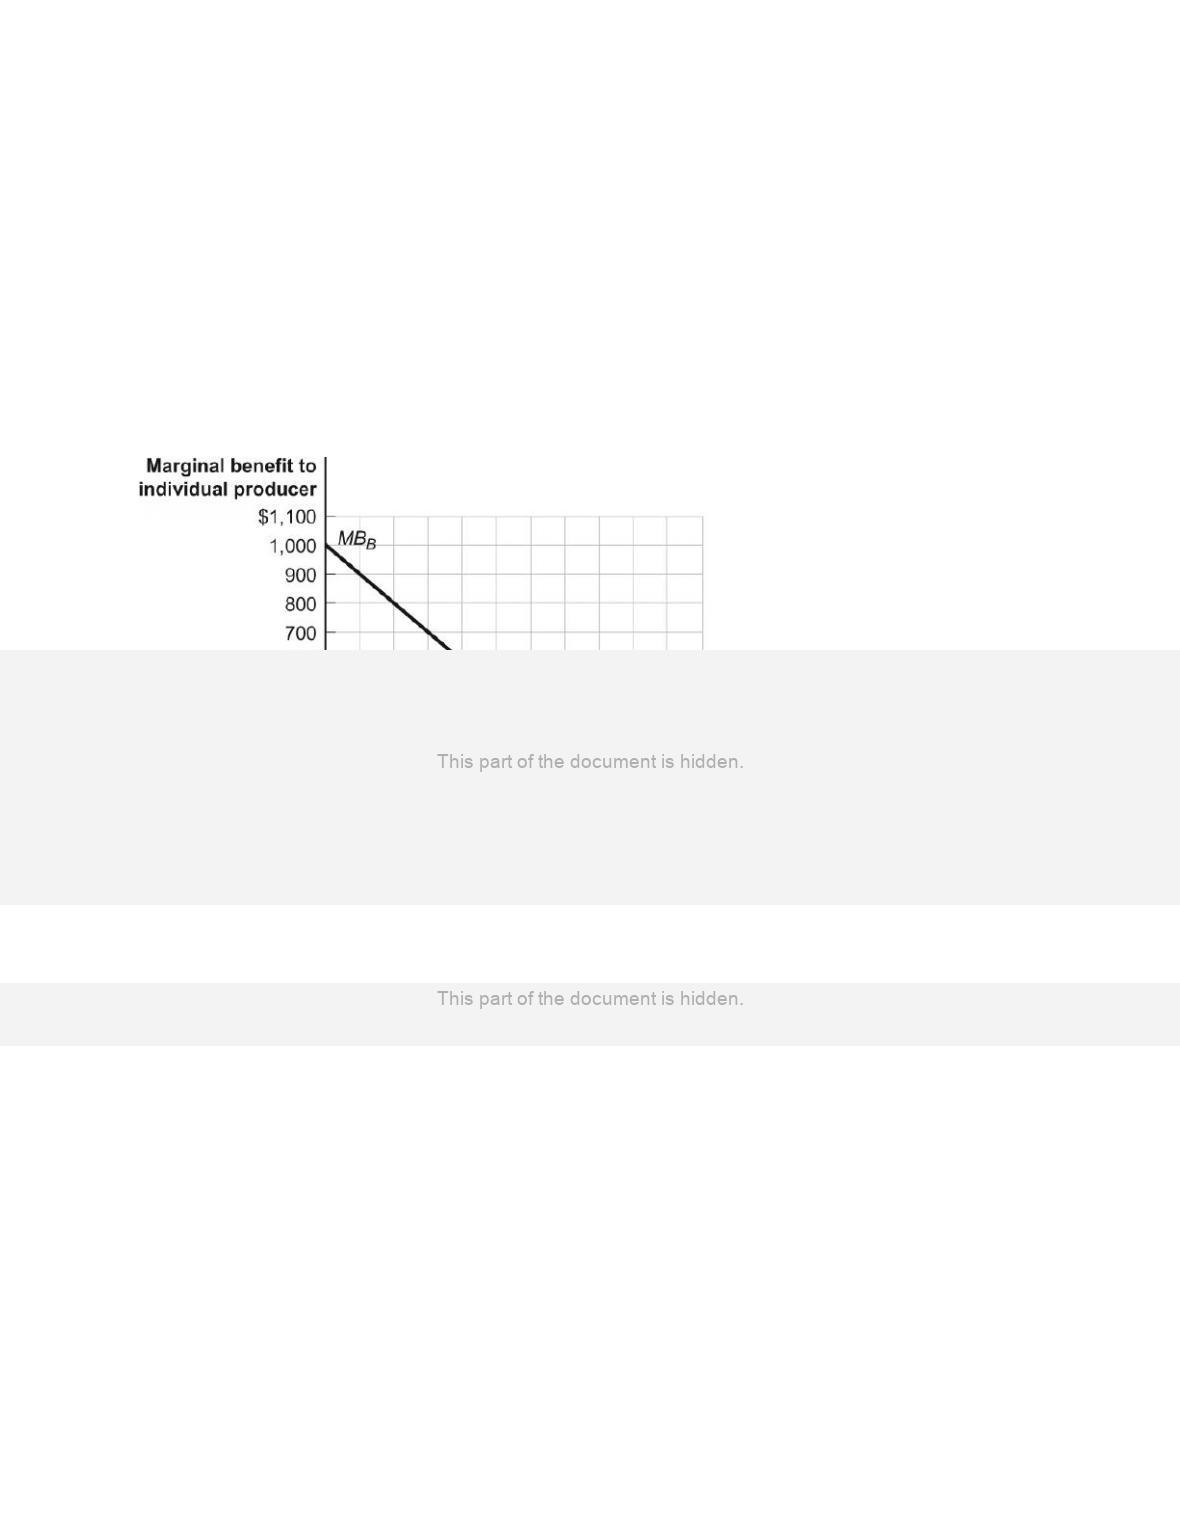
141.
(Figure: The Socially Optimal Quantity of Pollution) Use Figure: The Socially Optimal
Quantity of Pollution. In the figure, firms are the only beneficiaries of pollution, and
costs are borne solely by others in the society. The optimal level of pollution is:
A)
zero since no pollution is best for society.
B)
where the marginal social benefit curve intersects the quantity axis.
C)
where the marginal social cost curve intersects the quantity axis.
D)
where the marginal social benefit curve intersects the marginal social cost curve.
142.
(Figure: The Socially Optimal Quantity of Pollution) Use Figure: The Socially Optimal
Quantity of Pollution. In the figure, firms are the only beneficiaries of pollution, and
costs are borne solely by others in the society. Without government intervention:
A)
firms will continue to pollute until the marginal benefit to them is zero.
B)
firms will continue to pollute until the marginal benefit to them is $200.
C)
the optimal quantity of pollution will occur.
D)
The outcome cannot be determined without more information.
143.
(Figure: The Socially Optimal Quantity of Pollution) Use Figure: The Socially Optimal
Quantity of Pollution. In the figure, firms are the only beneficiaries of pollution, and
costs are borne solely by others in the society. The optimal quantity of pollution could
be achieved:
A)
with a Pigouvian subsidy.
B)
through a free market solution
C)
with a Pigouvian tax.
D)
by subsidizing consumers of the products produced by the firms.
Page 35
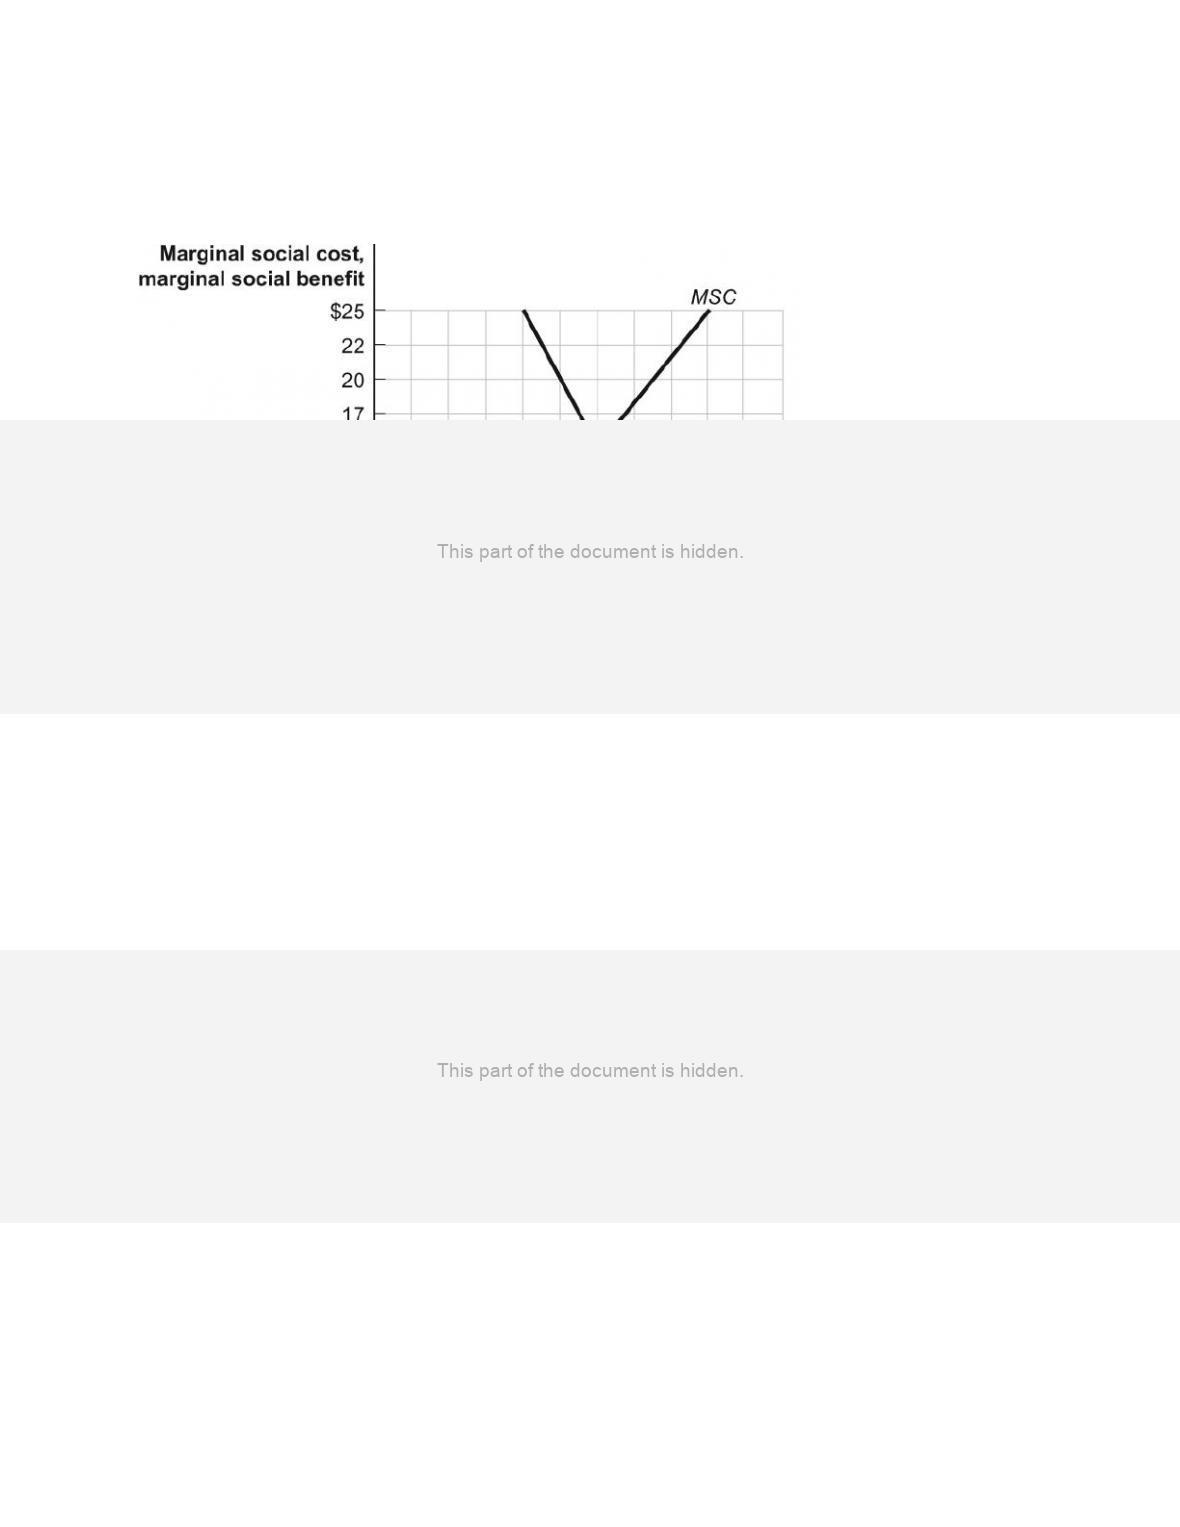
Use the following to answer questions 144-152:
Figure: Efficiency and Pollution
144. (Figure: Efficiency and Pollution) Use Figure: Efficiency and Pollution. Assume that firms
are the only beneficiaries of pollution and that costs are borne solely by others in the society. In
the absence of government intervention, the amount of pollution will be _____ tons.
A) 20
B) 30
C) 40
D) 45
Page 36
144.
(Figure: Efficiency and Pollution) Use Figure: Efficiency and Pollution. Assume that
firms are the only beneficiaries of pollution and that costs are borne solely by others in
the society. In the absence of government intervention, the marginal social cost of
pollution will exceed the marginal benefit of pollution by:
A)
$25.00.
B)
$16.67.
C)
$15.00.
D)
$0.00.
145.
(Figure: Efficiency and Pollution) Use Figure: Efficiency and Pollution. Assume that
firms are the only beneficiaries of pollution and that costs are borne solely by others in
the society. In the absence of government intervention, the marginal social cost of
pollution will equal _____, and the marginal social benefit of pollution will equal
_____.
A)
$25; $5
B)
$5; $25
C)
$15; $15
D)
$25; $0
146.
(Figure: Efficiency and Pollution) Use Figure: Efficiency and Pollution. Assume that
firms are the only beneficiaries of pollution and that costs are borne solely by others in
the society. The socially optimal quantity of pollution is _____ tons.
A)
0
B)
20
C)
30
D)
45
147.
(Figure: Efficiency and Pollution) Use Figure: Efficiency and Pollution. Assume that
firms are the only beneficiaries of pollution and that costs are borne solely by others in
the society. If this market produced _____ tons of pollution, then _____.
A)
30; it would be efficient
B)
45; marginal social cost would be less than marginal social benefit
C)
20; marginal social benefit would be less than marginal social cost
D)
20; the marginal social benefit would be $7.
Page 37
148.
(Figure: Efficiency and Pollution) Use Figure: Efficiency and Pollution. Assume that
firms are the only beneficiaries of pollution and that costs are borne solely by others in
the society. An optimal Pigouvian tax of _____ per ton of pollution can move this
market to the socially optimal quantity of pollution.
A)
$5
B)
$15
C)
$25
D)
$45
149.
(Figure: Efficiency and Pollution) Use Figure: Efficiency and Pollution. Assume that
firms are the only beneficiaries of pollution and that costs are borne solely by others in
the society. A Pigouvian tax of $10 per acre of pollution will result in a quantity of
pollution for which the:
A)
marginal social benefit is less than the marginal social cost.
B)
marginal social benefit exceeds the marginal social cost.
C)
marginal social benefit equals the marginal social cost.
D)
resources are allocated efficiently.
150.
(Figure: Efficiency and Pollution) Use Figure: Efficiency and Pollution. Assume that
firms are the only beneficiaries of pollution and that costs are borne solely by others in
the society. If the government imposed an environmental standard that did not allow the
quantity of pollution to exceed 20 tons, there would be:
A)
a socially optimal quantity of pollution.
B)
too little pollution because its marginal social benefit would exceed its marginal
social cost.
C)
too much pollution because its marginal social cost would exceed its marginal
social benefit.
D)
too much pollution because any pollution is too much from an economist’s
perspective.
151.
(Figure: Efficiency and Pollution) Use Figure: Efficiency and Pollution. Assume that
firms are the only beneficiaries of pollution and that costs are borne solely by others in
the society. If the government imposed an environmental standard that did NOT allow
the quantity of pollution to exceed 40 tons, there would be:
A)
a socially optimal quantity of pollution.
B)
too little pollution because its marginal social benefit would exceed its marginal
social cost.
C)
too much pollution because its marginal social cost would exceed its marginal
social benefit.
D)
too much pollution because any pollution is too much from an economist’s
perspective.
Page 38
152.
(Figure: Efficiency and Pollution) Use Figure: Efficiency and Pollution. Assume that
firms are the only beneficiaries of pollution and that costs are borne solely by others in
the society. If the government imposed an environmental standard that did NOT allow
the quantity of pollution to exceed 30 tons, there would be:
A)
a socially optimal quantity of pollution.
B)
too little pollution because its marginal social benefit would exceed its marginal
social cost.
C)
too much pollution because its marginal social cost would exceed its marginal
social benefit.
D)
too much pollution because any pollution is too much from an economist’s
perspective.
153.
(Figure: MSB and MSC of Pollution) Use Figure: MSB and MSC of Pollution. Assume
that firms are the only beneficiaries of pollution and that costs are borne solely by others
in the society. What level of pollution would be emitted in a market economy without
government regulation?
A)
Q1
B)
Q2
C)
Q3
D)
Q4