Use the following to answer question 254:
254.
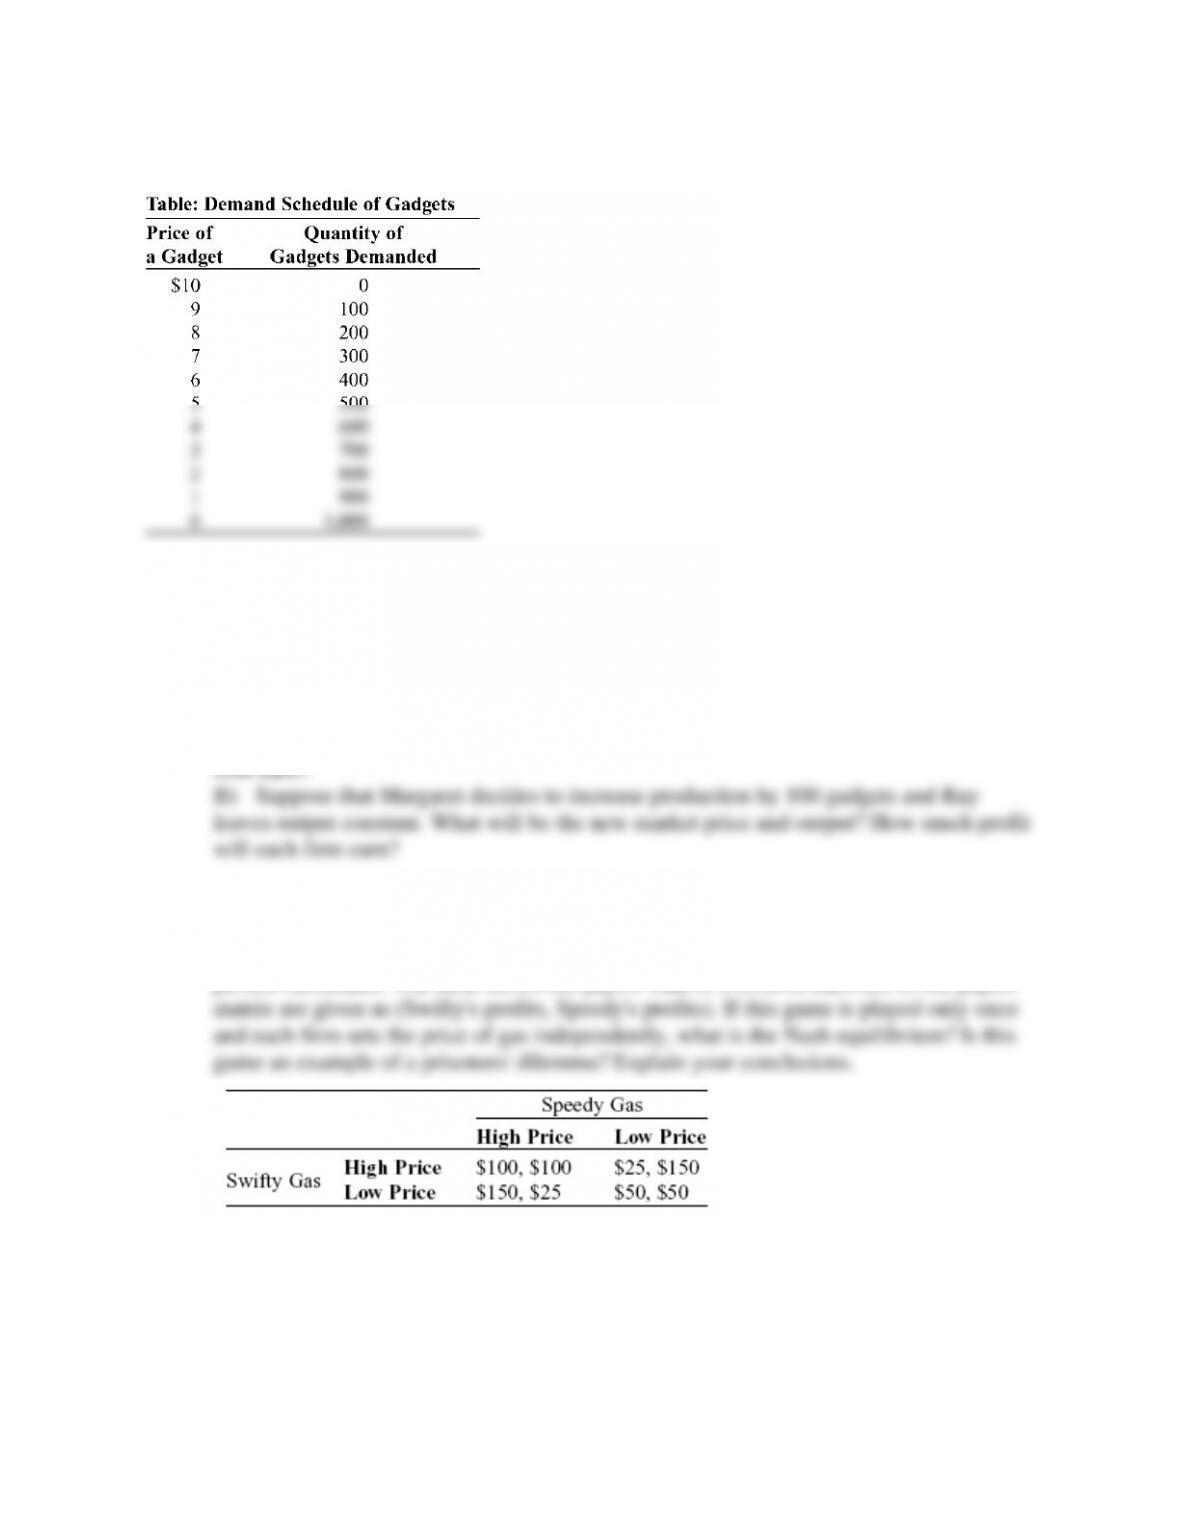
(Table: Demand Schedule of Gadgets) Use Table: The Market for Gadgets. Two
producers, Margaret and Ray, dominate the market. Each firm can produce gadgets at
marginal costs of zero and without fixed costs.
A) If these firms form a cartel to maximize joint profits, what output level will be
produced and at what price? If the output is shared evenly, how much profit will each
firm earn?
B) Suppose that Margaret decides to increase production by 100 gadgets and Ray
leaves output constant. What will be the new market price and output? How much profit
will each firm earn?
255.
There are only two gas stations, Swifty Gas and Speedy Gas, in a small town. Each firm
can set either a high price or a low price; customers view these two firms as nearly
perfect substitutes. The table shows the payoff matrix. Profits in each cell of the payoff
matrix are given as (Swifty’s profits, Speedy’s profits). If this game is played only once
and each firm sets the price of gas independently, what is the Nash equilibrium? Is this
game an example of a prisoners’ dilemma? Explain your conclusions.
Page 60
256.
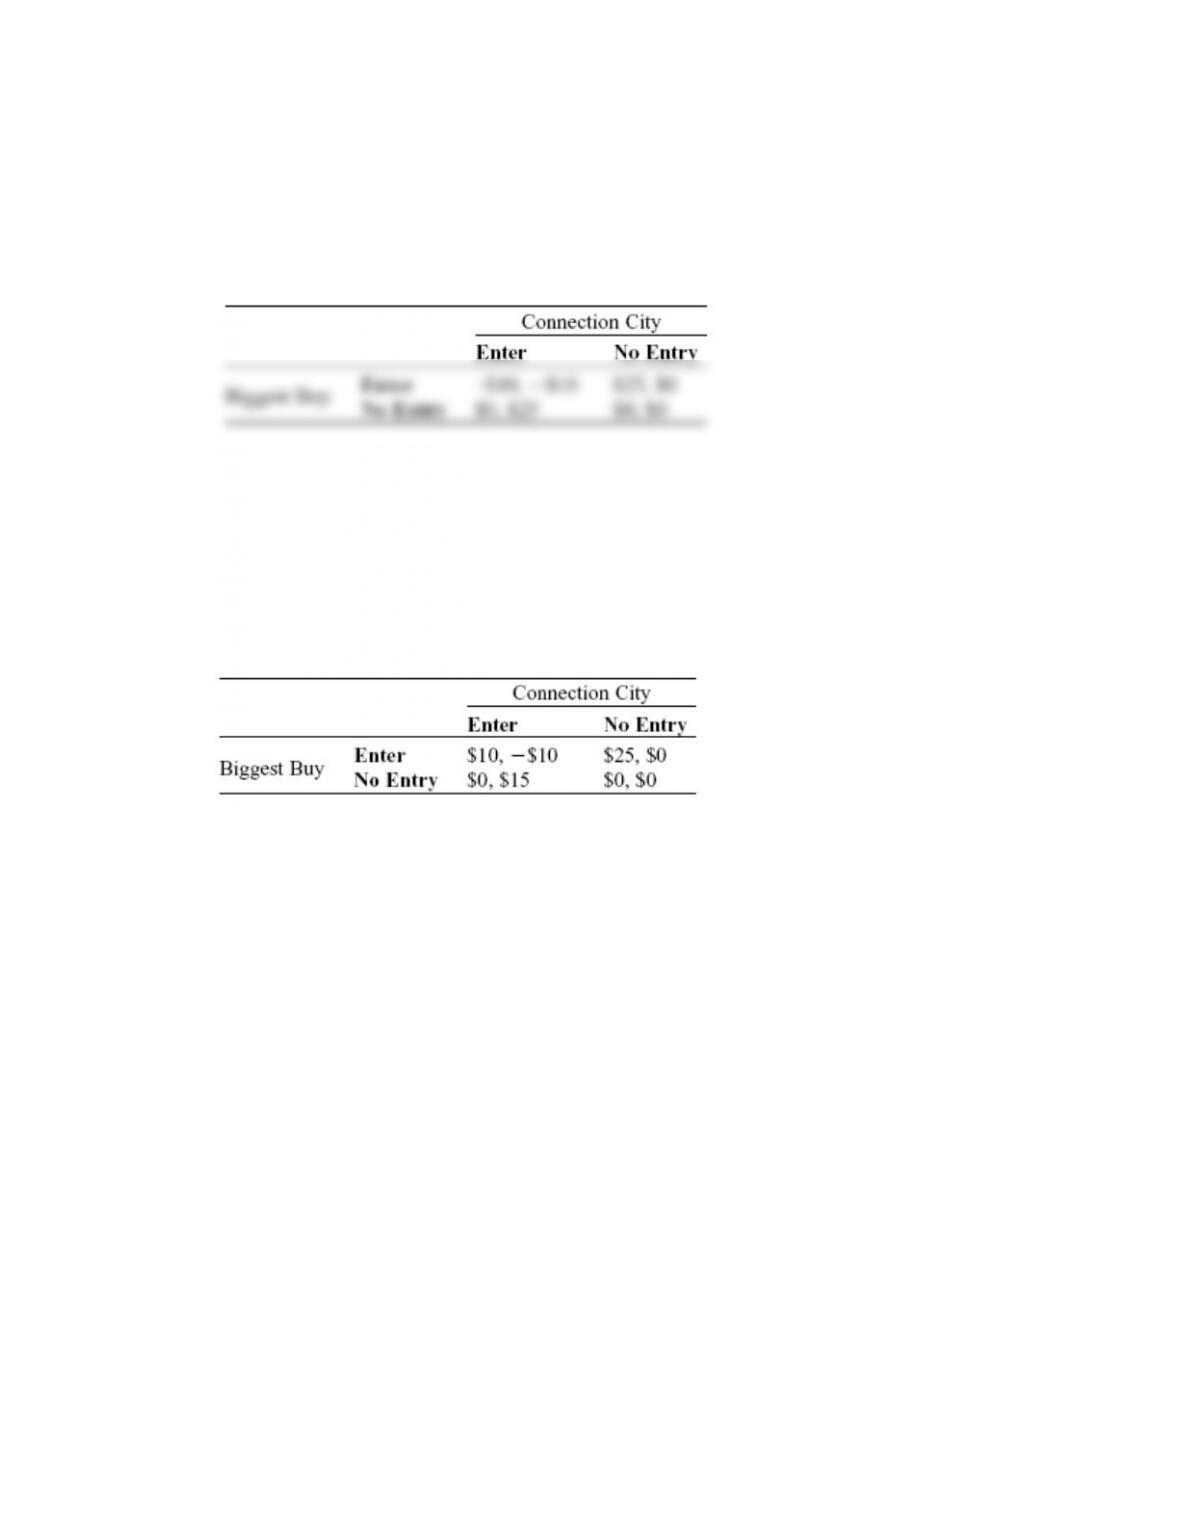
Two large electronic retailers, Biggest Buy and Connection City, are considering
entering a small town. Each firm can either enter the market or not. The table shows the
payoff matrix. Profits in each cell of the payoff matrix are given as (Biggest Buy’s
profits, Connection City’s profits). Are there any dominant strategies in the game? If this
game is played only once and each firm makes the entry decision independently, what
is/are the Nash equilibrium of this game? Explain your conclusions.
257.
Two electronic retailers, Biggest Buy and Connection City, are considering entering a
small town. Biggest Buy is the larger and more profitable of the two rivals. Each firm
can either enter the market or not. The table shows the payoff matrix. Profits in each cell
of the payoff matrix are given as (Biggest Buy’s profits, Connection City’s profits). Are
there any dominant strategies in the game? If this game is played only once and each
firm makes the entry decision independently, what is the Nash equilibrium of this game?
Explain your conclusions.
258.
Dell and Gateway are close competitors in the personal computer market. Suppose that
each year Dell and Gateway have to decide whether to spend money on costly research
and development (R&D). If both spend money on R&D, each firm will earn $30
million. If neither spends money on R&D, each firm will earn $40 million. If one firm
spends money on R&D and the other does not, the firm that engaged in R&D would
earn $45 million and the firm that did not would earn $25 million.
A) Use a payoff matrix to depict this problem.
B) What is the noncooperative solution to this game?
Page 61
259.
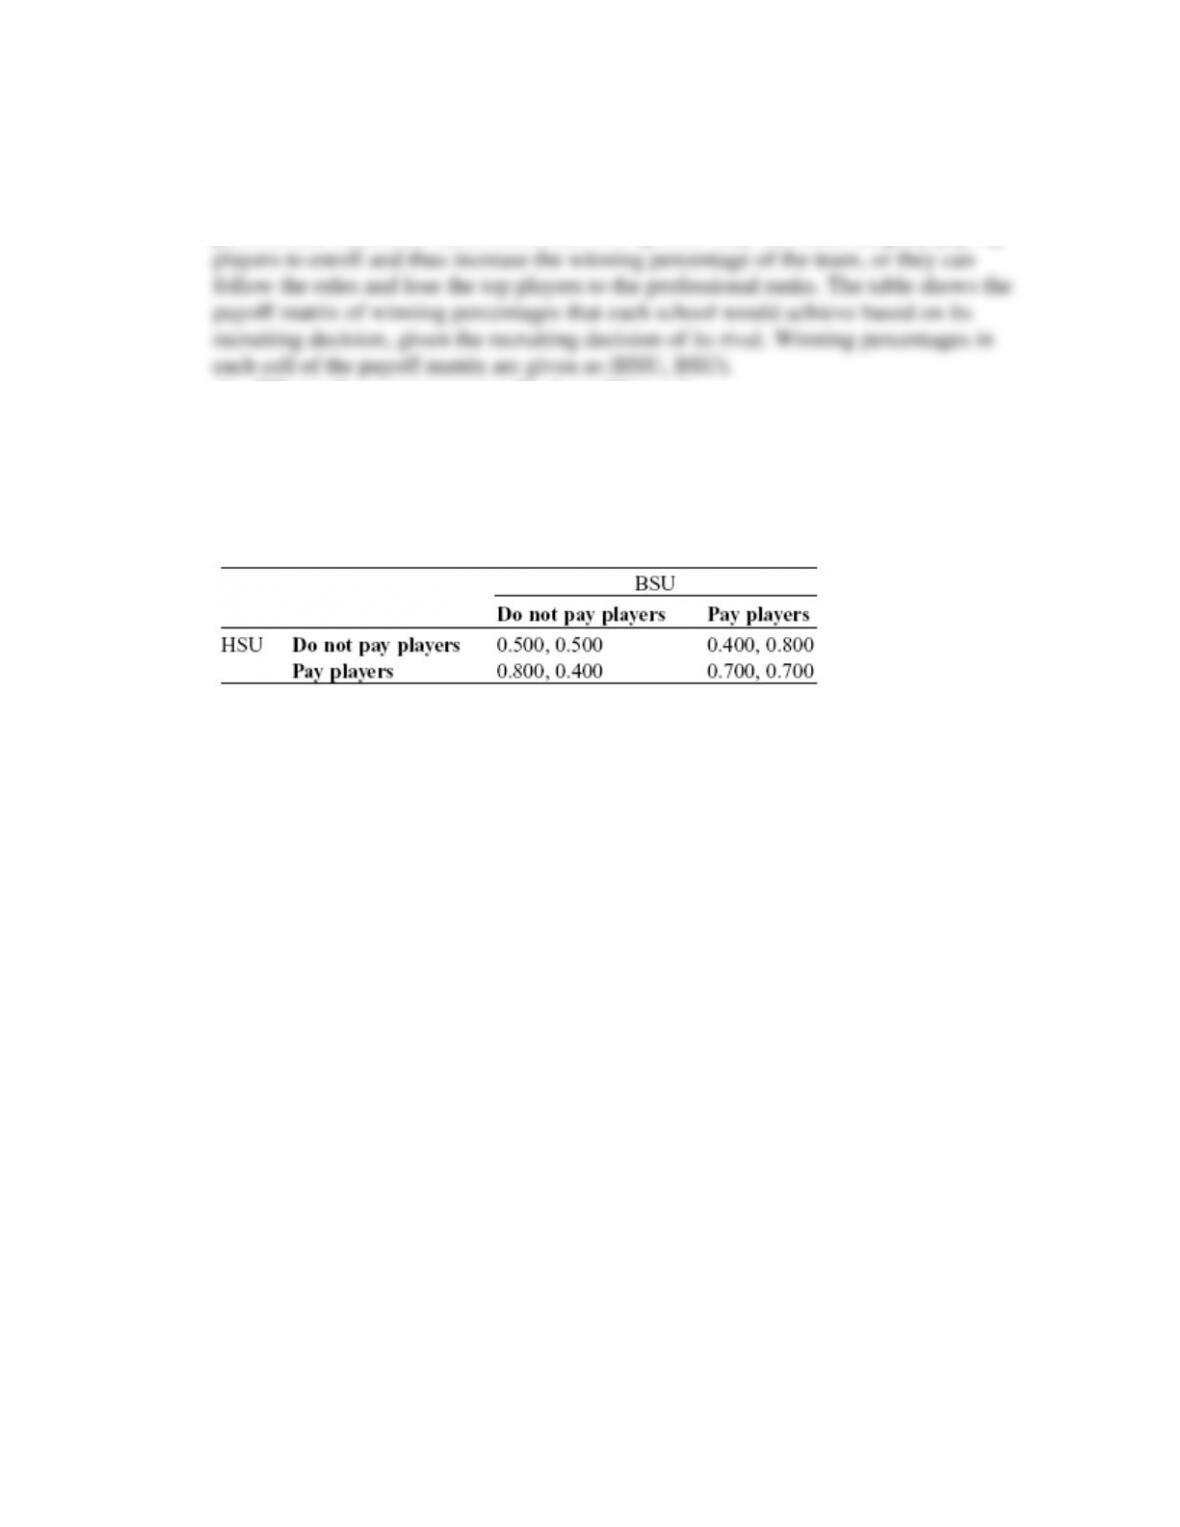
Two large universities, Humongous State (HSU) and Behemoth State (BSU), dominate
college basketball. Each basketball program aggressively recruits the best athletes to
attend the university, but the best athletes can skip college and jump immediately to
professional basketball. Each school has two options: they can either illegally pay top
players to enroll and thus increase the winning percentage of the team, or they can
follow the rules and lose the top players to the professional ranks. The table shows the
payoff matrix of winning percentages that each school would achieve based on its
recruiting decision, given the recruiting decision of its rival. Winning percentages in
each cell of the payoff matrix are given as (HSU, BSU).
A) What is the noncooperative Nash equilibrium?
B) Suppose each school considers the future and devises a tit-for-tat strategy. Neither
school will pay players to play basketball so long as the other does not. If one school
breaks the agreement and pays players, the other school will do the same until the first
school stops paying players. If both schools adopt the tit-for-tat strategy, what are the
winning percentages every year? Will this be effective at eliminating the illegal practice
of paying college athletes to play basketball?
260.
Why do the United States and many other countries have antitrust laws? What’s so
harmful about oligopoly that it warrants an entire body of law?
261.
Suppose two gas stations operate at the same busy intersection. You notice that the
posted prices are almost always the same. Assuming that these firms are engaged in tacit
price collusion, can we automatically conclude that there is no competition for
customers between the two stations?
262.
Oligopolies are industries:
A)
dominated by one seller who shares market power equally with all other sellers.
B)
made up of few firms, each with some market power and therefore aware of their
interdependence with the other firms.
composed of many buyers and sellers, all of whom are price takers.
that are the same as monopolistically competitive industries, except that they sell a
standardized product.
Page 62
263.
An oligopoly may result from:
A)
increasing returns to scale.
B)
standardization of a product.
C)
low or no barriers to entry.
D)
price-taking conditions for both buyers and sellers.
264.
If the Herfindahl–Hirschman index (HHI) for an industry is 300, the industry is
considered:
A)
unconcentrated.
B)
highly concentrated.
C)
oligopolistic.
D)
monopolistic.
265.
Suppose there are 10 identical firms in an industry and each produces 10% of the total
market sales. The HHI for this industry would indicate that the industry is:
A)
unconcentrated.
B)
monopolistic.
C)
oligopolistic.
D)
It cannot be determined from the information provided.
266.
An industry is made up of five firms. Three of the firms make up 20% of the total
market sales, one firm makes up 25%, and the remaining firm makes up 15%. What is
the HHI for this industry?
A)
100
B)
1,200
C)
2,050
D)
1,800
267.
If an industry initially has an HHI of 1,250, a merger between two of the largest (in
terms of market share) firms in the industry:
A)
would be allowed to occur since it would increase the competitive nature of the
industry.
B)
would not likely be allowed since it most likely would reduce the competitive
nature of the industry.
C)
would be allowed since this HHI represents a highly concentrated industry.
D)
is likely to be allowed since it moves the industry toward a socially optimal level of
output.
Page 63
268.
Maximization of joint profits is MOST likely when firms are:
A)
perfect competitors.
B)
monopolistic competitors.
C)
duopolists who collude.
D)
natural monopolists.
269.
Cartels made up of a large number of firms are unstable because each firm in the cartel:
A)
has an incentive to cheat.
B)
is producing a relatively homogeneous product in which entry barriers are low.
C)
does not have to worry about losses.
D)
recognizes that the market size is relatively stable.
270.
Both monopolists and cartel members will find that a drop in price leads to:
A)
a quantity effect that reduces total revenue.
B)
a price effect that reduces total revenue.
C)
a quantity effect that has no effect on total revenue.
D)
neither a price nor a quantity effect.
271.
Given the large amount of interdependence among them, cooperation with one’s
competitors is the most profitable strategy for:
A)
perfect competitors.
B)
monopolistic competitors.
C)
oligopolists.
D)
monopolists.
272.
(Scenario: Two Identical Firms) Use Scenario: Two Identical Firms. Suppose the two
firms decide to cooperate and collude, resulting in the same amount of production for
each firm. What is the profit-maximizing price and output for the industry?
Scenario: Two Identical Firms
Two identical firms make up an industry in which the market demand curve is
represented by Q = 5,000 – 4P, where Q is the quantity demanded and P is price per
unit. The marginal cost of producing the good in this industry is constant and equal to
$650. Fixed cost is zero.
A)
P = $400, Q = 5,000
B)
P = $950, Q = 1,200
C)
P = $600, Q = 1,500
D)
P = $300, Q = 2,000
Page 64
273.
(Scenario: Two Identical Firms) Use Scenario: Two Identical Firms. When the firms
collude and produce the profit-maximizing output, what is the profit earned by each firm
if they split production equally?
Scenario: Two Identical Firms
Two identical firms make up an industry in which the market demand curve is
represented by Q = 5,000 – 4P, where Q is the quantity demanded and P is price per
unit. The marginal cost of producing the good in this industry is constant and equal to
$650. Fixed cost is zero.
A)
$360,000
B)
$180,000
C)
$15,000
D)
$25,000
274.
(Scenario: Two Identical Firms) Use Scenario: Two Identical Firms. If one firm decides
to cheat, the cheating firm will:
Scenario: Two Identical Firms
Two identical firms make up an industry in which the market demand curve is
represented by Q = 5,000 – 4P, where Q is the quantity demanded and P is price per
unit. The marginal cost of producing the good in this industry is constant and equal to
$650. Fixed cost is zero.
A)
be able to increase its profits initially.
B)
find that cheating leads to a decrease in its profits alone.
C)
find that cheating initially leads to an increase in both firms’ profits.
D)
find that the other firm has an increase in its profits alone.
Page 65
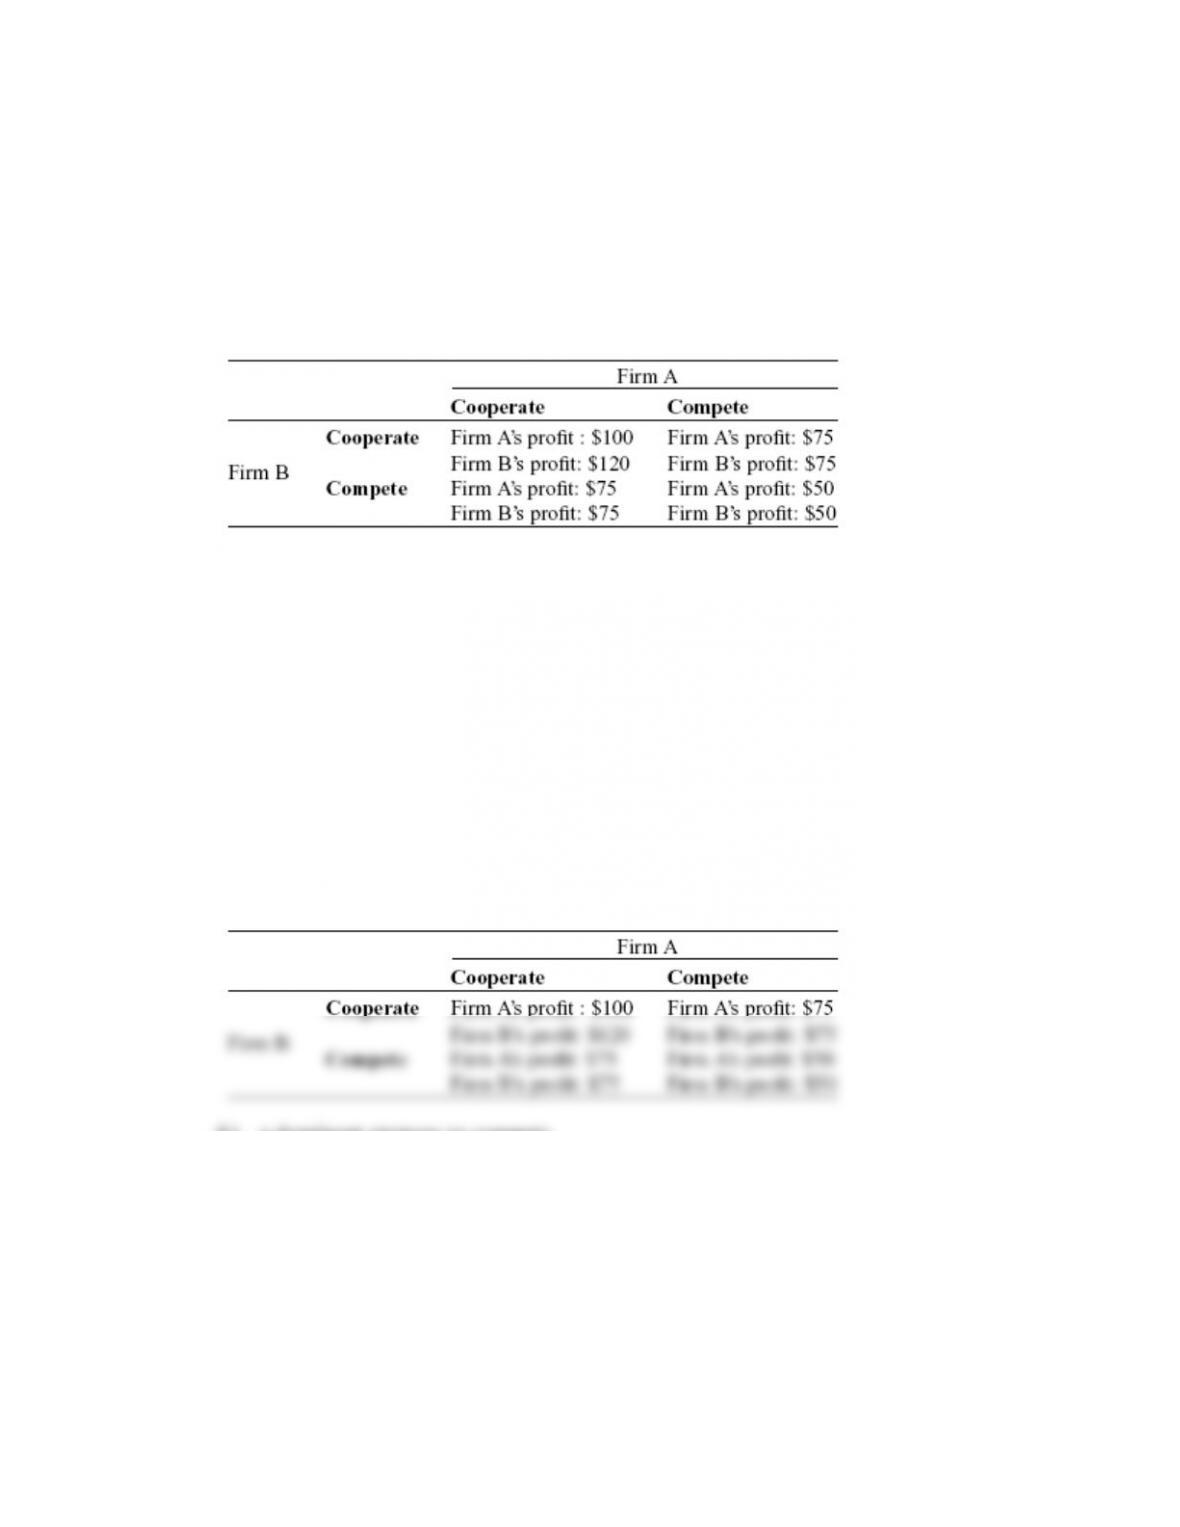
275.
(Scenario: Payoff Matrix for Two Firms) Use Scenario: Payoff Matrix for Two Firms.
Firm A has:
Scenario: Payoff Matrix for Two Firms
The following table provides the payoff matrix for two firms, firm A and firm B. They
are the only two firms in the industry and can either compete or cooperate with each
other, with the following profit results reflecting their actions.
A)
a dominant strategy to compete.
B)
a dominant strategy to cooperate.
C)
two dominant strategies.
D)
no dominant strategy.
276.
(Scenario: Payoff Matrix for Two Firms) Use Scenario: Payoff Matrix for Two Firms.
Firm B has:
Scenario: Payoff Matrix for Two Firms
The following table provides the payoff matrix for two firms, firm A and firm B. They
are the only two firms in the industry and can either compete or cooperate with each
other, with the following profit results reflecting their actions.
A)
a dominant strategy to compete.
B)
a dominant strategy to cooperate.
C)
two dominant strategies.
D)
no dominant strategy.
Page 66
277.
(Scenario: Payoff Matrix for Two Firms) Use Scenario: Payoff Matrix for Two Firms. If
both firms pursue their dominant strategies:
Scenario: Payoff Matrix for Two Firms
The following table provides the payoff matrix for two firms, firm A and firm B. They
are the only two firms in the industry and can either compete or cooperate with each
other, with the following profit results reflecting their actions.
A)
their joint profits are maximized.
B)
their joint profits are not maximized.
C)
their joint profits reflect an equal sharing of the total profits.
D)
neither can attain its largest possible profits since there are two dominant strategies
for each firm.
278.
Two players in a game both have an incentive to cheat no matter what the other player
does. Furthermore, if both players cheat in this manner, both players will be worse off.
This is a:
A)
prisoners’ dilemma.
B)
tit-for-tat strategy.
C)
price leadership model.
D)
kinked demand curve model.
279.
A strategy in which players cooperate initially but then mimic what the other players do
is referred to as a:
A)
prisoners’ dilemma.
B)
tit-for-tat strategy.
C)
price leadership model.
D)
kinked demand curve model.
280.
Firms will choose a tit-for-tat strategy if they:
A)
expect that price wars will ultimately provide benefits for the dominant firm.
B)
believe that the firms in the industry will be competing with each other for a long
time.
C)
do not believe interdependence is a prominent characteristic of the industry.
D)
are sure that cheating behavior will go unnoticed.
Page 67
281.
When countries spend increasingly large amounts of funds on military production as a
means of impressing an equally powerful antagonistic neighbor with possible military
superiority, a prisoners’ dilemma evolves since both countries would be better off if they
did not pursue such a strategy. This is an example of:
A)
a tacit agreement.
B)
an arms race.
C)
a price leadership model.
D)
exclusive dealing.
282.
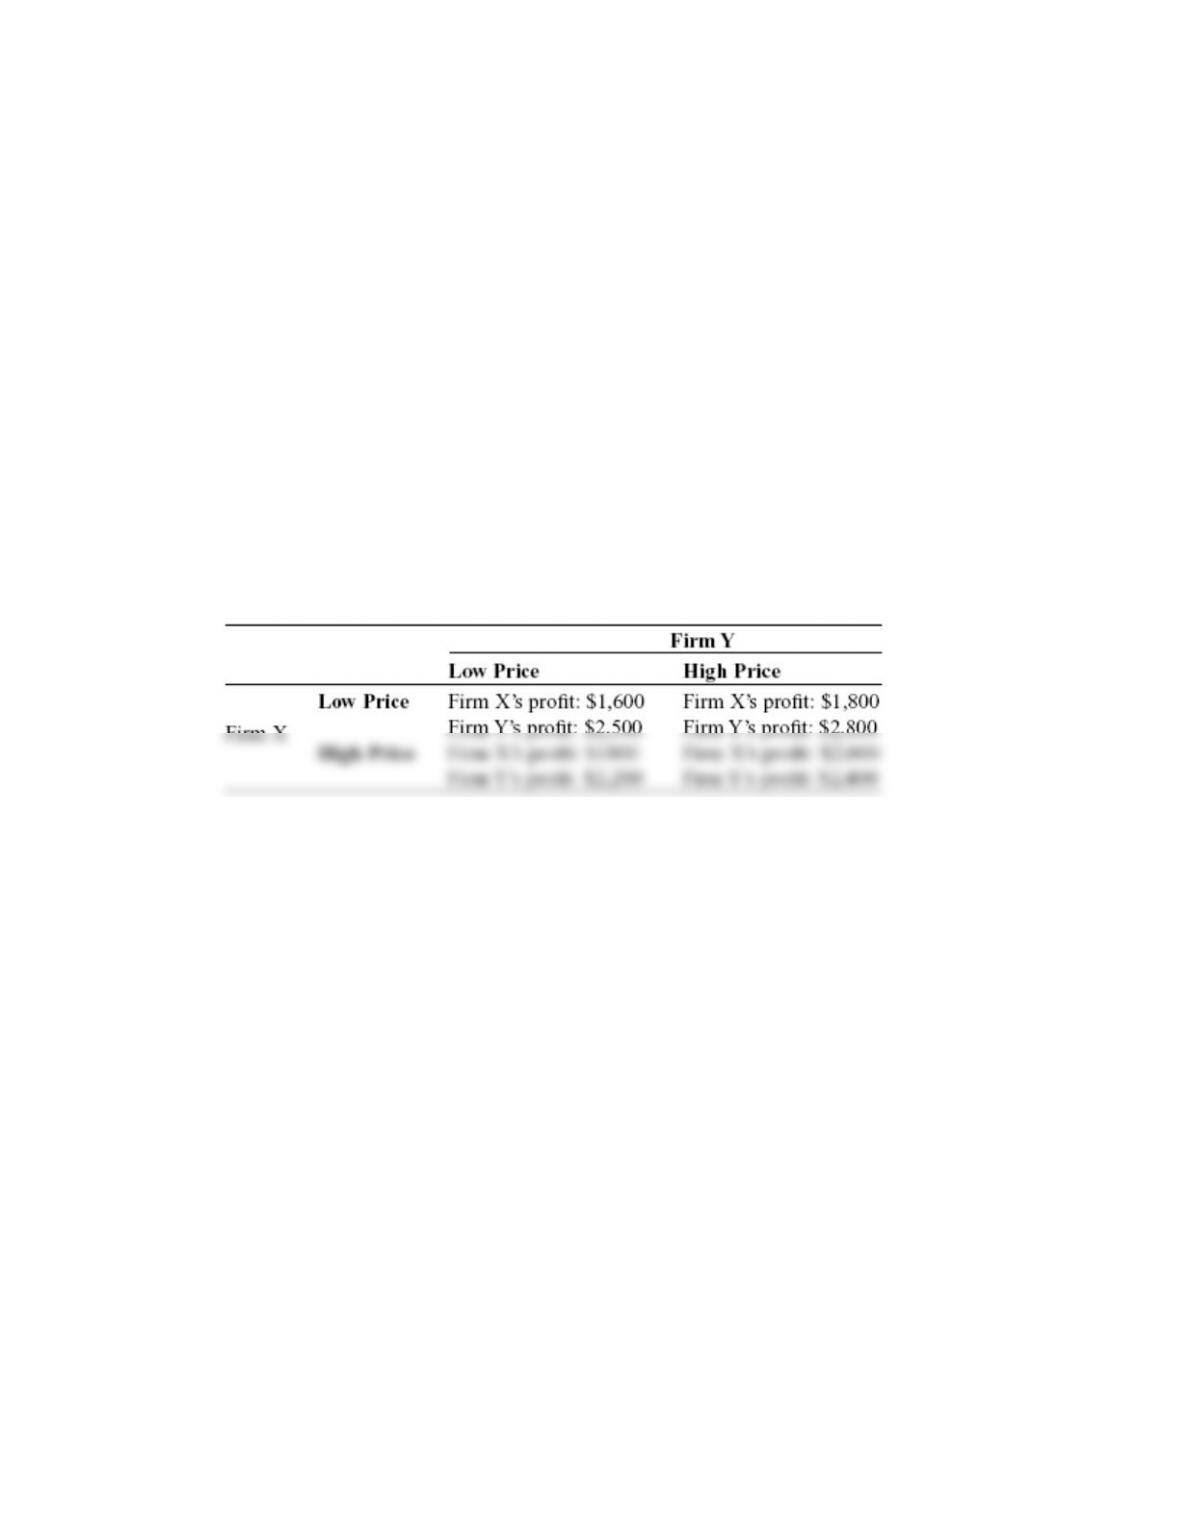
(Scenario: Payoff Matrix for Firms X and Y) Use Scenario: Payoff Matrix for Firms X
and Y. If firm Y were to choose its dominant strategy, it would:
Scenario: Payoff Matrix for Firms X and Y
The following payoff matrix depicts the profits for the only two firms in this
oligopolistic industry.
A)
choose a low price.
B)
choose a high price.
C)
encounter a dilemma since there are two dominant strategies.
D)
allow firm X to dominate the industry.
Page 68
283.
(Scenario: Payoff Matrix for Firms X and Y) Payoff Matrix for Firms X and Y. If firm
X were to choose its dominant strategy, it would:
Scenario: Payoff Matrix for Firms X and Y
The following payoff matrix depicts the profits for the only two firms in this
oligopolistic industry.
A)
choose a low price.
B)
choose a high price.
C)
encounter a dilemma since there are two dominant strategies.
D)
allow firm Y to dominate the industry.
284.
(Scenario: Payoff Matrix for Firms X and Y) Payoff Matrix for Firms X and Y. If firm
X and firm Y wish to maximize joint profits:
Scenario: Payoff Matrix for Firms X and Y
The following payoff matrix depicts the profits for the only two firms in this
oligopolistic industry.
A)
each firm should choose its dominant strategy.
B)
firm Y should choose a dominant strategy and firm X should choose a
nondominant strategy.
C)
each should consider its specific situation before choosing a strategy since
strategies also entail costs.
D)
each should choose a nondominant strategy.
Page 69
285.
The Sherman Antitrust Act:
A)
was aimed at preventing the establishment of more monopolies and was the
beginning of antitrust policy.
B)
introduced the HHI measure to industries.
C)
initially allowed firms to collude legally.
D)
allowed the establishment of trusts.
286.
A customer with significant buying power in an industry would:
A)
make a tacit price agreement more difficult to achieve.
B)
make a tacit price agreement easier to achieve.
C)
have no effect on tacit pricing agreement negotiations.
D)
result in a kinked demand curve.
287.
Product differentiation is MOST likely to occur when firms:
A)
engage in price wars.
B)
have tacit agreements not to engage in price wars.
C)
behave in a Bertrand model environment.
D)
follow a kinked demand curve model.
Answer Key
Page 71
45.
D
46.
D
47.
D
48.
C
49.
D
50.
B
51.
C
52.
B
53.
B
54.
C
55.
D
56.
C
57.
B
58.
A
59.
D
60.
D
61.
C
62.
B
63.
C
64.
D
65.
A
66.
A
67.
C
68.
D
69.
D
70.
A
71.
A
72.
D
73.
A
74.
B
75.
A
76.
C
77.
B
78.
C
79.
D
80.
A
81.
D
82.
D
83.
C
84.
C
85.
C
86.
B
87.
B
88.
B
89.
B
90.
A
Page 72
91.
A
92.
D
93.
A
94.
B
95.
D
96.
B
97.
C
98.
A
99.
A
100.
A
101.
C
102.
D
103.
C
104.
B
105.
D
106.
A
107.
C
108.
B
109.
B
110.
B
111.
A
112.
D
113.
D
114.
D
115.
B
116.
D
117.
D
118.
B
119.
D
120.
D
121.
B
122.
B
123.
D
124.
D
125.
B
126.
B
127.
A
128.
C
129.
A
130.
A
131.
B
132.
A
133.
D
134.
D
135.
C
136.
C
Page 73
137.
B
138.
B
139.
B
140.
A
141.
C
142.
D
143.
C
144.
B
145.
A
146.
C
147.
A
148.
B
149.
A
150.
A
151.
C
152.
A
153.
A
154.
C
155.
A
156.
B
157.
C
158.
D
159.
A
160.
C
161.
B
162.
D
163.
B
164.
D
165.
C
166.
A
167.
A
168.
B
169.
C
170.
A
171.
C
172.
A
173.
D
174.
C
175.
A
176.
B
177.
B
178.
B
179.
B
180.
C
181.
D
182.
B
Page 74
183.
D
184.
B
185.
C
186.
B
187.
B
188.
A
189.
A
190.
A
191.
A
192.
B
193.
A
194.
B
195.
A
196.
A
197.
B
198.
A
199.
A
200.
A
201.
A
202.
A
203.
A
204.
B
205.
A
206.
A
207.
B
208.
B
209.
B
210.
A
211.
A
212.
B
213.
A
214.
B
215.
A
216.
B
217.
A
218.
A
219.
B
220.
A
221.
A
222.
B
223.
B
224.
A
225.
B
226.
A
227.
B
228.
B
Page 75
229.
B
230.
A
231.
A
232.
B
233.
A
234.
A
235.
A
236.
B
237.
B
238.
A
239.
B
240.
B
241.
B
242.
A
243.
A
244.
B
245.
A
246.
B
247.
A
248.
B
249.
B
250.
A
251.
A
252.
253.
254.
255.
256.
257.
258.
259.
260.
261.
262.
B
263.
A
264.
A
265.
A
266.
C
267.
B
268.
C
269.
A
270.
B
271.
C
272.
B
273.
B
274.
A
Page 76
275.
B
276.
B
277.
A
278.
A
279.
B
280.
B
281.
B
282.
B
283.
B
284.
B
285.
A
286.
A
287.
B