Page 1
Name: __________________________ Date: _____________
1.
In an oligopoly:
A)
there are many sellers.
B)
there are no barriers to entry.
C)
firms recognize their interdependence.
D)
total surplus is maximized.
2.
The MOST important source of oligopoly in an industry is:
A)
economies of scale.
B)
government regulation.
C)
technological inferiority.
D)
ownership of plentiful resources.
3.
An industry that is dominated by a few firms, each of which recognizes that its own
choices can affect the choices of its rivals and vice versa, is:
A)
a monopoly.
B)
an oligopoly.
C)
characterized by monopolistic competition.
D)
characterized by perfect competition.
4.
Oligopoly is a market structure that is characterized by a _____ number of _____ firms
producing _____ products.
A)
small; interdependent; identical or differentiated
B)
small; independent; identical or differentiated
C)
large; relatively small independent; differentiated
D)
large; relatively small independent; identical
5.
To be called an oligopoly, an industry must have:
A)
independence in decision making.
B)
a horizontal demand curve.
C)
a small number of interdependent firms.
D)
relatively easy entry and exit.
6.
Oligopoly is a market structure characterized by:
A)
independence in decision making.
B)
interdependence: each firm’s decision affects the profit of the other firms.
C)
substantial diseconomies of scale.
D)
a large number of small firms.
Page 2
7.
The market structure characterized by a few interdependent firms and barriers to entry is
called:
A)
monopolistic competition.
B)
perfect competition.
C)
oligopoly.
D)
monopoly.
8.
In oligopoly, a firm must realize that:
A)
what it does has no effect on the other firms in the industry.
B)
its behavior will be ignored by other firms in the industry.
C)
another major firm may dominate choices in the industry, and it will have to
behave accordingly.
D)
collusion was made legal in 2004.
9.
A firm that is in an oligopoly knows that its _____ affect its _____ and that the _____ of
its rivals will affect it.
A)
actions; rivals; reactions
B)
price changes; total revenue in a positive way; reactions
C)
actions rarely; rivals; actions
D)
price increases; total revenue in the long run only; large but not small price changes
10.
The market structure that is characterized by only a small number of producers is:
A)
oligopoly.
B)
perfect competition.
C)
monopoly.
D)
monopolistic competition.
11.
Which scenarios BEST describes an oligopolistic industry?
A)
A single cable company serves customers in a small town.
B)
Thousands of soybean farmers sell their output in a global commodities market.
C)
Coca-Cola and Pepsi sell most of the soft drinks consumed around the world.
D)
A college has one bookstore selling textbooks to students.
12.
To calculate the Herfindahl–Hirschman index (HHI), one must _____ market share(s) of
_____ in the industry.
A)
sum the; the four largest firms
B)
sum the; all of the firms
C)
divide the; the largest firm by the sum of the four largest firms
D)
sum the squared; all of the firms
Page 3
13.
An industry is dominated by a few firms. Each of these firms acknowledges that its own
choices affect the choices of its rivals. Each firm also recognizes that its rivals’ choices
affect the decisions it makes. This industry is an example of:
A)
a monopoly.
B)
an oligopoly.
C)
monopolistic competition.
D)
perfect competition.
14.
Oligopoly is a market structure that is characterized by a _____ number of _____ firms
that produce _____ products.
A)
large; relatively small and independent; identical
B)
small; independent; identical or differentiated
C)
large; relatively small and independent; differentiated
D)
small; interdependent; identical or differentiated
15.
An industry characterized by a few interdependent firms and by barriers to entry is
called:
A)
perfect competition.
B)
monopolistic competition.
C)
monopoly.
D)
oligopoly.
16.
The sum of the squared market shares of each firm in an industry is the:
A)
concentration ratio.
B)
employment rate.
C)
Herfindahl–Hirschman index.
D)
market number.
17.
A monopoly will have a Herfindahl–Hirschman index equal to:
A)
1.
B)
100.
C)
1,000.
D)
10,000.
Page 4
18.
Which Herfindahl–Hirschman index is MOST likely to indicate a perfectly competitive
market?
A)
100
B)
1,800
C)
10,000
D)
100,000
19.
The Herfindahl–Hirschman index is a measure of concentration found by:
A)
squaring the percentage market share of each firm in the industry.
B)
squaring the percentage market share of each firm in the industry and then
summing the squared market shares.
C)
summing the percentage market shares of each firm in the industry.
D)
squaring the sums of the concentration ratios found in an industry survey of the
largest four and largest eight firms.
20.
The largest Herfindahl–Hirschman index possible is _____, and the industry is a(n)
_____.
A)
10; monopoly
B)
10,000; monopoly
C)
100,000; monopoly
D)
100,000; oligopoly
21.
The Herfindahl–Hirschman index equals _____ when _____ have/has _____% of the
market.
A)
10,000; four firms each; 25
B)
5,000; three firms each; 33
C)
5,000; two firms each; 50
D)
100,000; one firm; 100
22.
Large barriers to entry in the gas station business explain why the two only gas stations
in a small town:
A)
can earn an economic profit in the long run.
B)
must produce at the minimum average total cost in the long run.
C)
have no fixed costs in the long run.
D)
must produce a level of output such that MR = MC to maximize their profit.
Page 5
23.
An industry with only two firms is generally called:
A)
a monopoly.
B)
monopolistic competition.
C)
a duopoly.
D)
perfect competition.
24.
A duopoly is an industry that consists of:
A)
a single firm.
B)
two firms.
C)
three or more firms.
D)
a large number of small firms.
25.
An industry that consists of two firms is:
A)
a duopoly.
B)
a monopoly.
C)
a monopsony.
D)
monopolistic competition.
26.
_____ occurs when the only two firms in an industry agree to fix the price at a given
level.
A)
Collusion
B)
The ability to satisfy demand
C)
Price extortion
D)
Price leadership
27.
An extreme case of oligopoly in which firms collude to raise joint profits is known as a:
A)
duopoly.
B)
cartel.
C)
dominant producer.
D)
price war.
28.
If there are two gas stations in a very small town, then the gas station business there is
probably BEST characterized as:
A)
perfectly competitive.
B)
monopolistically competitive.
C)
monopolistic.
D)
oligopolistic.
Page 6
29.
Collusive agreements are typically difficult for cartels to maintain because each firm can
increase profits by:
A)
producing more than the quantity that maximizes joint profits.
B)
producing less than the quantity that maximizes joint profits.
C)
charging more than the price that maximizes joint cartel profits.
D)
advertising less than will maximize joint cartel profits.
30.
The owners of the gas stations in a town are trying to set up a cartel that will raise the
price of gasoline. Which scenario will INCREASE the chances that the cartel will fail
because of cheating by the owners?
A)
All of the gas stations face the same costs.
B)
There are only a few gas stations.
C)
The gas stations are producing as much as they can.
D)
The gas stations vary in terms of the services that they provide.
31.
In an oligopoly market, collusion between firms usually leads to higher profits than does
noncooperative behavior. However, formal, overt collusion doesn’t usually occur in the
United States because:
I. it is illegal.
II. there is an incentive for each firm to cheat on a collusive agreement.
III. an oligopolistic firm will typically prefer lower profits for itself if the only way to
make higher collective profits in the industry is to improve the profit position of its
rivals.
A)
I only
B)
II only
C)
I and II
D)
II and III
32.
Gary’s Gas and Frank’s Fuel are the only two providers of gasoline in their small town.
Gary and Frank decide to form a cartel to raise the price of gasoline. The total industry
profits are highest when _____ cheat(s) on the agreement, and Gary’s profits are highest
when _____.
A)
neither firm; neither firm cheats on the agreement
B)
neither firm; Gary cheats but Frank does not
C)
both firms; Gary cheats but Frank does not
D)
both Gary and Frank; both Gary and Frank cheat
Page 7
33.
In which situation does overt collusion take place?
A)
Smaller firms in an industry have an unspoken agreement to charge the same price
as the largest firm.
B)
Firms in an industry agree openly on price and output, and they jointly make other
decisions aimed at achieving monopoly profits.
C)
Competition among a large number of small firms generates similar but slightly
different prices.
D)
Competition among a large number of small firms generates a stable market price.
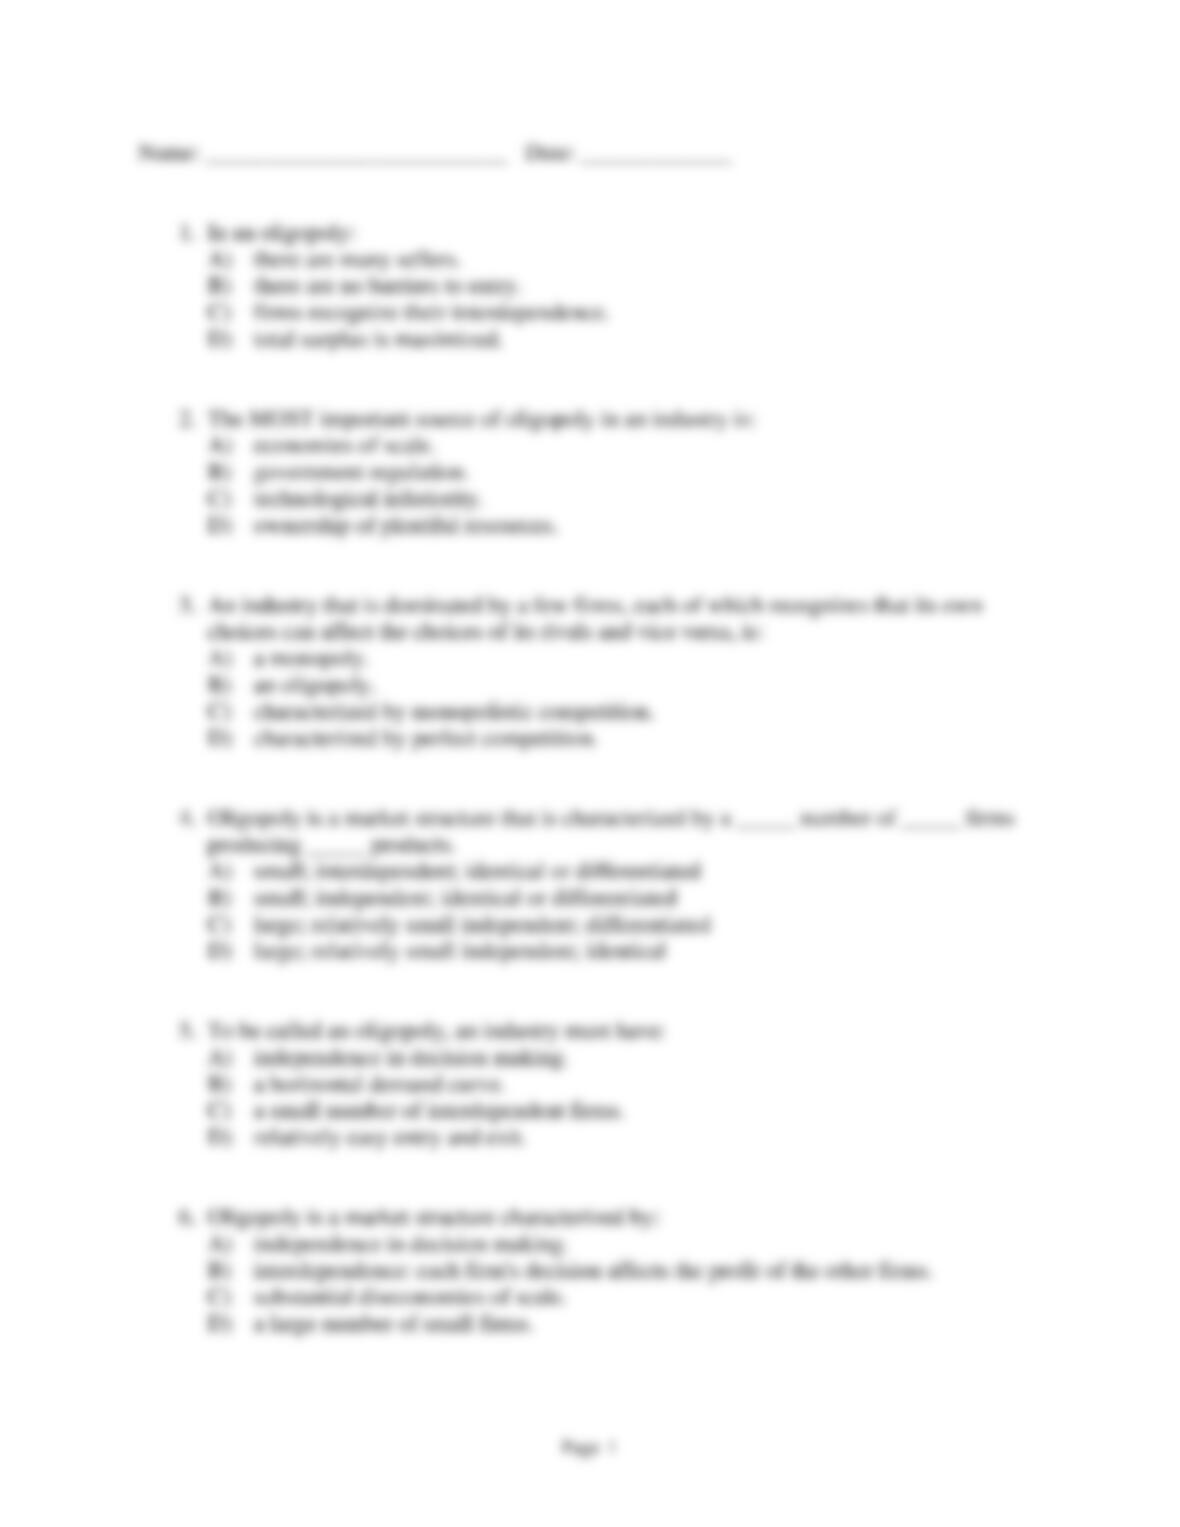
Use the following to answer questions 34-60:
34.
(Table: Demand Schedule of Gadgets) Use Table: Demand Schedule of Gadgets. The
market for gadgets consists of two producers, Margaret and Ray. Each firm can produce
gadgets with no marginal cost or fixed cost. If these two producers formed a cartel and
acted to maximize total industry profits, total industry output would be _____, and the
price would be _____.
A)
1,000; $10
B)
100; $9
C)
400; $6
D)
500; $5
Page 8
35.
(Table: Demand Schedule of Gadgets) Use Table: Demand Schedule of Gadgets. The
market for gadgets consists of two producers, Margaret and Ray. Each firm can produce
gadgets with no marginal cost or fixed cost. If these two producers formed a cartel and
acted to maximize total industry profits, total industry profit would be:
A)
$10,000.
B)
$5,000.
C)
$2,500.
D)
$1,250.
36.
(Table: Demand Schedule of Gadgets) Use Table: Demand Schedule of Gadgets. The
market for gadgets consists of two producers, Margaret and Ray. Each firm can produce
gadgets with no marginal cost or fixed cost. If these two producers formed a cartel, split
the production of output equally, and acted to maximize total industry profits, each
firm’s output would be _____, and each firm’s profit would be _____.
A)
500; $2,500
B)
250; $1,250
C)
1,000; $500
D)
1,000; $10,000
37.
(Table: Demand Schedule of Gadgets) Use Table: Demand Schedule of Gadgets. The
market for gadgets consists of two producers, Margaret and Ray. Each firm can produce
gadgets with no marginal cost or fixed cost. Suppose that these two producers have
formed a cartel and are maximizing total industry profits and splitting the production of
output evenly between themselves. If Margaret decides to cheat on the agreement and
sell 100 more gadgets, how many gadgets will she sell?
A)
0
B)
250
C)
350
D)
600
38.
(Table: Demand Schedule of Gadgets) Use Table: Demand Schedule of Gadgets. The
market for gadgets consists of two producers, Margaret and Ray. Each firm can produce
gadgets with no marginal cost or fixed cost. Suppose that these two producers have
formed a cartel, agreed to split production of output evenly, and are maximizing total
industry profits. If Margaret decides to cheat on the agreement and sell 100 more
gadgets, the market price of gadgets will be:
A)
$4.
B)
$5.
C)
$6.
D)
$7.
Page 9
39.
(Table: Demand Schedule of Gadgets) Use Table: Demand Schedule of Gadgets. The
market for gadgets consists of two producers, Margaret and Ray. Each firm can produce
gadgets with no marginal cost or fixed cost. Suppose that these two producers have
formed a cartel, agreed to split production of output evenly, and are maximizing total
industry profits. If Margaret decides to cheat on the agreement and sell 100 more
gadgets, Margaret’s profit will be _____, and Ray’s profit will be _____.
A)
$1,250; $1,250
B)
$500; $500
C)
$1,400; $1,000
D)
$1,000; $1,400
40.
(Table: Demand Schedule of Gadgets) Use Table: Demand Schedule of Gadgets. The
market for gadgets consists of two producers, Margaret and Ray. Each firm can produce
gadgets with no marginal cost or fixed cost. Suppose that these two producers have
formed a cartel, agreed to split production of output evenly, and are maximizing total
industry profits. If Margaret decides to cheat on the agreement and sell 100 more
gadgets, Margaret’s quantity effect will be a(n) _____ in profit of _____.
A)
decrease; $250
B)
increase; $150
C)
increase; $400
D)
decrease; $400
41.
(Table: Demand Schedule of Gadgets) Use Table: Demand Schedule of Gadgets. The
market for gadgets consists of two producers, Margaret and Ray. Each firm can produce
gadgets with no marginal cost or fixed cost. Suppose that these two producers have
formed a cartel, agreed to split production of output evenly, and are maximizing total
industry profits. If Margaret decides to cheat on the agreement and sell 100 more
gadgets, Margaret’s price effect will be a(n) _____ in profit of _____.
A)
decrease; $400
B)
increase; $400
C)
increase; $250
D)
decrease; $250
Page 10
42.
(Table: Demand Schedule of Gadgets) Use Table: Demand Schedule of Gadgets. The
market for gadgets consists of two producers, Margaret and Ray. Each firm can produce
gadgets with no marginal cost or fixed cost. Suppose that these two producers have
formed a cartel, agreed to split production of output evenly, and are maximizing total
industry profits. If Margaret decides to cheat on the agreement and sell 100 more
gadgets but Ray continues to sell 250 gadgets, Ray’s profits will be:
A)
$1,400.
B)
$1,250.
C)
$1,000.
D)
$400.
43.
(Table: Demand Schedule of Gadgets) Use Table: Demand Schedule of Gadgets. The
market for gadgets consists of two producers, Margaret and Ray. Each firm can produce
gadgets with no marginal cost or fixed cost. If industry output is 350 gadgets produced
by Margaret and 250 gadgets produced by Ray and if Ray decides to increase output by
an additional 100 gadgets, industry output will be:
A)
700.
B)
600.
C)
500.
D)
400.
44.
(Table: Demand Schedule of Gadgets) Use Table: Demand Schedule of Gadgets. The
market for gadgets consists of two producers, Margaret and Ray. Each firm can produce
gadgets with no marginal cost or fixed cost. If industry output is 350 gadgets produced
by Margaret and 250 gadgets produced by Ray and if Ray decides to increase output by
an additional 100 gadgets, industry price will be:
A)
$3.
B)
$2.
C)
$1.
D)
$0.
45.
(Table: Demand Schedule of Gadgets) Use Table: Demand Schedule of Gadgets. The
market for gadgets consists of two producers, Margaret and Ray. Each firm can produce
gadgets with no marginal cost or fixed cost. If industry output is 350 gadgets produced
by Margaret and 250 gadgets produced by Ray and if Ray decides to increase output by
an additional 100 gadgets, Margaret’s profit will be _____, and Ray’s profit will be
_____.
A)
$1,750; $1,250
B)
$1,250; $1,250
C)
$1,400; $1,000
D)
$1,050; $1,050
Page 11
46.
(Table: Demand Schedule of Gadgets) Use Table: Demand Schedule of Gadgets. The
market for gadgets consists of two producers, Margaret and Ray. Each firm can produce
gadgets with no marginal cost or fixed cost. If industry output is 700, each firm’s profits
will be _____ than they would be at the output of 500, which maximizes industry profit.
A)
$150 less
B)
$150 more
C)
$200 more
D)
$200 less
47.
(Table: Demand Schedule of Gadgets) Use Table: Demand Schedule of Gadgets. The
market for gadgets consists of two producers, Margaret and Ray. Each firm can produce
gadgets with no marginal cost or fixed cost. Suppose that these two producers have
formed a cartel, agreed to split production of output evenly, and are maximizing total
industry profits. Total industry output would be _____ gadgets.
A)
10
B)
5
C)
50
D)
500
48.
(Table: Demand Schedule of Gadgets) Use Table: Demand Schedule of Gadgets. The
market for gadgets consists of two producers, Margaret and Ray. Each firm can produce
gadgets at a marginal cost of $2 and no fixed cost. If these two producers formed a
cartel, agreed to split production of output evenly, and acted to maximize total industry
profits, total industry output would be _____, and the price would be _____.
A)
1,000; $10
B)
100; $9
C)
400; $6
D)
500; $5
49.
(Table: Demand Schedule of Gadgets) Use Table: Demand Schedule of Gadgets. The
market for gadgets consists of two producers, Margaret and Ray. Each firm can produce
gadgets at a marginal cost of $2 and no fixed cost. If these two producers formed a
cartel, agreed to split production of output evenly, and acted to maximize total industry
profits, total industry profit would be:
A)
$10,000.
B)
$5,000.
C)
$2,500.
D)
$1,600.
50.
(Table: Demand Schedule of Gadgets) Use Table: Demand Schedule of Gadgets. The
market for gadgets consists of two producers, Margaret and Ray. Each firm can produce
gadgets at a marginal cost of $2 and no fixed cost. Suppose that these two producers
have formed a cartel, agreed to split production of output evenly, and are maximizing
total industry profits. Each firm’s output would be _____, and each firm’s profit would
be _____.
A)
500; $2,500
B)
200; $800
C)
1,000; $500
D)
1,000; $10,000
51.
(Table: Demand Schedule of Gadgets) Use Table: Demand Schedule of Gadgets. The
market for gadgets consists of two producers, Margaret and Ray. Each firm can produce
gadgets at a marginal cost of $2 and no fixed cost. Suppose that these two producers
have formed a cartel, agreed to split production of output evenly, and are maximizing
total industry profits. If Margaret decides to cheat on the agreement and sell 100 more
gadgets, how many gadgets will Margaret sell?
A)
500
B)
200
C)
300
D)
600
52.
(Table: Demand Schedule of Gadgets) Use Table: Demand Schedule of Gadgets. The
market for gadgets consists of two producers, Margaret and Ray. Each firm can produce
gadgets at a marginal cost of $2 and no fixed cost. Suppose that these two producers
have formed a cartel, agreed to split production of output evenly, and are maximizing
total industry profits. If Margaret decides to cheat on the agreement and sell 100 more
gadgets, the market price of gadgets will be:
A)
$4.
B)
$5.
C)
$6.
D)
$7.
53.
(Table: Demand Schedule of Gadgets) Use Table: Demand Schedule of Gadgets. The
market for gadgets consists of two producers, Margaret and Ray. Each firm can produce
gadgets at a marginal cost of $2 and no fixed cost. Suppose that these two producers
have formed a cartel, agreed to split production of output evenly, and are maximizing
total industry profits. If Margaret decides to cheat on the agreement and sell 100 more
gadgets, Margaret’s profit will be _____, and Ray’s profit will be _____.
A)
$1500; $1,000
B)
$900; $600
C)
$1,400; $1,000
D)
$1,000; $1,400
54.
(Table: Demand Schedule of Gadgets) Use Table: Demand Schedule of Gadgets. The
market for gadgets consists of two producers, Margaret and Ray. Each firm can produce
gadgets at a marginal cost of $2 and no fixed cost. Suppose that these two producers
have formed a cartel, agreed to split production of output evenly, and are maximizing
total industry profits. If Margaret decides to cheat on the agreement and sell 100 more
gadgets, Margaret’s quantity effect will be a(n) _____ in profit of _____.
A)
decrease; $100
B)
increase; $100
C)
increase; $300
D)
decrease; $300
55.
(Table: Demand Schedule of Gadgets) Use Table: Demand Schedule of Gadgets. The
market for gadgets consists of two producers, Margaret and Ray. Each firm can produce
gadgets at a marginal cost of $2 and no fixed cost. Suppose that these two producers
have formed a cartel, agreed to split production of output evenly, and are maximizing
total industry profits. If Margaret decides to cheat on the agreement and sell 100 more
gadgets, Margaret’s price effect will be a(n) _____ in profit of _____.
A)
decrease; $400
B)
increase; $400
C)
increase; $200
D)
decrease; $200
56.
(Table: Demand Schedule of Gadgets) Use Table: Demand Schedule of Gadgets. The
market for gadgets consists of two producers, Margaret and Ray. Each firm can produce
gadgets at a marginal cost of $2 and no fixed cost. Suppose that these two producers
have formed a cartel, agreed to split production of output evenly, and are maximizing
total industry profits. If Margaret decides to cheat on the agreement and sell 100 more
gadgets but Ray continues to sell 200 gadgets, Ray’s profits will be:
A)
$1,400.
B)
$1,250.
C)
$600.
D)
$400.
57.
(Table: Demand Schedule of Gadgets) Use Table: Demand Schedule of Gadgets. The
market for gadgets consists of two producers, Margaret and Ray. Each firm can produce
gadgets at a marginal cost of $2 and no fixed cost. If industry output is 300 gadgets
produced by Margaret and 200 gadgets produced by Ray and if Ray decides to increase
output by an additional 100 gadgets, industry output will be:
A)
700.
B)
600.
C)
500.
D)
400.
58.
(Table: Demand Schedule of Gadgets) Use Table: Demand Schedule of Gadgets. The
market for gadgets consists of two producers, Margaret and Ray. Each firm can produce
gadgets at a marginal cost of $2 and no fixed cost. If industry output is 300 gadgets
produced by Margaret and 200 gadgets produced by Ray and if Ray decides to increase
output by an additional 100 gadgets, industry price will be:
A)
$4.
B)
$3.
C)
$2.
D)
$1.
59.
(Table: Demand Schedule of Gadgets) Use Table: Demand Schedule of Gadgets. The
market for gadgets consists of two producers, Margaret and Ray. Each firm can produce
gadgets at a marginal cost of $2 and no fixed cost. If industry output is 300 gadgets
produced by Margaret and 200 gadgets produced by Ray and if Ray decides to increase
output by an additional 100 gadgets, Margaret’s profit will be _____, and Ray’s profit
will be _____.
A)
$1,750; $1,250
B)
$1,250; $1,250
C)
$1,400; $1,000
D)
$600; $600
Page 15
60.
(Table: Demand Schedule of Gadgets) Use Table: Demand Schedule of Gadgets. The
market for gadgets consists of two producers, Margaret and Ray. Each firm can produce
gadgets at a marginal cost of $2 and no fixed cost. If the industry were actually perfectly
competitive, the output would be _____ gadgets, and the price would be _____.
A)
0; $10
B)
500; $5
C)
600; $4
D)
800; $2
Use the following to answer questions 61-71:
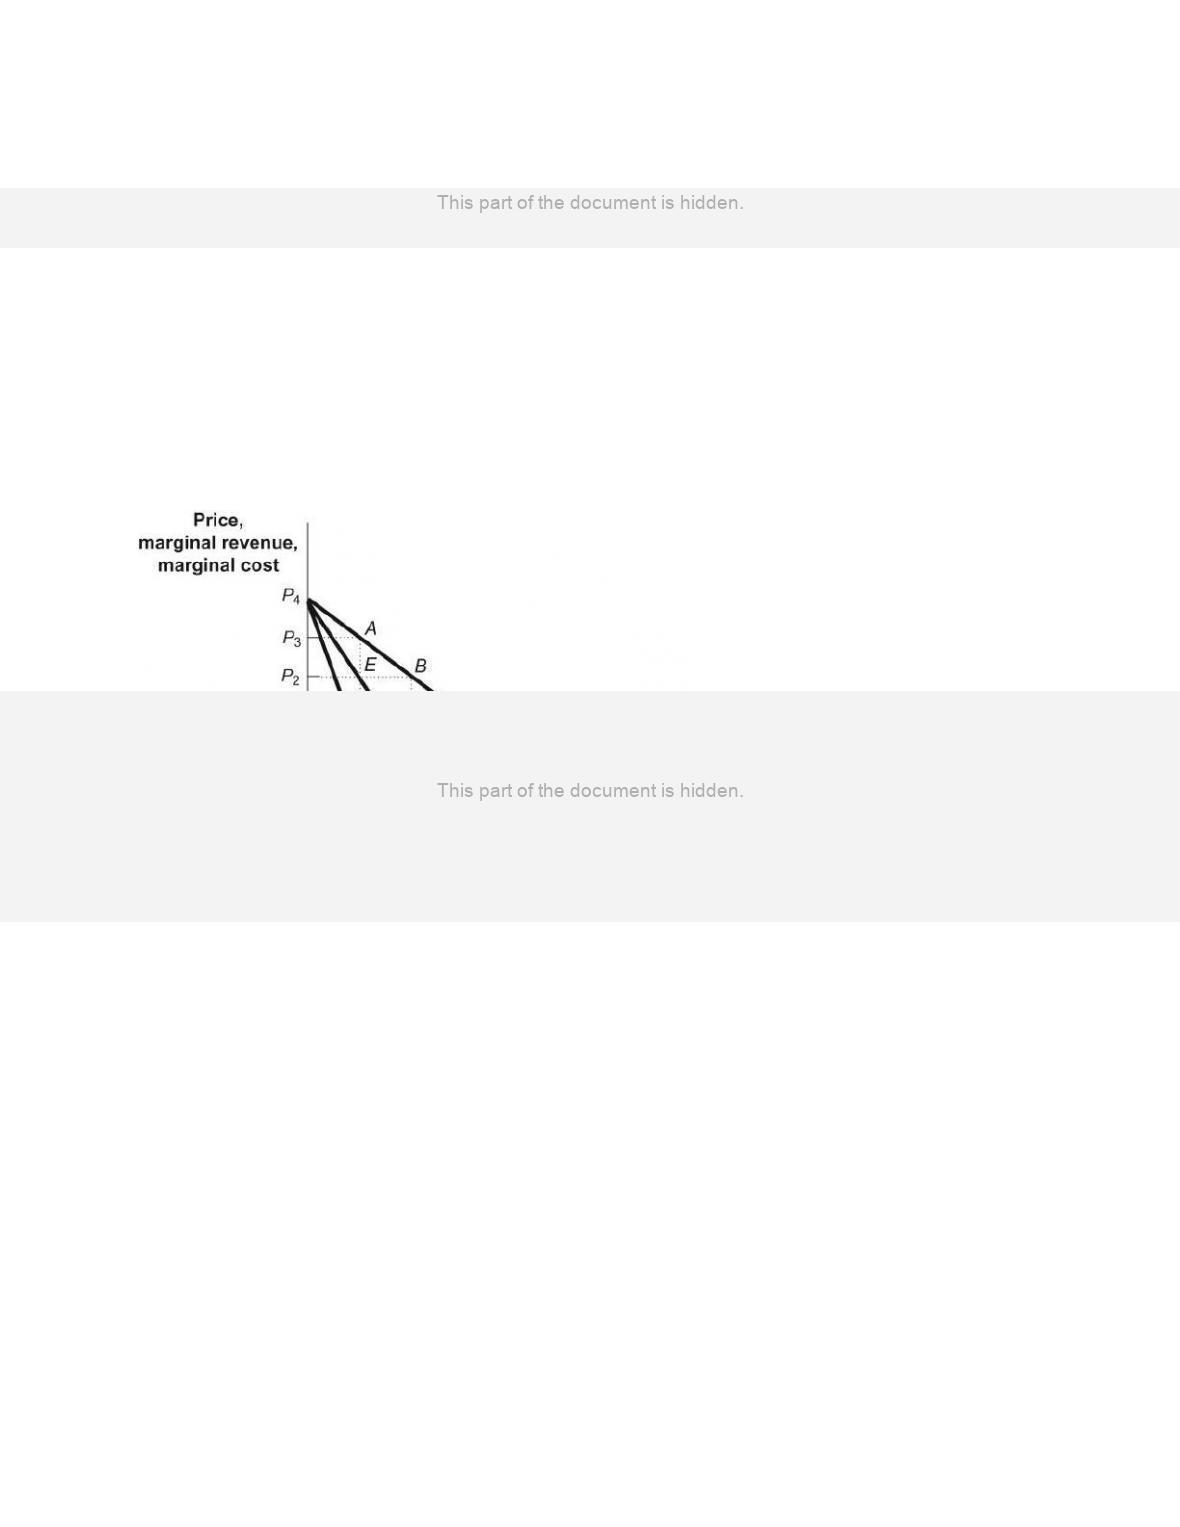
Figure: Monopoly Profits in Duopoly
61.
(Figure: Monopoly Profits in Duopoly) Use Figure: Monopoly Profits in Duopoly. If
there were two firms in this industry, they could engage in _____ and reap monopoly
profits.
A)
game theory
B)
the prisoners’ dilemma
C)
collusive behavior
D)
measuring the four-firm concentration ratio
Page 16
62.
(Figure: Monopoly Profits in Duopoly) Use Figure: Monopoly Profits in Duopoly.
Suppose there are two firms in this industry. Each firm faces an identical demand curve,
D1, and the market demand curve is D2. The figure illustrates how firms can reap
monopoly profits, even in an industry with:
A)
free entry and exit.
B)
two firms.
C)
monopolistic competition.
D)
a four-firm concentration ratio of 50.
63.
(Figure: Monopoly Profits in Duopoly) Use Figure: Monopoly Profits in Duopoly. The
figure shows how an industry consisting of two firms that face identical demand curves
(D1) can collude to increase profits. Which assumption is NOT a part of the analysis
illustrated by the model?
A)
The two firms are identical.
B)
The two firms sell identical products.
C)
While the firms face the same MC curves, their respective TC curves have unequal
slopes.
D)
Each firm has a horizontal marginal cost curve.
64.
(Figure: Monopoly Profits in Duopoly) Use Figure: Monopoly Profits in Duopoly. The
figure shows how an industry consisting of two firms that face identical demand curves
(D1) can collude to increase profits. The market demand curve is D2. Which assumption
is part of the analysis illustrated by the model?
A)
The two firms have identical marginal cost but different average total cost.
B)
The two firms sell differentiated products.
C)
The MR curve is not relevant to either firm’s choices.
D)
The firms can act as a cartel and maximize their combined economic profit.
65.
(Figure: Monopoly Profits in Duopoly) Use Figure: Monopoly Profits in Duopoly. The
figure shows how an industry consisting of two firms that face identical demand curves
(D1) can collude to increase profits. The market demand curve is D2. If the firms collude
to share the market demand equally, then each firm will act as if its demand curve is
given by:
A)
D1.
B)
D2.
C)
MR1.
D)
2 × D1.
Page 17
66.
(Figure: Monopoly Profits in Duopoly) Use Figure: Monopoly Profits in Duopoly. The
figure shows how an industry consisting of two firms that face identical demand curves
(D1) can collude to increase profits. If the firms collude to share the market demand
equally, then each firm will act as if its marginal revenue curve is given by:
A)
MR1.
B)
2 × MR1.
C)
MR2.
D)
MC.
67.
(Figure: Monopoly Profits in Duopoly) Use Figure: Monopoly Profits in Duopoly. The
figure shows how an industry consisting of two firms that face identical demand curves
(D1) can collude to increase profits. If the firms collude to share the market demand
equally, then each firm will act as if its demand curve is given by _____, while the
market demand curve is given by _____.
A)
D1; MR2
B)
D2; D1
C)
D1; D2
D)
MR1; MR2
68.
(Figure: Monopoly Profits in Duopoly) Use Figure: Monopoly Profits in Duopoly.
Given the duopoly industry illustrated in the figure, if each firm acted on the belief that
it faced demand curve D2 and acted without consideration of the other, each firm would
attempt to maximize economic profits by producing quantity _____ and setting price
equal to _____.
A)
Q4; P1
B)
Q4; P2
C)
Q1; P4
D)
Q2; P2
69.
(Figure: Monopoly Profits in Oligopoly) Use Figure: Monopoly Profits in Duopoly.
Firms in the duopoly industry illustrated in the figure have zero fixed costs. The market
demand curve is D2. If the two firms colluded to maximize their combined economic
profits, they would set the market price at _____, and combined economic profits of the
firms would be _____.
A)
P1; given by the area of the rectangle 0P1CQ4
B)
P1; zero
C)
P3; given by the area of the rectangle 0P3AQ1
D)
P2; given by the area of the rectangle P1P2BG
Page 18
70.
(Figure: Monopoly Profits in Duopoly) Use Figure: Monopoly Profits in Duopoly. The
efficient solution in the figure is found where price is _____ and quantity is _____.
A)
P1; Q4
B)
P2; Q2
C)
P2; Q1
D)
P3; Q1
71.
(Figure: Monopoly Profits in Duopoly) Use Figure: Monopoly Profits in Duopoly. If the
two firms in the figure colluded to split production evenly and to maximize their joint
profits, the market price they set would be _____, and each firm’s economic profit
would be _____. (Assume that the market demand curve is D2.)
A)
P2; given by the area of the rectangle bounded by P1P2EF = FEBG
B)
P1; P1P3AF
C)
P3; given by the area of the rectangle bounded by 0P3AQ1
D)
P2; given by the area of the rectangle bounded by P1P2BG
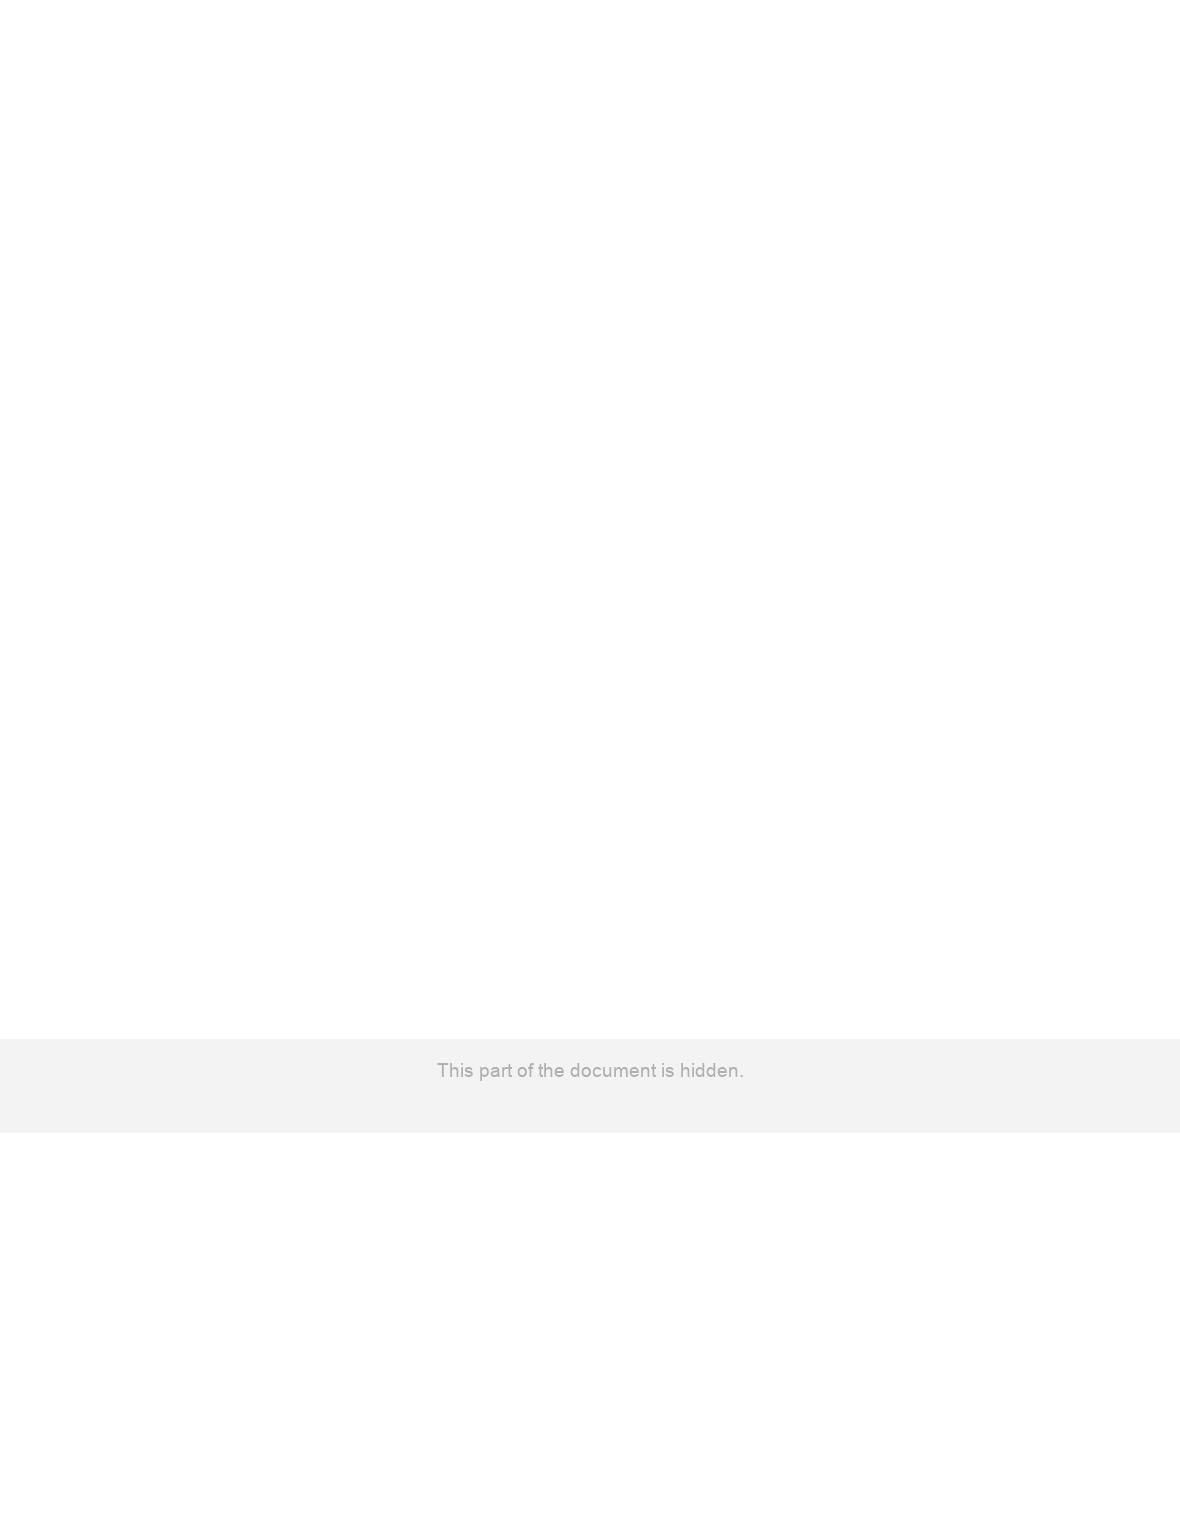
Use the following to answer questions 72-73:
Figure: Collusion
72.
(Figure: Collusion) Use Figure: Collusion. The quantity of output produced by the
industry with collusion is shown by:
A)
Q.
B)
R.
C)
S.
D)
T.
Page 19
73.
(Figure: Collusion) Use Figure: Collusion. The price charged by the industry with
collusion is shown by:
A)
W.
B)
X.
C)
Y.
D)
Z.
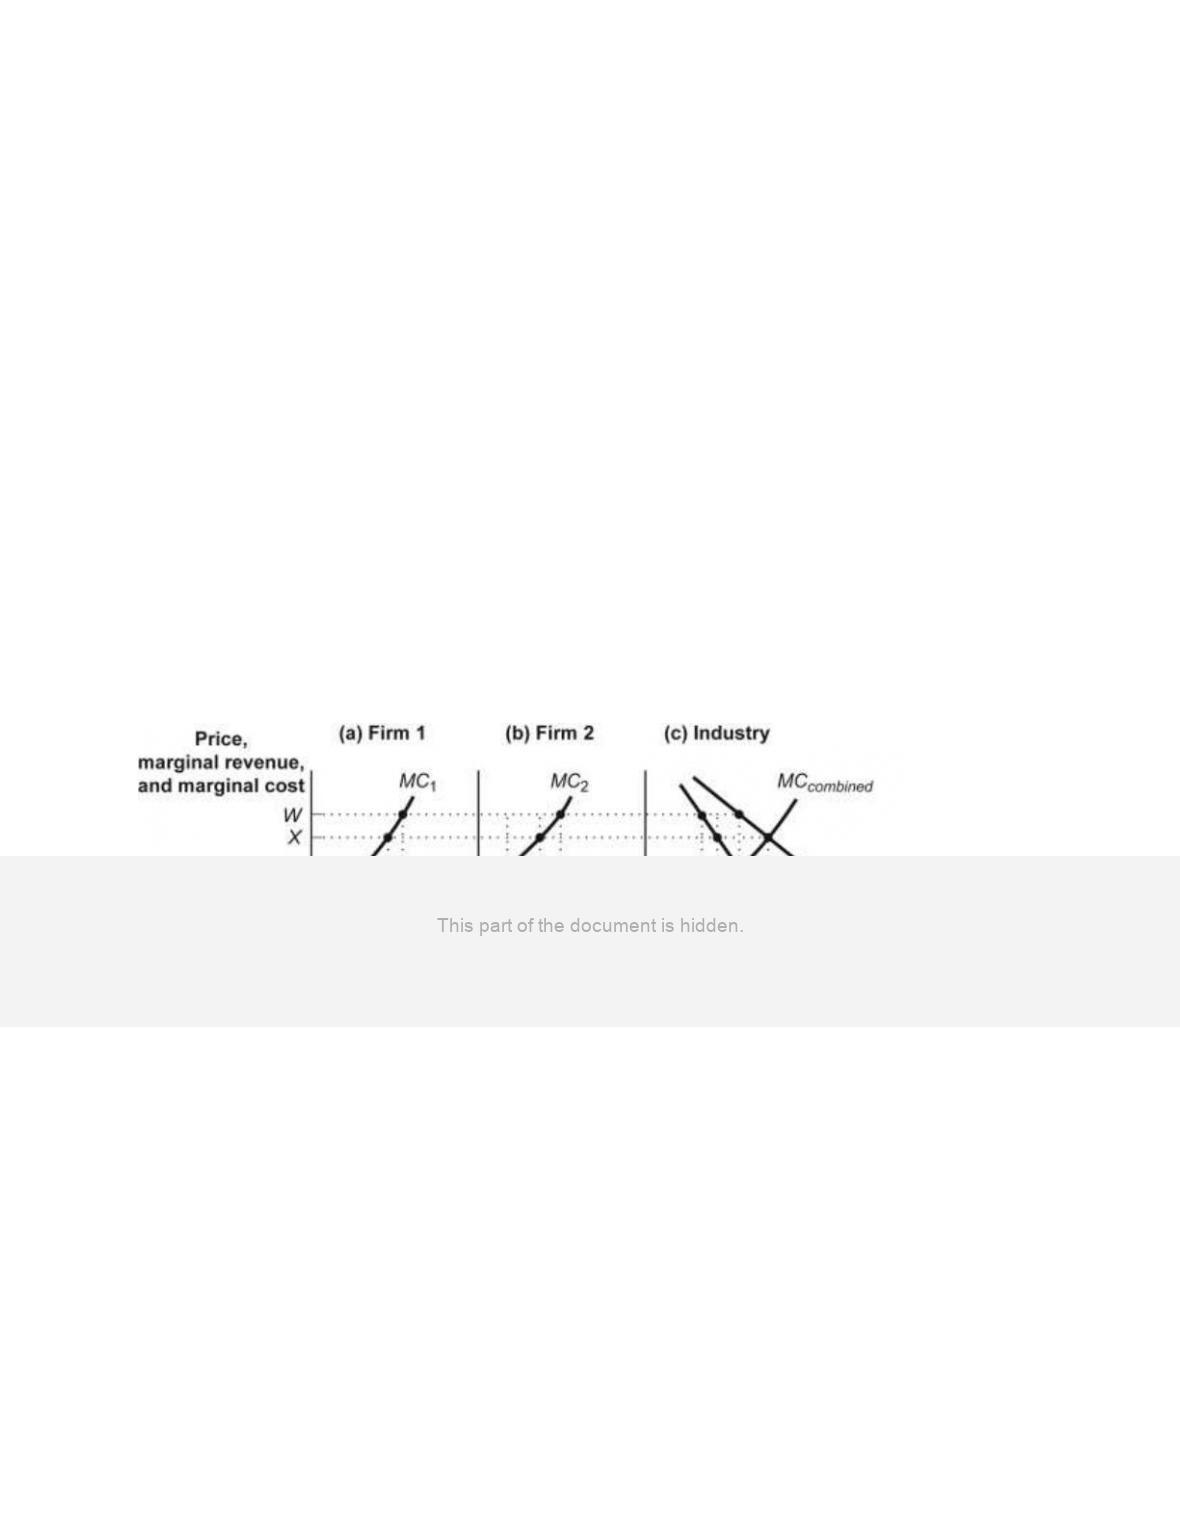
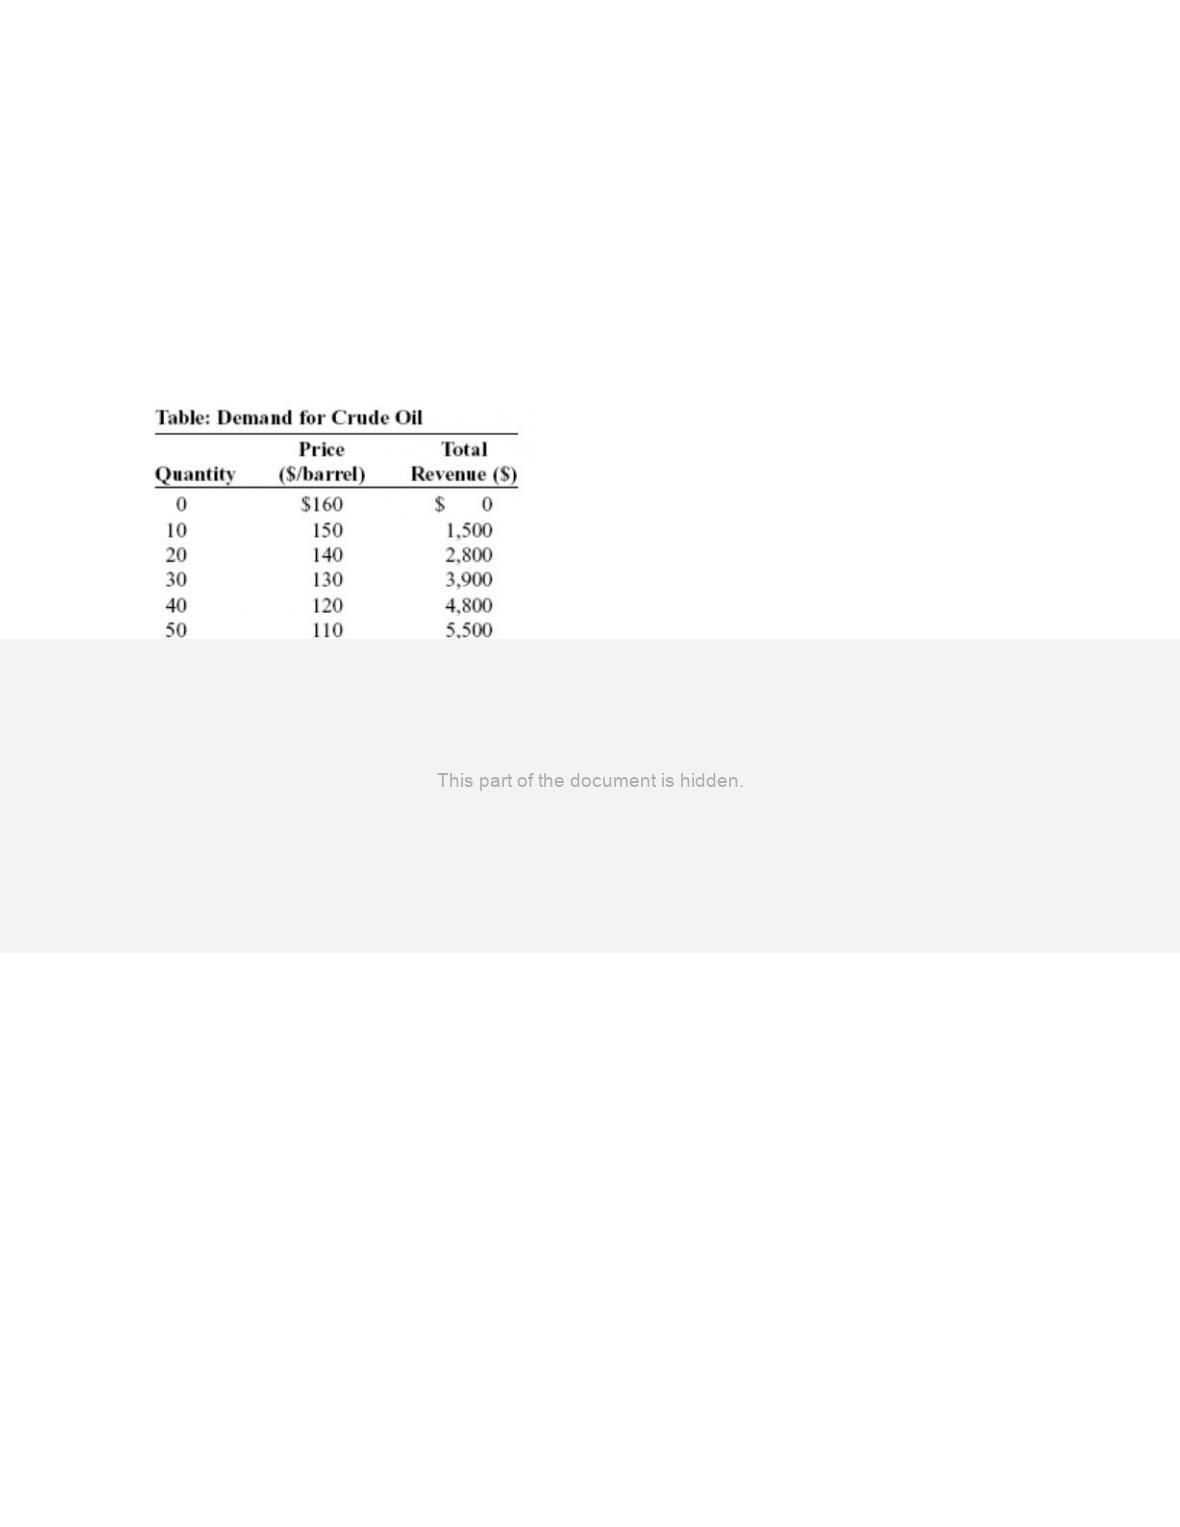
Use the following to answer questions 74-83:
74.
(Table: Demand for Crude Oil) Use Table: Demand for Crude Oil. Assume that the
crude oil industry is a duopoly and the marginal cost of producing crude oil is zero. If
the two firms collude to share the market equally, the price of crude oil will be _____,
firm 1 will produce _____ barrels, firm 2 will produce _____ barrels, and each firm will
earn revenue equal to _____.
A)
$80; 80; 80; $6,400
B)
$80; 40; 40; $3,200
C)
$60; 50; 50; $3,000
D)
$40; 60; 60; $2,400
Page 20
75.
(Table: Demand for Crude Oil) Use Table: Demand for Crude Oil. The marginal cost of
producing crude oil is zero. If the crude oil industry is a monopoly, the price of crude oil
will be _____, the total quantity of crude oil produced by the monopoly will be _____
barrels, and the monopoly will earn revenue equal to _____.
A)
$80; 80; $6,400
B)
$80; 80; $0
C)
$160; 0; $0
D)
$60; 100; $6,000
76.
(Table: Demand for Crude Oil) Use Table: Demand for Crude Oil. Assume that the
crude oil industry is a duopoly and the marginal cost of producing crude oil is zero.
Suppose that the two firms are maximizing industry profit and splitting the profit
evenly. If firm 1 decides to cheat and increase production by 10 more barrels, total
industry output will be _____ barrels.
A)
160
B)
100
C)
90
D)
80
77.
(Table: Demand for Crude Oil) Use Table: Demand for Crude Oil. Assume that the
crude oil industry is a duopoly and the marginal cost of producing crude oil is zero.
Suppose that the two firms are maximizing industry profit and splitting the profit
evenly. If firm 1 decides to cheat and increase production by 10 more barrels, the price
of crude oil will be:
A)
$0.
B)
$70.
C)
$80.
D)
$160.
78.
(Table: Demand for Crude Oil) Use Table: Demand for Crude Oil. Assume that the
crude oil industry is a duopoly and the marginal and fixed cost of producing crude oil
equals zero. Suppose that the two firms are maximizing industry profit and splitting the
profit evenly. If firm 1 decides to cheat and increase production by 10 more barrels, it
will earn profits of:
A)
$6,400.
B)
$6,300.
C)
$3,500.
D)
$2,800.