Page 41
177.
(Figure: Short-Run Costs II) Use Figure: Short-Run Costs II. At 6 units of output,
marginal cost is approximately:
A)
$100.
B)
$120.
C)
$250.
D)
$200.
178.
(Figure: Short-Run Costs II) Use Figure: Short-Run Costs II. At 6 units of output,
average total cost is approximately:
A)
$100.
B)
$120.
C)
$170.
D)
$250.
179.
(Figure: Short-Run Costs II) Use Figure: Short-Run Costs II. At 6 units of output,
average variable cost is approximately:
A)
$100.
B)
$120.
C)
$200.
D)
$250.
Use the following to answer questions 180-193:
Page 42
180.
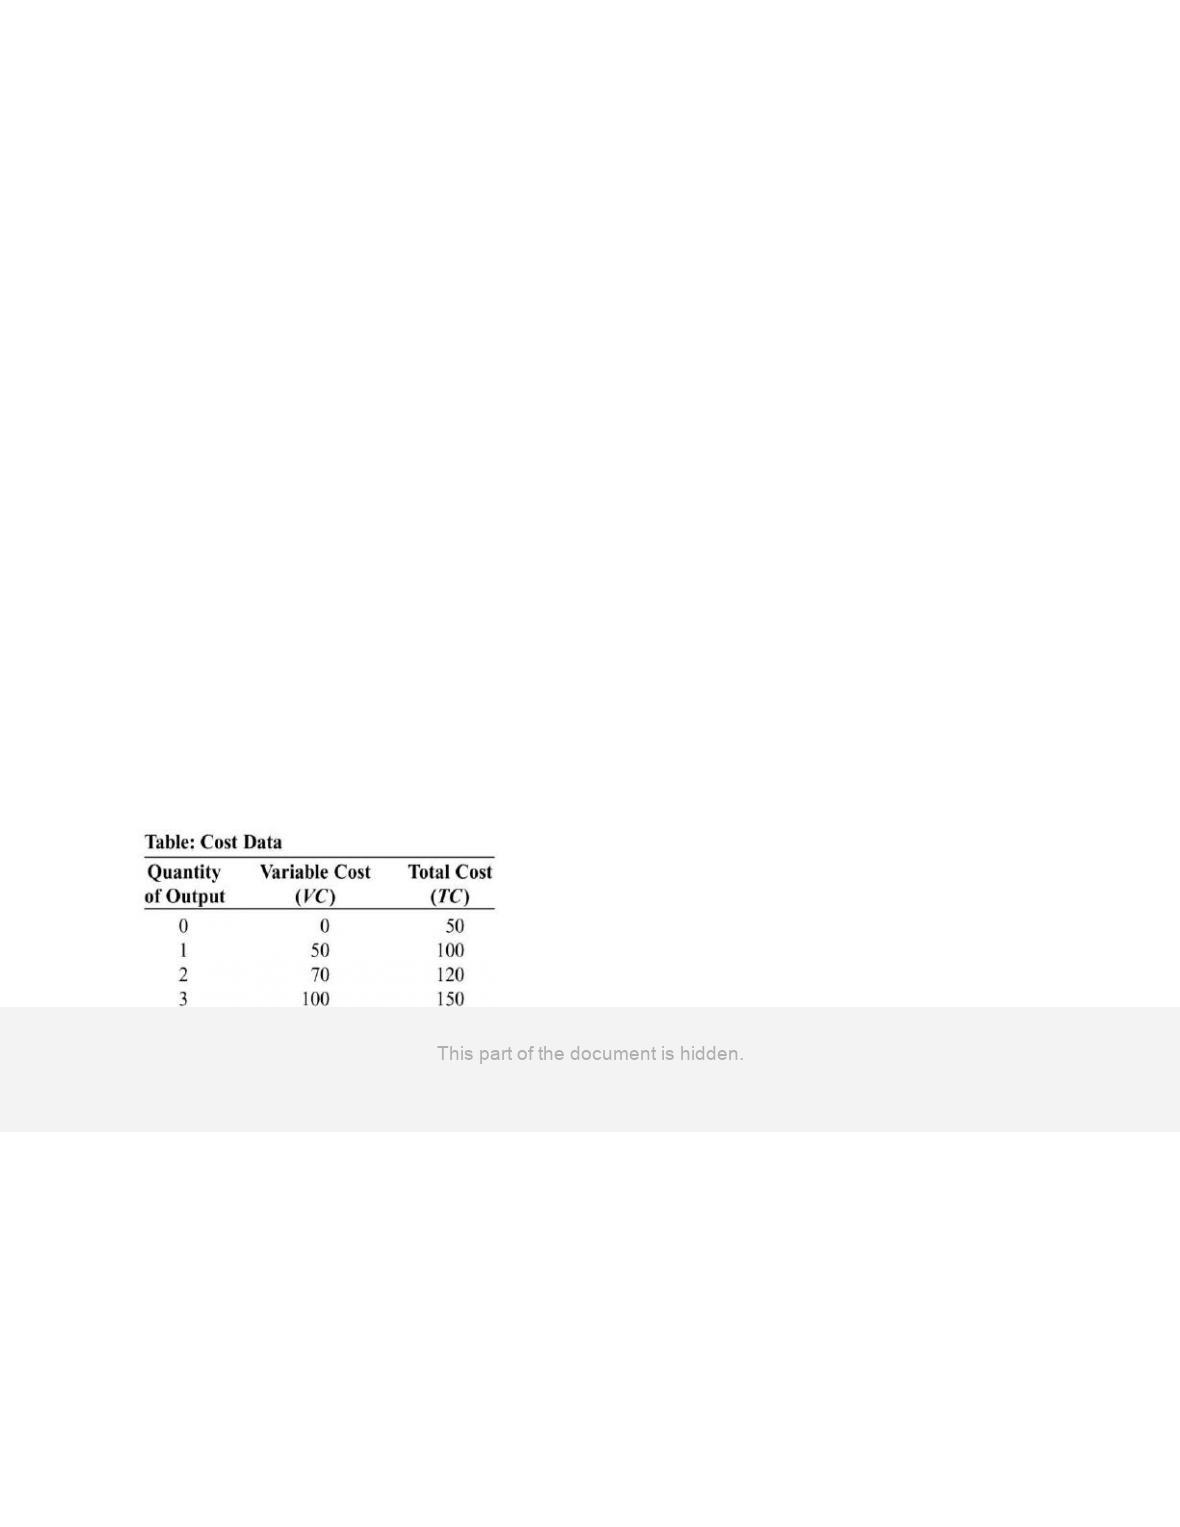
(Table: Cost Data) Use Table: Cost Data. When the purse factory produces 5 units of
output (purses):
A)
marginal cost is above average total cost, and average total cost is rising.
B)
average total cost is above average variable cost, and average variable cost is
falling.
C)
marginal cost is below average variable cost, and average variable cost is falling.
D)
marginal cost is above average variable cost and below average total cost, and
average total cost is rising.
181.
(Table: Cost Data) Use Table: Cost Data. The average variable cost of producing 2
purses is:
A)
$190.
B)
$70.
C)
$50.
D)
$35.
182.
(Table: Cost Data) Use Table: Cost Data. The average fixed cost of producing 2 purses
is:
A)
$0.
B)
$50.
C)
$25.
D)
$2.
183.
(Table: Cost Data) Use Table: Cost Data. The average total cost of producing 2 purses
is:
A)
$60.
B)
$120.
C)
$190.
D)
$220.
184.
(Table: Cost Data) Use Table: Cost Data. The marginal cost of producing the second
purse is:
A)
$60.
B)
$50.
C)
$35.
D)
$20.
Page 43
185.
(Table: Cost Data) Use Table: Cost Data. The average variable cost of producing 4
purses is:
A)
$190.00.
B)
$140.00.
C)
$47.50.
D)
$35.00.
186.
(Table: Cost Data) Use Table: Cost Data. The average fixed cost of producing 4 purses
is:
A)
$12.50.
B)
$47.50.
C)
$50.00.
D)
$82.50.
187.
(Table: Cost Data) Use Table: Cost Data. The average total cost of producing 4 purses
is:
A)
$12.50.
B)
$47.50.
C)
$50.00.
D)
$82.50.
188.
(Table: Cost Data) Use Table: Cost Data. The marginal cost of producing the fourth
purse is:
A)
$60.
B)
$50.
C)
$40.
D)
$20.
189.
(Table: Cost Data) Use Table: Cost Data. The average total cost of producing 6 purses
is:
A)
$190.
B)
$70.
C)
$50.
D)
$35.
Page 44
190.
(Table: Cost Data) Use Table: Cost Data. The average fixed cost of producing 5 purses
is:
A)
$0.
B)
$50.
C)
$25.
D)
$10.
191.
(Table: Cost Data) Use Table: Cost Data. The average variable cost of producing 5
purses is:
A)
$10.
B)
$38.
C)
$48.
D)
$190.
192.
(Table: Cost Data) Use Table: Cost Data. The average total cost of producing 5 purses
is:
A)
$10.
B)
$38.
C)
$48.
D)
$240.
193.
(Table: Cost Data) Use Table: Cost Data. The marginal cost of producing the fifth purse
is:
A)
$60.
B)
$50.
C)
$35.
D)
$20.
Use the following to answer questions 194-196:
Page 45
194.
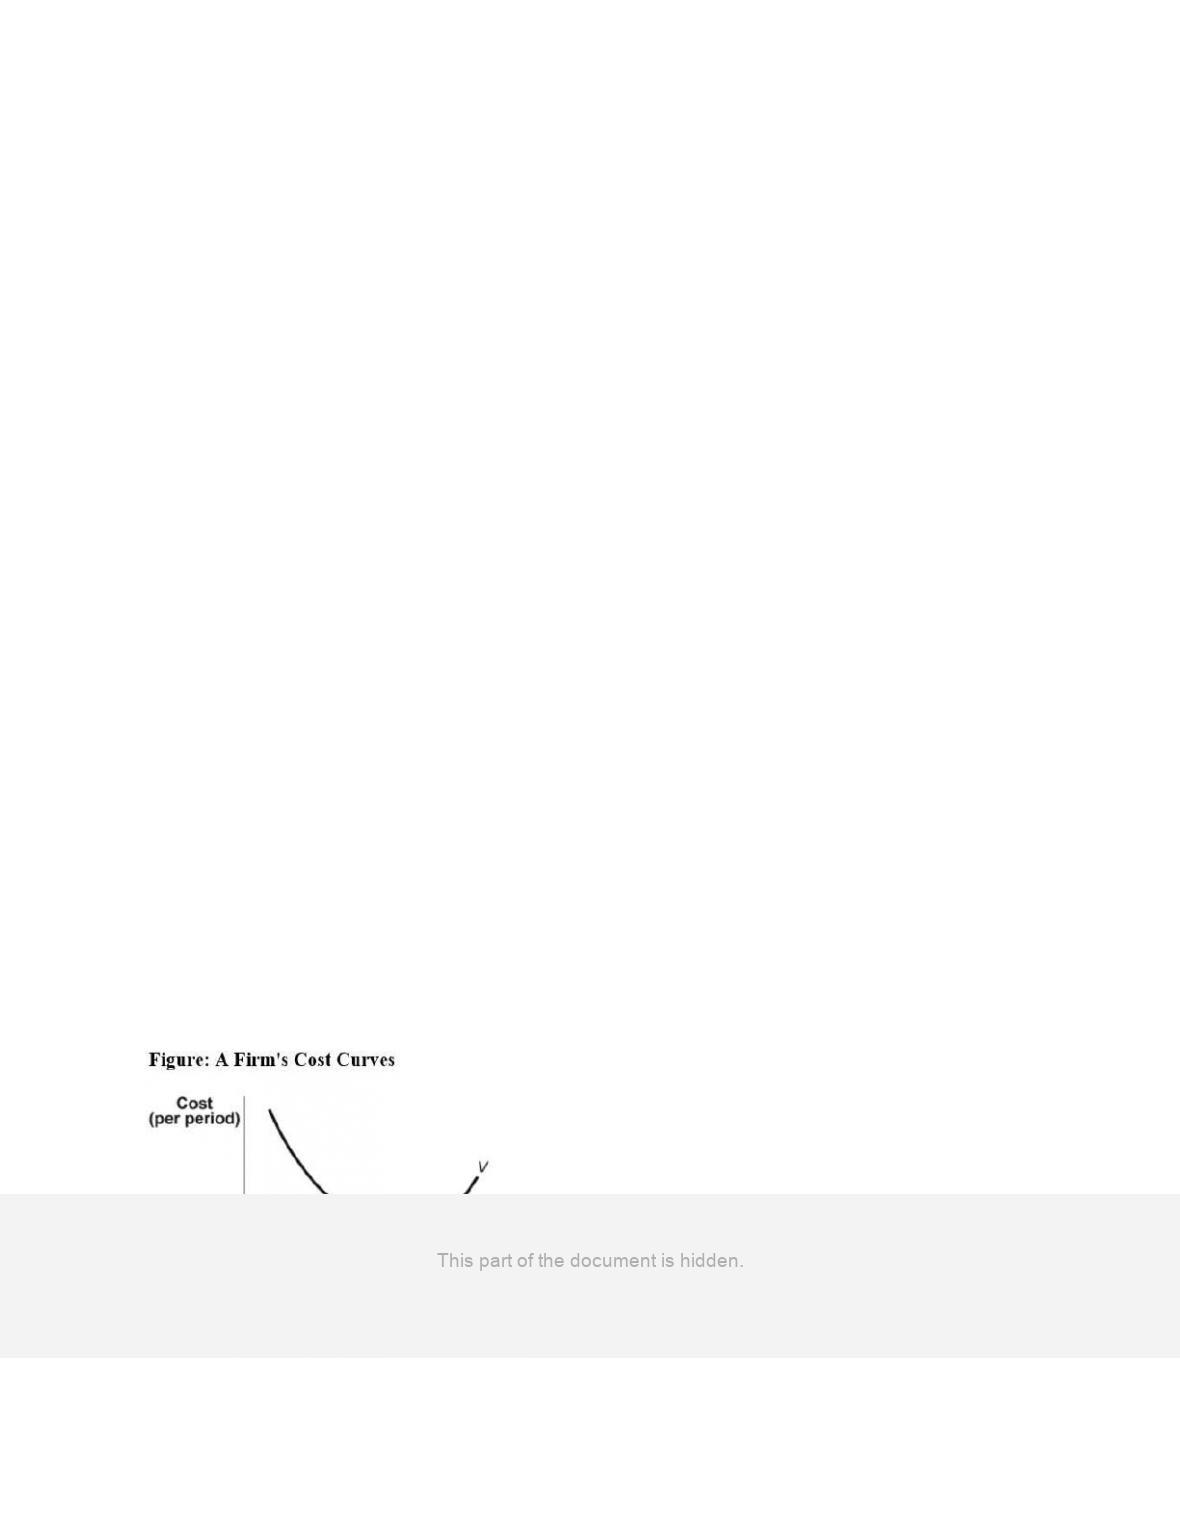
(Figure: A Firm’s Cost Curves) Use Figure: A Firm’s Cost Curves. The curve labeled V
represents the firm’s _____ cost curve.
A)
total
B)
average total
C)
marginal
D)
average variable
195.
(Figure: A Firm’s Cost Curves) Use Figure: A Firm’s Cost Curves. The curve labeled W
represents the firm’s _____ cost curve.
A)
average fixed
B)
average total
C)
average variable
D)
total variable
196.
(Figure: A Firm’s Cost Curves) Use Figure: A Firm’s Cost Curves. The curve X
represents the firm’s _____ cost curve.
A)
marginal
B)
average total
C)
average fixed
D)
average variable
197.
The long-run average total cost curve is tangent to an infinite number of short-run _____
cost curves.
A)
total
B)
marginal
C)
average variable
D)
average total
198.
Where the long-run average total cost curve is at its lowest point, it is tangent to the
_____ of the corresponding short-run average total cost curve.
A)
minimum
B)
maximum
C)
right of the minimum
D)
left of the minimum

199.
At quantities less than the long-run minimum cost per unit of output, the long-run
average total cost curve is _____ of the corresponding short-run average total cost
curve.
A)
tangent to the minimum
B)
tangent to the maximum
C)
to the right of the minimum
D)
to the left of the minimum
200.
At quantities greater than the long-run minimum cost per unit of output, the long-run
average total cost curve is _____ of the corresponding short-run average total cost
curve.
A)
tangent to the minimum
B)
tangent to the maximum
C)
to the right of the minimum
D)
to the left of the minimum
201.
(Figure: Long-Run and Short-Run Average Cost Curves) Use Figure: Long-Run and
Short-Run Average Cost Curves. If a firm faced the long-run average total cost curve
shown in the figure and it expected to produce 100,000 units of the good in the long run,
the firm should build the plant associated with:
Ref 11-18 Figure: Long-Run and Short-Run Average Cost Curves
A)
ATC1.
B)
ATC2.
C)
ATC3.
D)
ATC1 or ATC2.
202.
(Figure: Long-Run and Short-Run Average Cost Curves) Use Figure: Long-Run and
Short-Run Average Cost Curves. If a firm is producing at point C on the ATC2 but
anticipates increasing output to 225,000 units in the long run, the firm will build a
_____ plant and have _____ of scale.
A)
smaller; economies
B)
smaller; diseconomies
C)
bigger; economies
D)
bigger; diseconomies
203.
In the long run, all costs are:
A)
fixed.
B)
constant.
C)
variable.
D)
marginal.
Page 47
204.
In the long run:
A)
all factors are fixed.
B)
all factors are variable.
C)
production choices are more limited than in the short run.
D)
production is always greater than zero.
205.
When a firm adds physical capital, in the short run fixed costs will:
A)
increase.
B)
decrease.
C)
remain the same.
D)
decrease at first and then increase.
206.
When a firm adds capital, in the short run workers will be:
A)
less productive and let the machines do most of the work.
B)
more productive, since they have more equipment.
C)
at the same level of productivity.
D)
more productive at first and then less productive after a few weeks.
207.
When a firm adds capital, in the short run variable costs for any level of output will:
A)
increase.
B)
decrease.
C)
remain the same.
D)
increase at first and then decrease.
Use the following to answer questions 208-234:
Page 48
208.
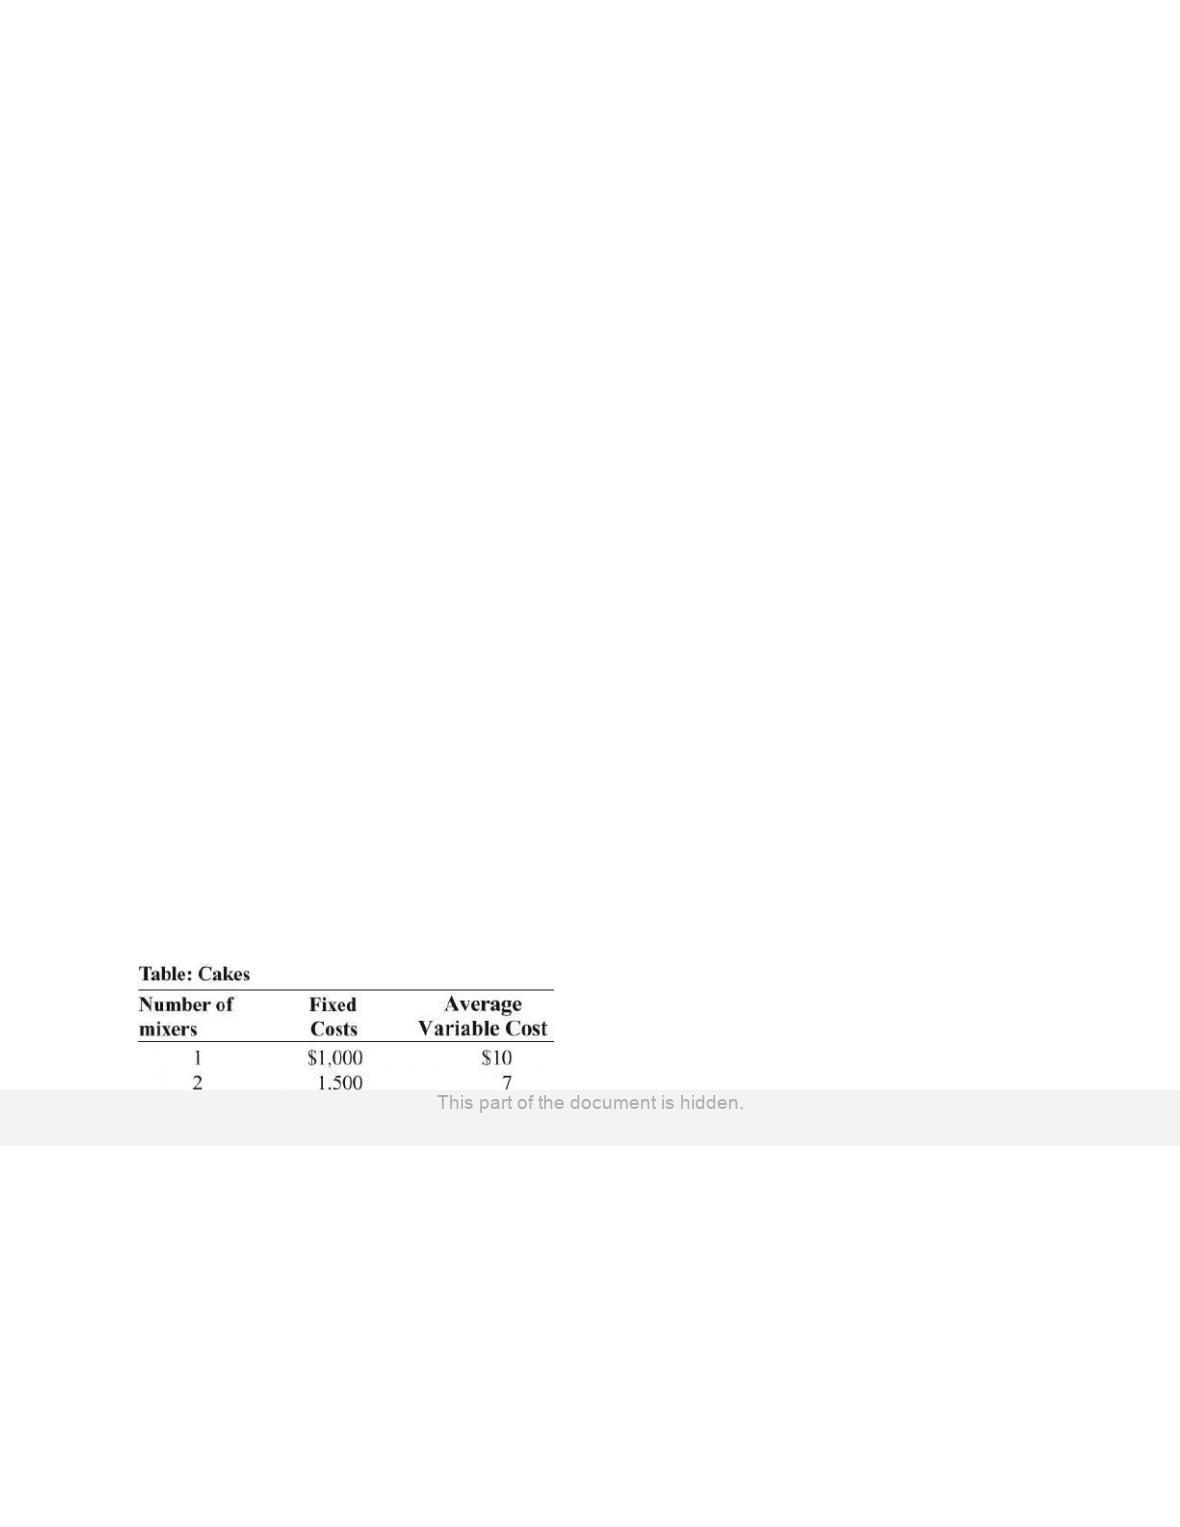
(Table: Cakes) Use Table: Cakes. Pat is opening a bakery to make and sell special
birthday cakes. She is trying to decide how many mixers to purchase. Her estimated
fixed and average variable costs if she purchases 1, 2, or 3 mixers are shown in the
table. Assume that average variable costs do not vary with the quantity of output. If Pat
purchases 1 mixer and bakes 100 cakes per day, what is her average fixed cost?
A)
$10,000
B)
$1,000
C)
$15
D)
$10
209.
(Table: Cakes) Use Table: Cakes. Pat is opening a bakery to make and sell special
birthday cakes. She is trying to decide how many mixers to purchase. Her estimated
fixed and average variable costs if she purchases 1, 2, or 3 mixers are shown in the
table. Assume that average variable costs do not vary with the quantity of output. If Pat
purchases 1 mixer and bakes 100 cakes per day, what is her average total cost?
A)
$1,010
B)
$20
C)
$15
D)
$10
210.
(Table: Cakes) Use Table: Cakes. Pat is opening a bakery to make and sell special
birthday cakes. She is trying to decide how many mixers to purchase. Her estimated
fixed and average variable costs if she purchases 1, 2, or 3 mixers are shown in the
table. Assume that average variable costs do not vary with the quantity of output. If Pat
purchases 1 mixer and bakes 200 cakes per day, what is her average fixed cost?
A)
$5
B)
$10
C)
$200
D)
$1,000
211.
(Table: Cakes) Use Table: Cakes. Pat is opening a bakery to make and sell special
birthday cakes. She is trying to decide how many mixers to purchase. Her estimated
fixed and average variable costs if she purchases 1, 2, or 3 mixers are shown in the
table. Assume that average variable costs do not vary with the quantity of output. If Pat
purchases 1 mixer and bakes 200 cakes per day, what is her average total cost?
A)
$5
B)
$15
C)
$200
D)
$1,000
212.
(Table: Cakes) Use Table: Cakes. Pat is opening a bakery to make and sell special
birthday cakes. She is trying to decide how many mixers to purchase. Her estimated
fixed and average variable costs if she purchases 1, 2, or 3 mixers are shown in the
table. Assume that average variable costs do not vary with the quantity of output. If Pat
purchases 1 mixer and bakes 400 cakes per day, what is her average fixed cost?
A)
$0.025
B)
$2.50
C)
$1,000
D)
$400,000
213.
(Table: Cakes) Use Table: Cakes. Pat is opening a bakery to make and sell special
birthday cakes. She is trying to decide how many mixers to purchase. Her estimated
fixed and average variable costs if she purchases 1, 2, or 3 mixers are shown in the
table. Assume that average variable costs do not vary with the quantity of output. If Pat
purchases 1 mixer and bakes 400 cakes per day, what is her average total cost?
A)
$2.50
B)
$10
C)
$12.50
D)
$1,010
214.
(Table: Cakes) Use Table: Cakes. Pat is opening a bakery to make and sell special
birthday cakes. She is trying to decide how many mixers to purchase. Her estimated
fixed and average variable costs if she purchases 1, 2, or 3 mixers are shown in the
table. Assume that average variable costs do not vary with the quantity of output. If Pat
purchases 1 mixer, her average fixed cost _____ in the range of output between 100 and
400 cakes.
A)
increases
B)
decreases
C)
remains the same
D)
can’t be calculated
215.
(Table: Cakes) Use Table: Cakes. Pat is opening a bakery to make and sell special
birthday cakes. She is trying to decide how many mixers to purchase. Her estimated
fixed and average variable costs if she purchases 1, 2, or 3 mixers are shown in the
table. Assume that average variable costs do not vary with the quantity of output. If Pat
purchases 1 mixer, her average total cost _____ in the range of output between 100 and
400 cakes.
A)
increases
B)
decreases
C)
remains the same
D)
can’t be calculated
Page 50
216.
(Table: Cakes) Use Table: Cakes. Pat is opening a bakery to make and sell special
birthday cakes. She is trying to decide how many mixers to purchase. Her estimated
fixed and average variable costs if she purchases 1, 2, or 3 mixers are shown in the
table. Assume that average variable costs do not vary with the quantity of output. If Pat
purchases 2 mixers and bakes 100 cakes per day, what is her average fixed cost?
A)
$10,000
B)
$1,000
C)
$15
D)
$10
217.
(Table: Cakes) Use Table: Cakes. Pat is opening a bakery to make and sell special
birthday cakes. She is trying to decide how many mixers to purchase. Her estimated
fixed and average variable costs if she purchases 1, 2, or 3 mixers are shown in the
table. Assume that average variable costs do not vary with the quantity of output. If Pat
purchases 2 mixers and bakes 100 cakes per day, what is her average total cost?
A)
$8
B)
$10
C)
$15
D)
$22
218.
(Table: Cakes) Use Table: Cakes. Pat is opening a bakery to make and sell special
birthday cakes. She is trying to decide how many mixers to purchase. Her estimated
fixed and average variable costs if she purchases 1, 2, or 3 mixers are shown in the
table. Assume that average variable costs do not vary with the quantity of output. If Pat
purchases 2 mixers and bakes 200 cakes per day, what is her average fixed cost?
A)
$300,000
B)
$1,508
C)
$187.50
D)
$7.50
219.
(Table: Cakes) Use Table: Cakes. Pat is opening a bakery to make and sell special
birthday cakes. She is trying to decide how many mixers to purchase. Her estimated
fixed and average variable costs if she purchases 1, 2, or 3 mixers are shown in the
table. Assume that average variable costs do not vary with the quantity of output. If Pat
purchases 2 mixers and bakes 200 cakes per day, what is her average total cost?
A)
$8
B)
$14.50
C)
$1,492
D)
$1,508
Page 51
220.
(Table: Cakes) Use Table: Cakes. Pat is opening a bakery to make and sell special
birthday cakes. She is trying to decide how many mixers to purchase. Her estimated
fixed and average variable costs if she purchases 1, 2, or 3 mixers are shown in the
table. Assume that average variable costs do not vary with the quantity of output. If Pat
purchases 2 mixers and bakes 400 cakes per day, what is her average fixed cost?
A)
$0.02
B)
$3.75
C)
$500
D)
$1,508
221.
(Table: Cakes) Use Table: Cakes. Pat is opening a bakery to make and sell special
birthday cakes. She is trying to decide how many mixers to purchase. Her estimated
fixed and average variable costs if she purchases 1, 2, or 3 mixers are shown in the
table. Assume that average variable costs do not vary with the quantity of output. If Pat
purchases 2 mixers and bakes 400 cakes per day, what is her average total cost?
A)
$0.02
B)
$10.75
C)
$500
D)
$1,507
222.
(Table: Cakes) Use Table: Cakes. Pat is opening a bakery to make and sell special
birthday cakes. She is trying to decide how many mixers to purchase. Her estimated
fixed and average variable costs if she purchases 1, 2, or 3 mixers are shown in the
table. Assume that average variable costs do not vary with the quantity of output. If Pat
purchases 2 mixers, her average fixed cost _____ in the range of output between 100
and 400 cakes.
A)
increases
B)
decreases
C)
remains the same
D)
can’t be calculated
223.
(Table: Cakes) Use Table: Cakes. Pat is opening a bakery to make and sell special
birthday cakes. She is trying to decide how many mixers to purchase. Her estimated
fixed and average variable costs if she purchases 1, 2, or 3 mixers are shown in the
table. Assume that average variable costs do not vary with the quantity of output. If Pat
purchases 2 mixers, her average total cost _____ in the range of output between 100 and
400 cakes.
A)
increases
B)
decreases
C)
remains the same
D)
can’t be calculated

Page 52
224.
(Table: Cakes) Use Table: Cakes. Pat is opening a bakery to make and sell special
birthday cakes. She is trying to decide how many mixers to purchase. Her estimated
fixed and average variable costs if she purchases 1, 2, or 3 mixers are shown in the
table. Assume that average variable costs do not vary with the quantity of output. If Pat
purchases 3 mixers and bakes 100 cakes per day, what is her average fixed cost?
A)
$4
B)
$25
C)
$2,496
D)
$10,000
225.
(Table: Cakes) Use Table: Cakes. Pat is opening a bakery to make and sell special
birthday cakes. She is trying to decide how many mixers to purchase. Her estimated
fixed and average variable costs if she purchases 1, 2, or 3 mixers are shown in the
table. Assume that average variable costs do not vary with the quantity of output. If Pat
purchases 3 mixers and bakes 100 cakes per day, what is her average total cost?
A)
$4
B)
$25
C)
$29
D)
$625
226.
(Table: Cakes) Use Table: Cakes. Pat is opening a bakery to make and sell special
birthday cakes. She is trying to decide how many mixers to purchase. Her estimated
fixed and average variable costs if she purchases 1, 2, or 3 mixers are shown in the
table. Assume that average variable costs do not vary with the quantity of output. If Pat
purchases 3 mixers and bakes 200 cakes per day, what is her average fixed cost?
A)
$0.05
B)
$2.50
C)
$5.00
D)
$12.50
227.
(Table: Cakes) Use Table: Cakes. Pat is opening a bakery to make and sell special
birthday cakes. She is trying to decide how many mixers to purchase. Her estimated
fixed and average variable costs if she purchases 1, 2, or 3 mixers are shown in the
table. Assume that average variable costs do not vary with the quantity of output. If Pat
purchases 3 mixers and bakes 200 cakes per day, what is her average total cost?
A)
$50.00
B)
$12.50
C)
$16.50
D)
$800.00
Page 53
228.
(Table: Cakes) Use Table: Cakes. Pat is opening a bakery to make and sell special
birthday cakes. She is trying to decide how many mixers to purchase. Her estimated
fixed and average variable costs if she purchases 1, 2, or 3 mixers are shown in the
table. Assume that average variable costs do not vary with the quantity of output. If Pat
purchases 3 mixers and bakes 400 cakes per day, what is her average fixed cost?
A)
$0.05
B)
$2.50
C)
$5.00
D)
$6.25
229.
(Table: Cakes) Use Table: Cakes. Pat is opening a bakery to make and sell special
birthday cakes. She is trying to decide how many mixers to purchase. Her estimated
fixed and average variable costs if she purchases 1, 2, or 3 mixers are shown in the
table. Assume that average variable costs do not vary with the quantity of output. If Pat
purchases 3 mixers and bakes 400 cakes per day, what is her average total cost?
A)
$10.25
B)
$12.50
C)
$16.50
D)
$2,504.00
230.
(Table: Cakes) Use Table: Cakes. Pat is opening a bakery to make and sell special
birthday cakes. She is trying to decide how many mixers to purchase. Her estimated
fixed and average variable costs if she purchases 1, 2, or 3 mixers are shown in the
table. Assume that average variable costs do not vary with the quantity of output. If Pat
purchases 3 mixers, her average fixed cost _____ in the range of output between 100
and 400 cakes.
A)
increases
B)
decreases
C)
remains the same
D)
can’t be calculated
231.
(Table: Cakes) Use Table: Cakes. Pat is opening a bakery to make and sell special
birthday cakes. She is trying to decide how many mixers to purchase. Her estimated
fixed and average variable costs if she purchases 1, 2, or 3 mixers are shown in the
table. Assume that average variable costs do not vary with the quantity of output. If Pat
purchases 3 mixers, her average total cost _____ in the range of output between 100 and
400 cakes.
A)
increases
B)
decreases
C)
remains the same
D)
can’t be calculated
Page 54
232.
(Table: Cakes) Use Table: Cakes. Pat is opening a bakery to make and sell special
birthday cakes. She is trying to decide how many mixers to purchase. Her estimated
fixed and average variable costs if she purchases 1, 2, or 3 mixers are shown in the
table. Assume that average variable costs do not vary with the quantity of output. How
many mixers should Pat buy to get the lowest average total cost if she plans to make 100
cakes?
A)
1
B)
2
C)
3
D)
Can’t be determined without more information
233.
(Table: Cakes) Use Table: Cakes. Pat is opening a bakery to make and sell special
birthday cakes. She is trying to decide how many mixers to purchase. Her estimated
fixed and average variable costs if she purchases 1, 2, or 3 mixers are shown in the
table. Assume that average variable costs do not vary with the quantity of output. How
many mixers should Pat buy to get the lowest average total cost if she plans to make 200
cakes?
A)
1
B)
2
C)
3
D)
Can’t be determined without more information
234.
(Table: Cakes) Use Table: Cakes. Pat is opening a bakery to make and sell special
birthday cakes. She is trying to decide how many mixers to purchase. Her estimated
fixed and average variable costs if she purchases 1, 2, or 3 mixers are shown in the
table. Assume that average variable costs do not vary with the quantity of output. How
many mixers should Pat buy to get the lowest average total cost if she plans to make 400
cakes?
A)
1
B)
2
C)
3
D)
Can’t be determined without more information
235.
The long-run average cost curve will be upward-sloping when the firm has:
A)
economies of scale.
B)
diseconomies of scale.
C)
constant returns to scale.
D)
diminishing returns.
Page 55
Use the following to answer question 236:
236.
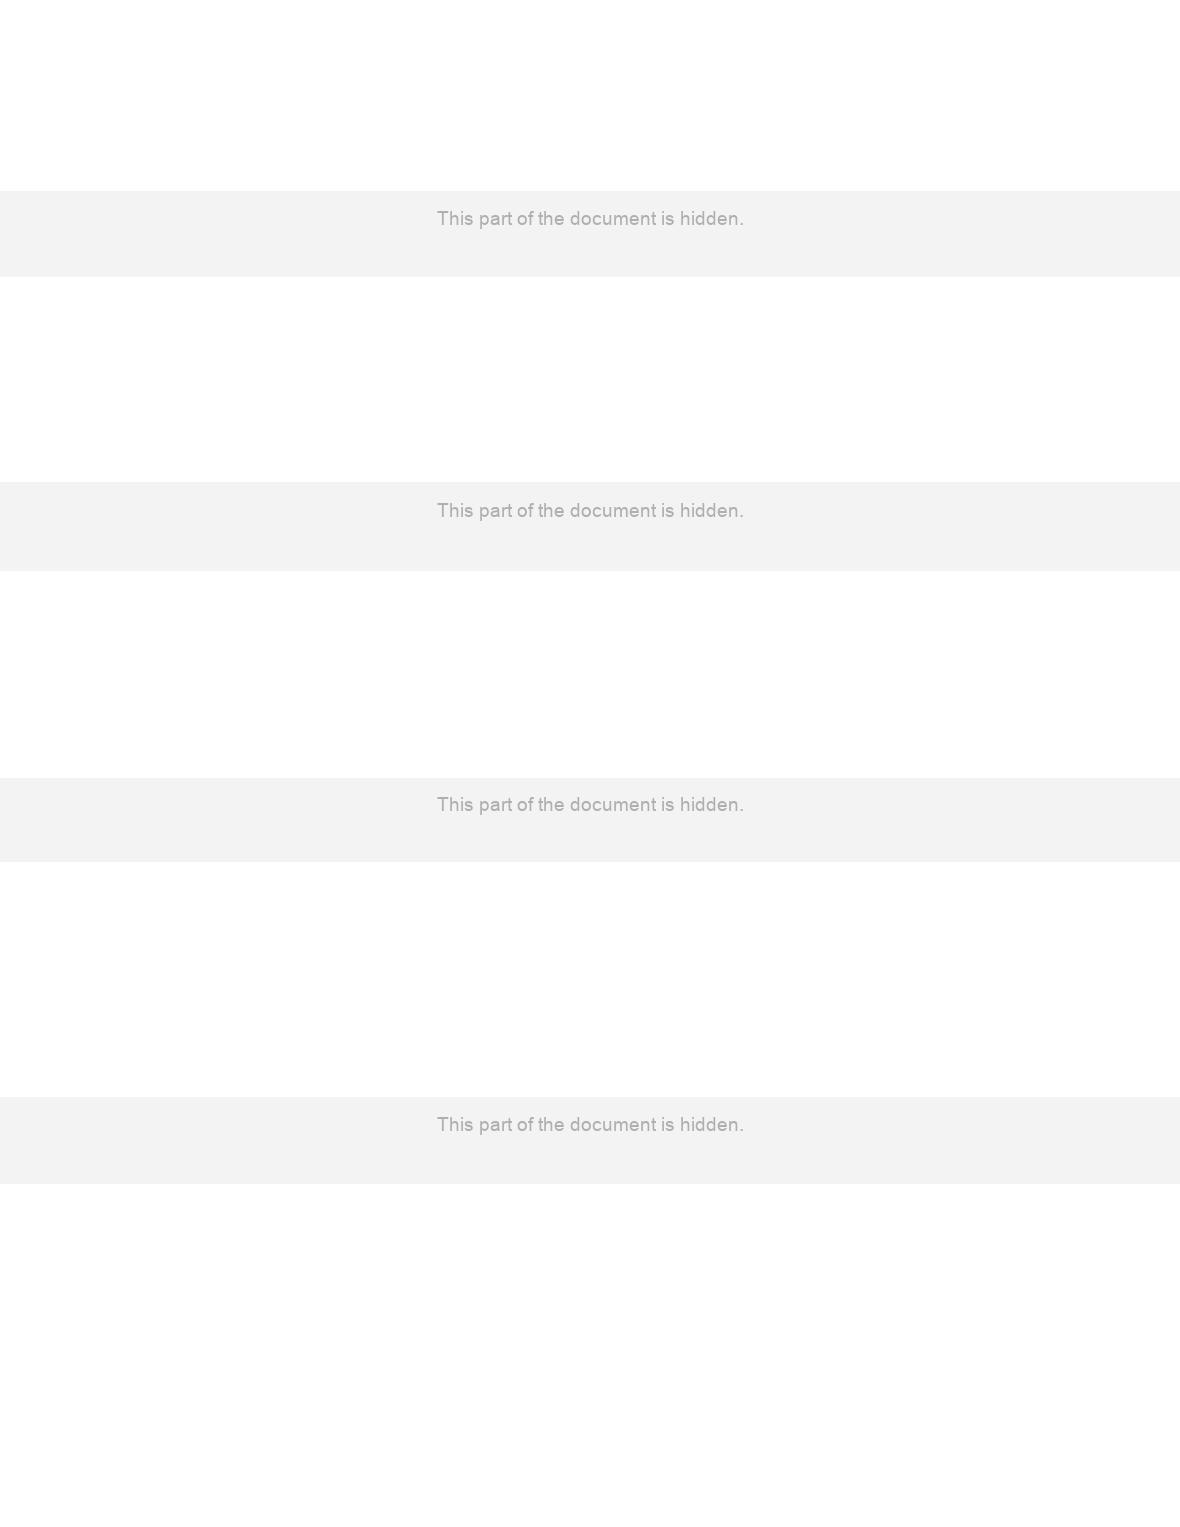
(Table: Long-Run Total Cost) Use Table: Long-Run Total Cost. This soybean grower
receives constant returns to scale over the _____ and _____ bushels.
A)
first; second
B)
third; fourth
C)
fourth; fifth
D)
fifth; sixth
237.
When an increase in the firm’s output reduces its long-run average total cost, it achieves
_____ scale.
A)
economies of
B)
diseconomies of
C)
constant returns to
D)
variable returns to
238.
A university that benefits from lower costs per enrolled student as it builds more
buildings and enrolls more students is an example of a service provider with:
A)
economies of scale.
B)
diseconomies of scale.
C)
increasing opportunity costs.
D)
scale reduction.
239.
The slope of a long-run average total cost curve exhibiting diseconomies of scale is:
A)
zero.
B)
infinite.
C)
positive.
D)
negative.
Page 56
240.
When diseconomies of scale occur:
A)
long-run average cost rises.
B)
marginal cost declines.
C)
average total cost declines.
D)
average variable cost declines.
Use the following to answer questions 241-245:
241.
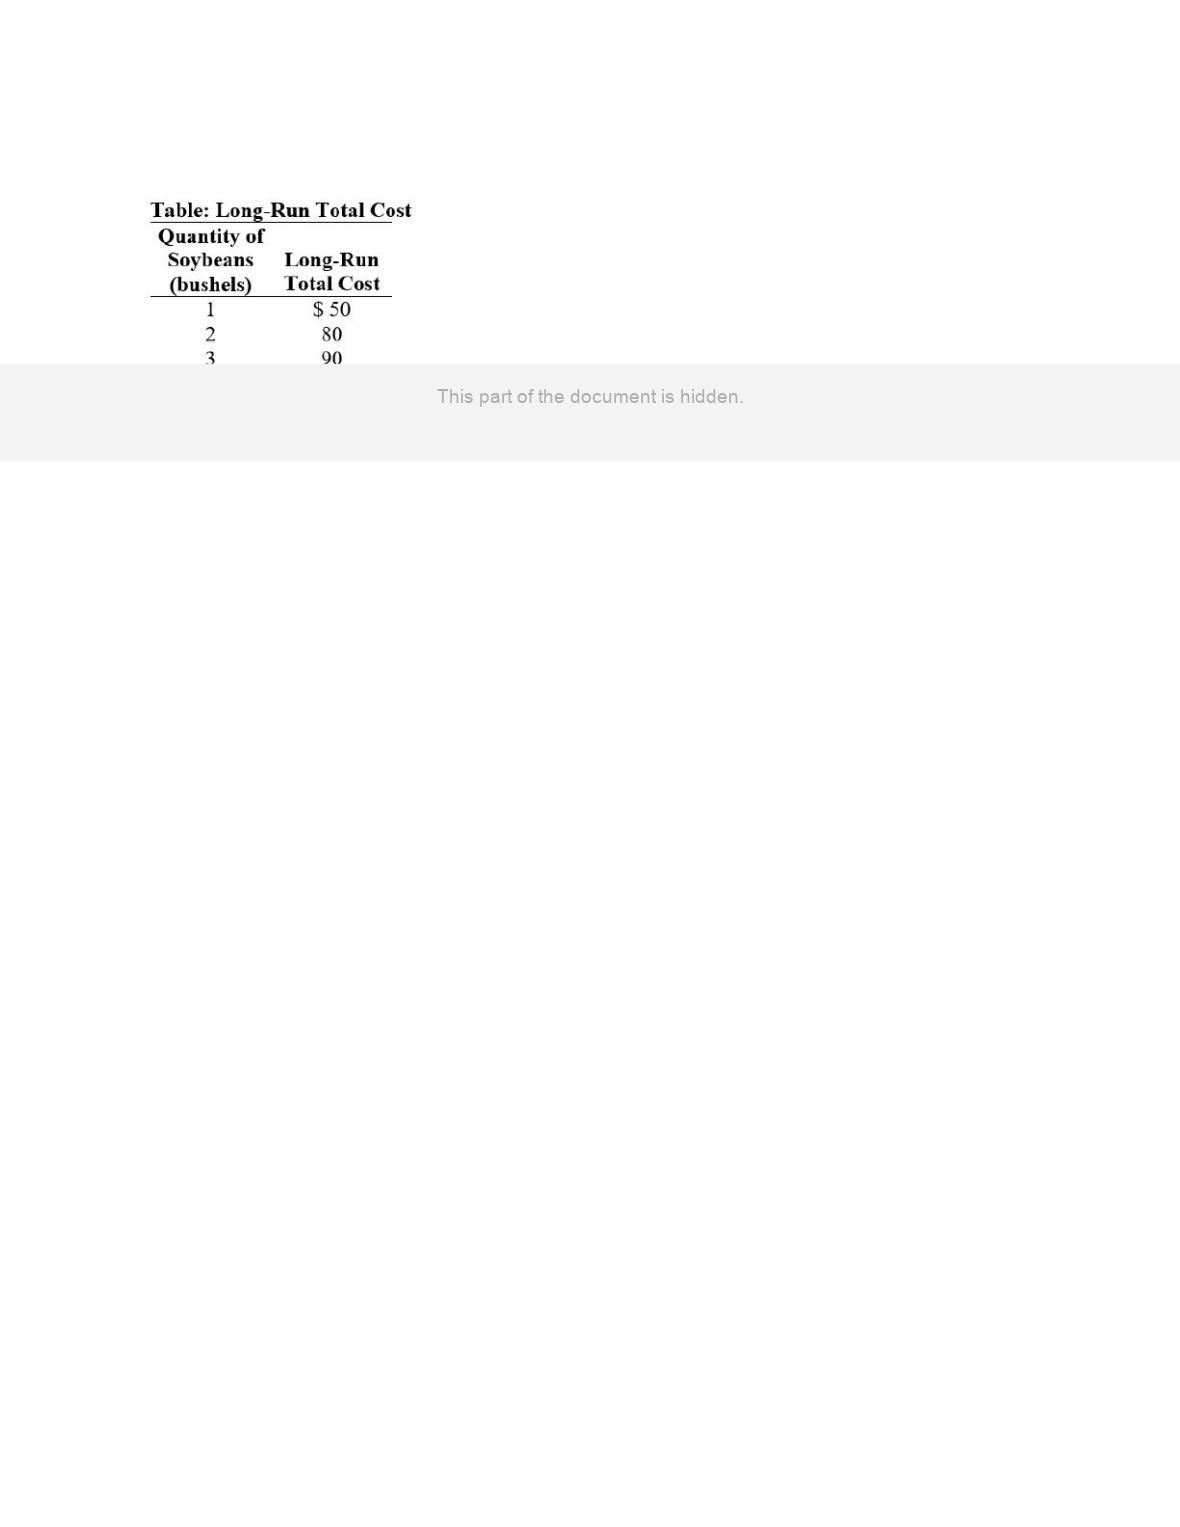
(Figure: Long-Run Average Cost) Use Figure: Long-Run Average Cost. This firm has
_____ in the output region from 0 to A.
A)
diseconomies of scale
B)
constant returns to scale
C)
economies of scale
D)
negative costs of production
242.
(Figure: Long-Run Average Cost) Use Figure: Long-Run Average Cost. This firm has
_____ in the output region from A to B.
A)
constant returns to scale
B)
economies of scale
C)
diseconomies of scale
D)
constant total cost as output increases
243.
(Figure: Long-Run Average Cost) Use Figure: Long-Run Average Cost. This firm has
_____ in the output region from B to C.
A)
constant returns to scale
B)
diseconomies of scale
C)
economies of scale
D)
falling marginal cost
Page 57
244.
(Figure: Long-Run Average Cost) Use Figure: Long-Run Average Cost. This firm has
_____ in the output region from 0 to A.
A)
decreasing returns to scale
B)
constant returns to scale
C)
increasing returns to scale
D)
negative costs of production
245.
(Figure: Long-Run Average Cost) Use Figure: Long-Run Average Cost. This firm has
_____ in the output region from B to C.
A)
constant returns to scale
B)
decreasing returns to scale
C)
increasing returns to scale
D)
falling marginal cost
246.
A firm that is able to use its inputs more efficiently as it increases production in the long
run BEST demonstrates:
A)
economies of scale.
B)
diseconomies of scale.
C)
labor-intensive production.
D)
capital-intensive production.
247.
A firm that has diminishing returns in the management’s ability to use and disseminate
information as it increases production in the long run BEST demonstrates:
A)
economies of scale.
B)
diseconomies of scale.
C)
being too small for the relevant market.
D)
not having enough managers.
248.
It is common in large breweries for the long-run average total cost to decline as output
increases. This indicates that many breweries operate with:
A)
diseconomies of scale.
B)
diminishing marginal returns.
C)
economies of scale.
D)
constant returns to scale.

Page 58
249.
Buffalo Aircraft doubles the amount of all of the inputs it uses—the factory doubles in
size and twice as many workers are hired. After this expansion, the number of aircraft
produced triples. If the price of inputs is unchanged, this means that Buffalo Aircraft is
operating with:
A)
increasing marginal cost.
B)
economies of scale.
C)
increasing average total cost.
D)
decreasing average variable cost.
250.
The long-run average total cost of producing 100 units of output is $4, while the
long-run average cost of producing 110 units of output is $4. These numbers suggest
that between 100 and 110 units of output, the firm producing this output has:
A)
economies of scale.
B)
diseconomies of scale.
C)
constant returns to scale.
D)
diminishing returns.
251.
The -shape of the long-run average total cost curve is primarily due to:
A)
technological change.
B)
economies and diseconomies of scale.
C)
fixed costs.
D)
diminishing returns.
252.
When an increase in the firm’s output reduces its long-run average total cost, it has
_____ returns to scale.
A)
increasing
B)
decreasing
C)
constant
D)
variable
253.
If your firm is operating in the negatively sloped portion of a long-run average total cost
curve, then your production exhibits:
A)
higher wages.
B)
increasing returns to scale.
C)
decreasing returns to scale.
D)
increased input prices.
Page 59
254.
A manufacturing company that benefits from lower costs per unit as it grows is an
example of a firm exhibiting:
A)
increasing returns to scale.
B)
decreasing returns to scale.
C)
increasing opportunity costs.
D)
scale reduction.
255.
A firm that has lower costs per unit as it increases production in the long run has:
A)
increasing returns to scale.
B)
decreasing returns to scale.
C)
increasing opportunity costs.
D)
scale reduction.
256.
The slope of a long-run average total cost curve exhibiting decreasing returns to scale is:
A)
zero.
B)
infinite.
C)
positive.
D)
negative.
257.
Decreasing and increasing returns to scale account for the shape of the:
A)
short-run average total cost curve.
B)
short-run average variable cost curve.
C)
long-run average total cost curve.
D)
marginal cost curve in both the short run and the long run.
258.
The slope of a long-run average total cost curve exhibiting increasing returns to scale is:
A)
zero.
B)
infinite.
C)
positive.
D)
negative.
Page 60
Use the following to answer questions 259-266:
259.
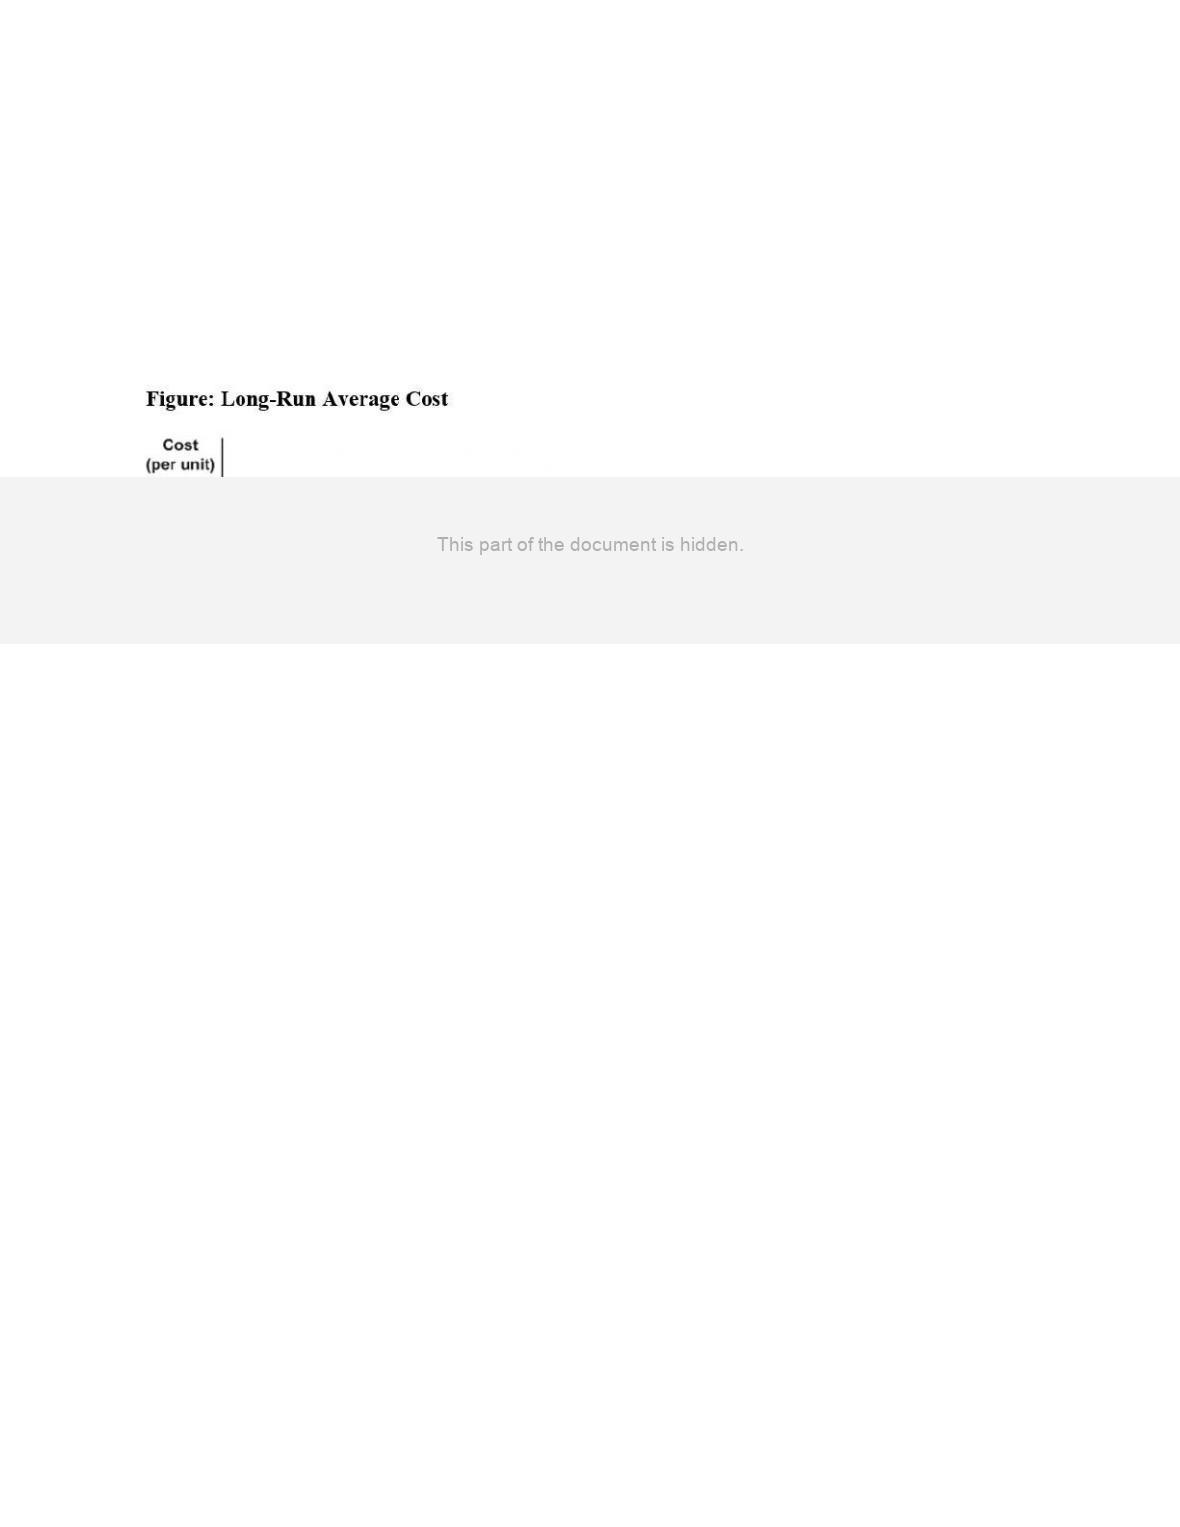
(Table: Workers and Output) Use Table: Workers and Output. After graduation, you
achieve your dream of opening an art shop that specializes in selling mud statues. You
pay $10 per day on a loan from your uncle, regardless of how much you produce. You
also pay $10 per day to each of the workers who you hire to make the mud statues. The
fixed cost of producing 25 statues is:
A)
$10.
B)
$20.
C)
$25.
D)
$35.
260.
(Table: Workers and Output) Use Table: Workers and Output. After graduation, you
achieve your dream of opening an art shop that specializes in selling mud statues. You
pay $10 per day on a loan from your uncle, regardless of how much you produce. You
also pay $10 per day to each of the workers who you hire to make the mud statues. The
variable cost of producing 25 statues is:
A)
$10.
B)
$20.
C)
$25.
D)
$35.
261.
(Table: Workers and Output) Use Table: Workers and Output. After graduation, you
achieve your dream of opening an art shop that specializes in selling mud statues. You
pay $10 per day on a loan from your uncle, regardless of how much you produce. You
also pay $10 per day to each of the workers who you hire to make the mud statues. The
total cost of producing 25 statues is:
A)
$10.
B)
$20.
C)
$25.
D)
$30.