Page 21
87.
(Figure: Consumer Equilibrium I) Use Figure Consumer Equilibrium I. What is Owen’s
marginal rate of substitution of pizza for soda when he is consuming his optimal
consumption bundle?
A)
0.75
B)
1.5
C)
13.3
D)
20
88.
(Figure: Consumer Equilibrium I) Use Figure Consumer Equilibrium I. If in equilibrium
Owen receives marginal utility of 10 utils from the last pizza he consumes, his marginal
utility from the last soda must be _____ utils.
A)
0.50
B)
0.75
C)
1.5
D)
13.3
89.
LaToya sees honey and sugar as perfect substitutes. She is always willing to substitute 1
teaspoon of honey for 2 teaspoons of sugar. If honey is three times as expensive as
sugar, LaToya will use:
A)
only honey.
B)
only sugar.
C)
some honey and some sugar.
D)
a lot of sugar and a little honey.
90.
LaToya sees honey and sugar as perfect substitutes. She is always willing to substitute 1
teaspoon of honey for 2 teaspoons of sugar. If the price of honey is half that of sugar,
LaToya will use:
A)
only honey.
B)
only sugar.
C)
a lot of honey and a little sugar.
D)
a lot of sugar and a little honey.
91.
LaToya sees honey and sugar as perfect substitutes. She is always willing to substitute 1
teaspoon of honey for 2 teaspoons of sugar. If honey is twice as expensive as sugar,
LaToya will:
A)
use only honey.
B)
use only sugar.
C)
use a lot of honey and a little sugar.
D)
be willing to purchase either sugar or honey.
Page 22
92.
If Coke and Pepsi are perfect substitutes for Lynn, her indifference curves are:
A)
right angles.
B)
concave from the origin.
C)
downward-sloping straight lines.
D)
vertical lines.
93.
Jake considers fries and onion rings perfect substitutes. The indifference curve between
fries and onion rings must be:
A)
a right angle.
B)
concave.
C)
perfectly vertical.
D)
a straight line.
94.
Mario sees popcorn and pretzels as perfect substitutes. He is always willing to substitute
3 cups of popcorn for 1 cup of pretzels. His indifference curves for popcorn and pretzels
are _____, and at the optimal consumption bundle his marginal rate of substitution of
popcorn for pretzels is _____.
A)
right angles; 3
B)
right angles; 0.33
C)
straight lines; 3
D)
straight lines; 0.33
95.
Mario sees popcorn and pretzels as perfect substitutes. He is always willing to substitute
3 cups of popcorn for 1 cup of pretzels. If Mario consumes only pretzels, then we know
that the relative price of popcorn in terms of pretzels is:
A)
less than 0.33.
B)
between 0.33 and 3.
C)
3.
D)
greater than 3.
96.
Mario sees popcorn and pretzels as perfect substitutes. He is always willing to substitute
3 cups of popcorn for 1 cup of pretzels. If Mario consumes only popcorn, then we know
that the relative price of popcorn in terms of pretzels is:
A)
less than 0.33.
B)
greater than 0.33.
C)
between 0.33 and 3.
D)
greater than 3.
Page 23
97.
Mario sees popcorn and pretzels as perfect substitutes. He is always willing to substitute
3 cups of popcorn for 1 cup of pretzels. If the price of a cup of popcorn equals the price
of a cup of pretzels, Mario will eat:
A)
only pretzels.
B)
only popcorn.
C)
mostly pretzels.
D)
The answer is impossible to determine.
98.
Mario sees popcorn and pretzels as perfect substitutes. He is always willing to substitute
3 cups of popcorn for 1 cup of pretzels. If the price of a cup of popcorn is $4 and the
price of a cup of pretzels is $1, Mario will eat:
A)
only pretzels.
B)
only popcorn.
C)
mostly pretzels.
D)
The answer is impossible to determine.
99.
Mario sees popcorn and pretzels as perfect substitutes. He is always willing to substitute
3 cups of popcorn for 1 cup of pretzels. If the price of a cup of popcorn is $3 and the
price of a cup of pretzels is $1, Mario will eat:
A)
only pretzels.
B)
only popcorn.
C)
mostly pretzels.
D)
The answer is impossible to determine.
100.
Alison is a traveling salesperson who drives many miles each day to visit her clients.
She gets utility from the purchase of gasoline, but she doesn’t care which brand of
gasoline she consumes. Suppose she has a daily budget of $100 for gasoline and can
purchase from two companies, PB and Noxxe. Today she notices that the price of a
gallon of gas at PB is $2.50 and the price of a gallon of gas at Noxxe is $3.33. What is
her optimal purchase of gas?
A)
40 gallons at PB and 30 gallons at Noxxe
B)
none at PB and 30 gallons at Noxxe
C)
20 gallons at PB and 15 gallons at Noxxe
D)
40 gallons at PB and none at Noxxe
Page 24
101.
Mr. Black always consumes coffee and cream in fixed proportions—8 ounces of coffee
to 1 ounce of cream. This implies that for Mr. Black the marginal rate of substitution of
coffee for cream is:
A)
0.125.
B)
8.
C)
diminishing but between 8 and 1.
D)
undefined.
102.
Mr. Black always consumes coffee and cream in fixed proportions—8 ounces of coffee
to 1 ounce of cream. This implies that for Mr. Black:
A)
coffee and cream are perfect substitutes.
B)
the indifference curves for coffee and cream are tangent.
C)
8 ounces of coffee and 2 ounces of cream yields more utility than 8 ounces of
coffee and 1 ounce of cream.
D)
coffee and cream are perfect complements.
103.
Ms. Sweettooth always consumes iced tea and sugar in fixed proportions: 8 ounces of
iced tea to 3 teaspoons of sugar. Which of the following combinations of iced tea and
sugar will give Ms. Sweettooth the highest total utility?
A)
8 ounces of iced tea and 3 teaspoons of sugar
B)
24 ounces of iced tea and 3 teaspoons of sugar
C)
8 ounces of iced tea and 9 teaspoons of sugar
D)
All of the combinations noted give the same total utility.
104.
Ms. Sweettooth always consumes iced tea and sugar in fixed proportions: 8 ounces of
iced tea to 3 teaspoons of sugar. This implies that for Ms. Sweettooth the marginal rate
of substitution of iced tea for sugar is:
A)
0.375.
B)
2.67.
C)
diminishing but between 8 and 3.
D)
undefined.
105.
Ms. Sweettooth always consumes iced tea and sugar in fixed proportions: 8 ounces of
iced tea to 3 teaspoons of sugar. This implies that for Ms. Sweettooth:
A)
iced tea and sugar are perfect substitutes.
B)
the indifference curves for iced tea and sugar are parallel.
C)
8 ounces of iced tea and 3 teaspoons of sugar yield exactly the same utility as 16
ounces of iced tea and 6 teaspoons of sugar.
D)
iced tea and sugar are perfect complements.
Page 25
106.
Cookie Monster always consumes cookies and milk in fixed proportions: 4 cookies to 8
ounces of milk. Which of the following combinations of cookies and milk will give
Cookie Monster the highest total utility?
A)
8 cookies and 16 ounces of milk
B)
4 cookies and 8 ounces of milk
C)
4 cookies and 16 ounces of milk
D)
4 cookies and 4 ounces of milk
107.
Cookie Monster always consumes cookies and milk in fixed proportions: 4 cookies to 8
ounces of milk. This implies that for Cookie Monster the marginal rate of substitution of
cookies for milk is:
A)
0.5.
B)
2.
C)
diminishing but between 8 and 4.
D)
undefined.
108.
Josh is a house painter who always purchases two paintbrushes for every gallon of paint,
regardless of the relative prices. In a graph, these indifference curves would appear as:
A)
straight downward-sloping lines.
B)
downward-sloping lines with a diminishing marginal rate of substitution.
C)
right angles.
D)
upward-sloping straight lines.
Page 26
109.
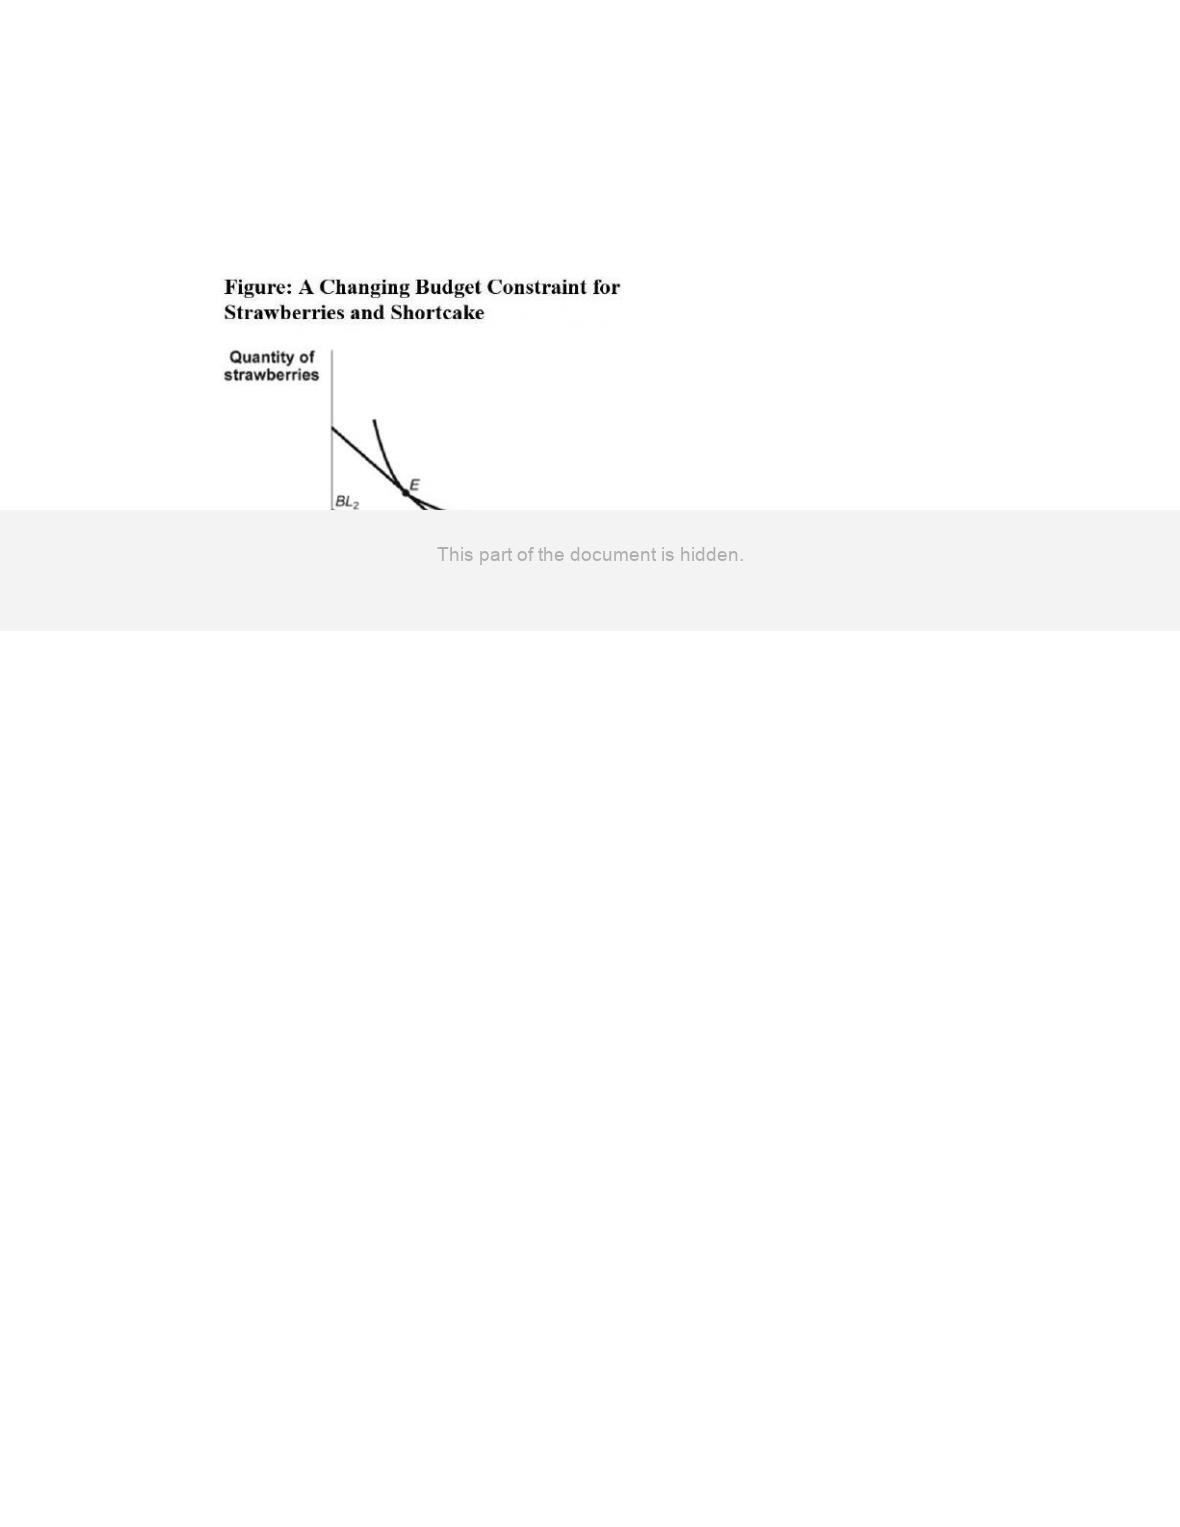
(Figure: A Changing Budget Constraint for Strawberries and Shortcake) Use Figure A
Changing Budget Constraint for Strawberries and Shortcake. Seb’s original budget line
is given by BL1 and his original indifference curve is given by I1. Which of the
following would have caused his budget line to move to BL2?
A)
The price of strawberries increased.
B)
The price of shortcake increased.
C)
Seb’s income decreased.
D)
The price of strawberries decreased.
110.
Suppose the government decides to help poor families with kids by subsidizing the
purchase of milk. The subsidy takes the form of a 50% discount on the price of milk.
Suppose also that poor families buy only milk and soda, which are substitutes, although
not perfect substitutes. What happens to the amount of milk poor families buy?
A)
It increases.
B)
It decreases.
C)
It stays the same.
D)
It depends on the shape of the family’s indifference curve.
111.
Increases in the price of the good measured on the horizontal axis will make the
horizontal intercept _____ and make the budget line _____.
A)
larger; steeper
B)
larger; flatter
C)
smaller; steeper
D)
smaller; flatter
Page 27
112.
Increases in the price of the good measured on the vertical axis will make the vertical
intercept _____ and make the budget line _____.
A)
larger; steeper
B)
larger; flatter
C)
smaller; steeper
D)
smaller; flatter
113.
Decreases in the price of the good measured on the horizontal axis will make the
horizontal intercept _____ and make the budget line _____.
A)
larger; steeper
B)
larger; flatter
C)
smaller; steeper
D)
smaller; flatter
114.
Decreases in the price of the good measured on the vertical axis will make the vertical
intercept _____ and make the budget line _____.
A)
larger; steeper
B)
larger; flatter
C)
smaller; steeper
D)
smaller; flatter
115.
Suppose the government decides to help poor families with kids by subsidizing the
purchase of milk. The subsidy takes the form of a 50% discount in the price of milk.
Suppose also that poor families buy only milk and Spam (an inferior good). What
happens to the amount of Spam poor families buy?
A)
It increases.
B)
It decreases.
C)
It stays the same.
D)
It depends on the shape of the family’s indifference curve.
116.
Gwen is consuming the optimal consumption bundle of potatoes and steak. Call this
bundle A. Her income is $100, the price of steak is $10, and the price of potatoes is $1.
Put potatoes on the vertical axis and put steak on the horizontal axis. Her income
increases to $500, and the prices of steak and potatoes remain constant. With the
increase in income, Gwen changes her consumption of the two goods and now
maximizes utility at bundle B. If potatoes are inferior goods for Gwen,
A)
at bundle B, Gwen consumes more potatoes.
B)
at bundle B, Gwen consumes fewer steaks.
C)
at both bundles, the relative price is 10.
D)
at both bundles, Gwen consumes the same amount of potatoes and steaks.
Page 28
117.
Javon is consuming his optimal utility-maximizing consumption bundle of lobster and
macaroni-and-cheese dinners when he loses his job and has less money to spend. Both
are normal goods. When he adjusts his consumption to reflect the new level of income,
the number of macaroni-and-cheese dinners he consumes:
A)
rises.
B)
falls.
C)
stays the same.
D)
changes, but it is impossible to determine in what way.
118.
Karen consumes gasoline and other goods. A new excise tax on gasoline raises the
price. However, the government pays Karen an income subsidy that is just enough for
her to stay on her original (pretax) indifference curve. Her new optimal consumption
bundle will have:
A)
the same amount of both goods as before.
B)
less gas and more of other goods.
C)
less of other goods and more gas.
D)
This question can’t be answered, since some essential information (such as Karen’s
income and the pretax and taxed prices of gas) is missing.
119.
Frank buys only milk and cereal, both of which are normal goods, and he always
maximizes his utility. Frank’s boss cuts Frank’s pay by $200 per month. What happens
to Frank’s marginal rate of substitution between milk and cereal?
A)
It fluctuates randomly.
B)
It decreases.
C)
It increases.
D)
It stays constant.
120.
If ramen is a Giffen good and the price of ramen decreases:
A)
the substitution effect will cause a decrease in the consumption of ramen.
B)
the income effect will cause a decrease in the consumption of ramen.
C)
the income effect will reinforce the substitution effect, and the consumption of
ramen will decrease.
D)
the demand curve for ramen will still be downward-sloping.
121.
If potatoes are an inferior good and the price of potatoes decreases, the _____ effect will
cause a(n) _____ in the consumption of potatoes.
A)
substitution; decrease
B)
income; increase
C)
income; decrease
D)
substitution effect and the income; decrease
Page 29
122.
If good A is a normal good and its price decreases, the _____ effect will cause a(n)
_____ in consumption of it.
A)
substitution; decrease
B)
income; decrease
C)
income; increase
D)
substitution effect and the income ; decrease
123.
A demand curve is generated from indifference curves by changing:
A)
the price of both goods simultaneously.
B)
the price of one good.
C)
income.
D)
utility.
Use the following to answer questions 124-127:
124.
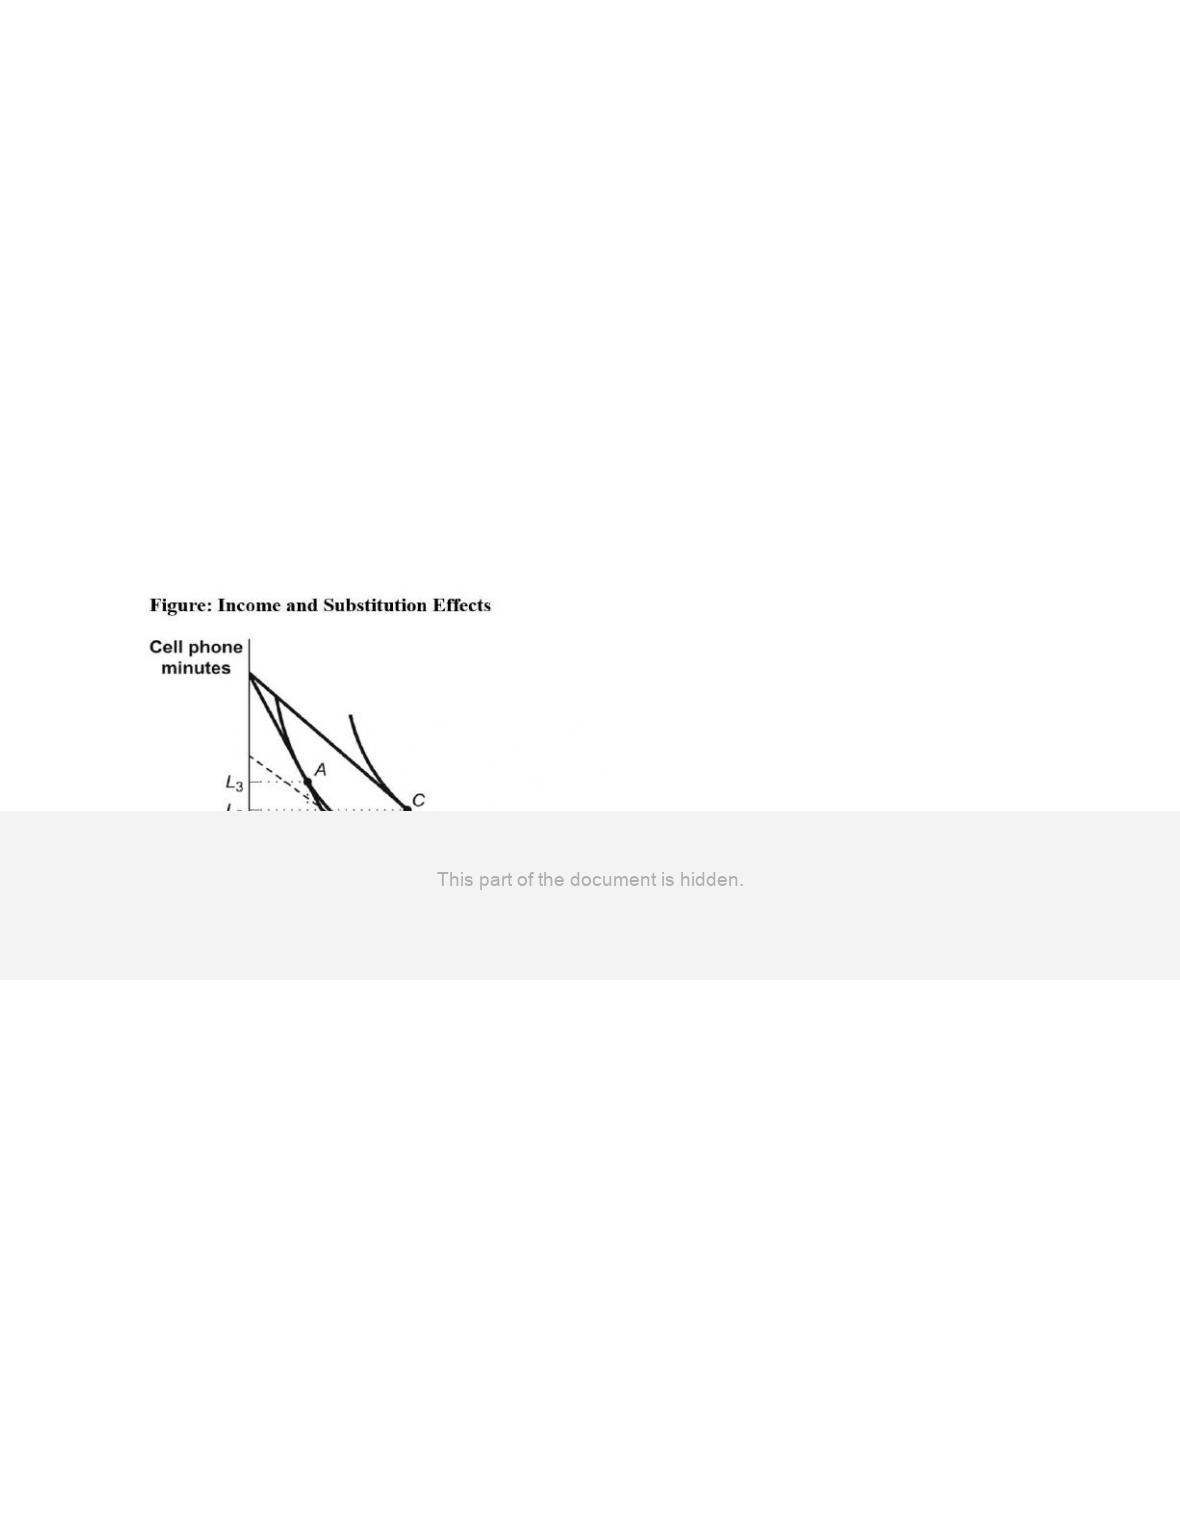
(Figure: Income and Substitution Effects) Use Figure Income and Substitution Effects.
Carlos is consuming his optimal consumption bundle at point A when the price of
gasoline falls. As Carlos moves to his new optimal consumption bundle, we observe that
gasoline:
A)
is not an ordinary good.
B)
is a normal good.
C)
is an inferior good.
D)
and good L are complements.
Page 30
125.
(Figure: Income and Substitution Effects) Use Figure Income and Substitution Effects.
Carlos is consuming his optimal consumption bundle at point A when the price of
gasoline falls. The dashed line tangent to I1 shows a hypothetical budget line reflecting:
A)
the original income, the original price of cell phone minutes, and the new price of
gasoline.
B)
the new price of gasoline in terms of cell phone minutes and a change in income to
keep Carlos on the original indifference curve.
C)
the new price of gasoline in terms of cell phone minutes and a change in income to
allow Carlos to reach an indifference curve higher than I1.
D)
the income and substitution effects.
126.
(Figure: Income and Substitution Effects) Use Figure Income and Substitution Effects.
Carlos is originally consuming his optimal consumption bundle at point A when the
price of gasoline falls. The movement from K1 to K2 reflects the _____ the decrease in
the price of gasoline.
A)
total change in quantity demanded due to
B)
income effect of
C)
substitution effect of
D)
income and substitution effects of
127.
(Figure: Income and Substitution Effects) Use Figure Income and Substitution Effects.
Carlos is consuming his optimal consumption bundle at point A when the price of
gasoline falls. The movement from K2 to K3 reflects the _____ the decrease in the price
of gasoline.
A)
total change in quantity demanded due to
B)
income effect of
C)
substitution effect of
D)
income and substitution effects of
128.
Consumers buy both alcoholic and nonalcoholic beverages. If the government tries to
discourage people from drinking alcoholic beverages by imposing an excise tax on them
but gives consumers an income subsidy to keep the consumers on their original
indifference curves:
A)
the same amount of both goods will be consumed.
B)
fewer alcoholic and more nonalcoholic beverages will be consumed.
C)
more alcoholic and fewer nonalcoholic beverages will be consumed.
D)
it is impossible to determine what will happen to the consumption of alcoholic and
more nonalcoholic beverages.
Page 31
129.
Javon is consuming his optimal utility-maximizing consumption bundle of lobster and
macaroni-and-cheese dinners. Call this bundle A. His income is $100, the price of a
macaroni-and-cheese dinner is $5, and the price of a lobster is $20. Put lobsters on the
vertical axis and put macaroni-and-cheese dinners on the horizontal axis. His income
increases to $500 and the prices of macaroni-and-cheese dinners and lobster remain
constant. With the increase in income, Javon changes his consumption of the two goods
and now maximizes utility at bundle B. If macaroni-and-cheese dinners are an inferior
good for Javon:
A)
at bundle B, Javon consumes more macaroni-and-cheese dinners.
B)
at bundle B, Javon consumes less lobster.
C)
at bundle A and bundle B, the marginal utility of lobster is 5.
D)
at bundle B, Javon consumes more lobster.
130.
Suppose peanut butter is an inferior good for Ilya and the price of peanut butter rises.
What will happen to Ilya’s consumption of peanut butter?
A)
The substitution effect will cause an increase in the consumption of peanut butter.
B)
The substitution effect will cause a decrease in the consumption of peanut butter
and the income effect will cause an increase in the consumption of peanut butter.
C)
The substitution effect will cause a decrease in the consumption of peanut butter.
D)
The income effect will cause an increase in the consumption of peanut butter.
131.
In terms of indifference curves, a demand curve is generated by changes in:
A)
the income effect.
B)
the substitution effect.
C)
the price of one good.
D)
the price of both goods simultaneously.
132.
A _____ can be generated from indifference curves by changing _____.
A)
supply curve; the price of both goods simultaneously
B)
demand curve; the price of one good
C)
demand curve; income
D)
budget line; utility
Page 32
Use the following to answer questions 133-136:
133.
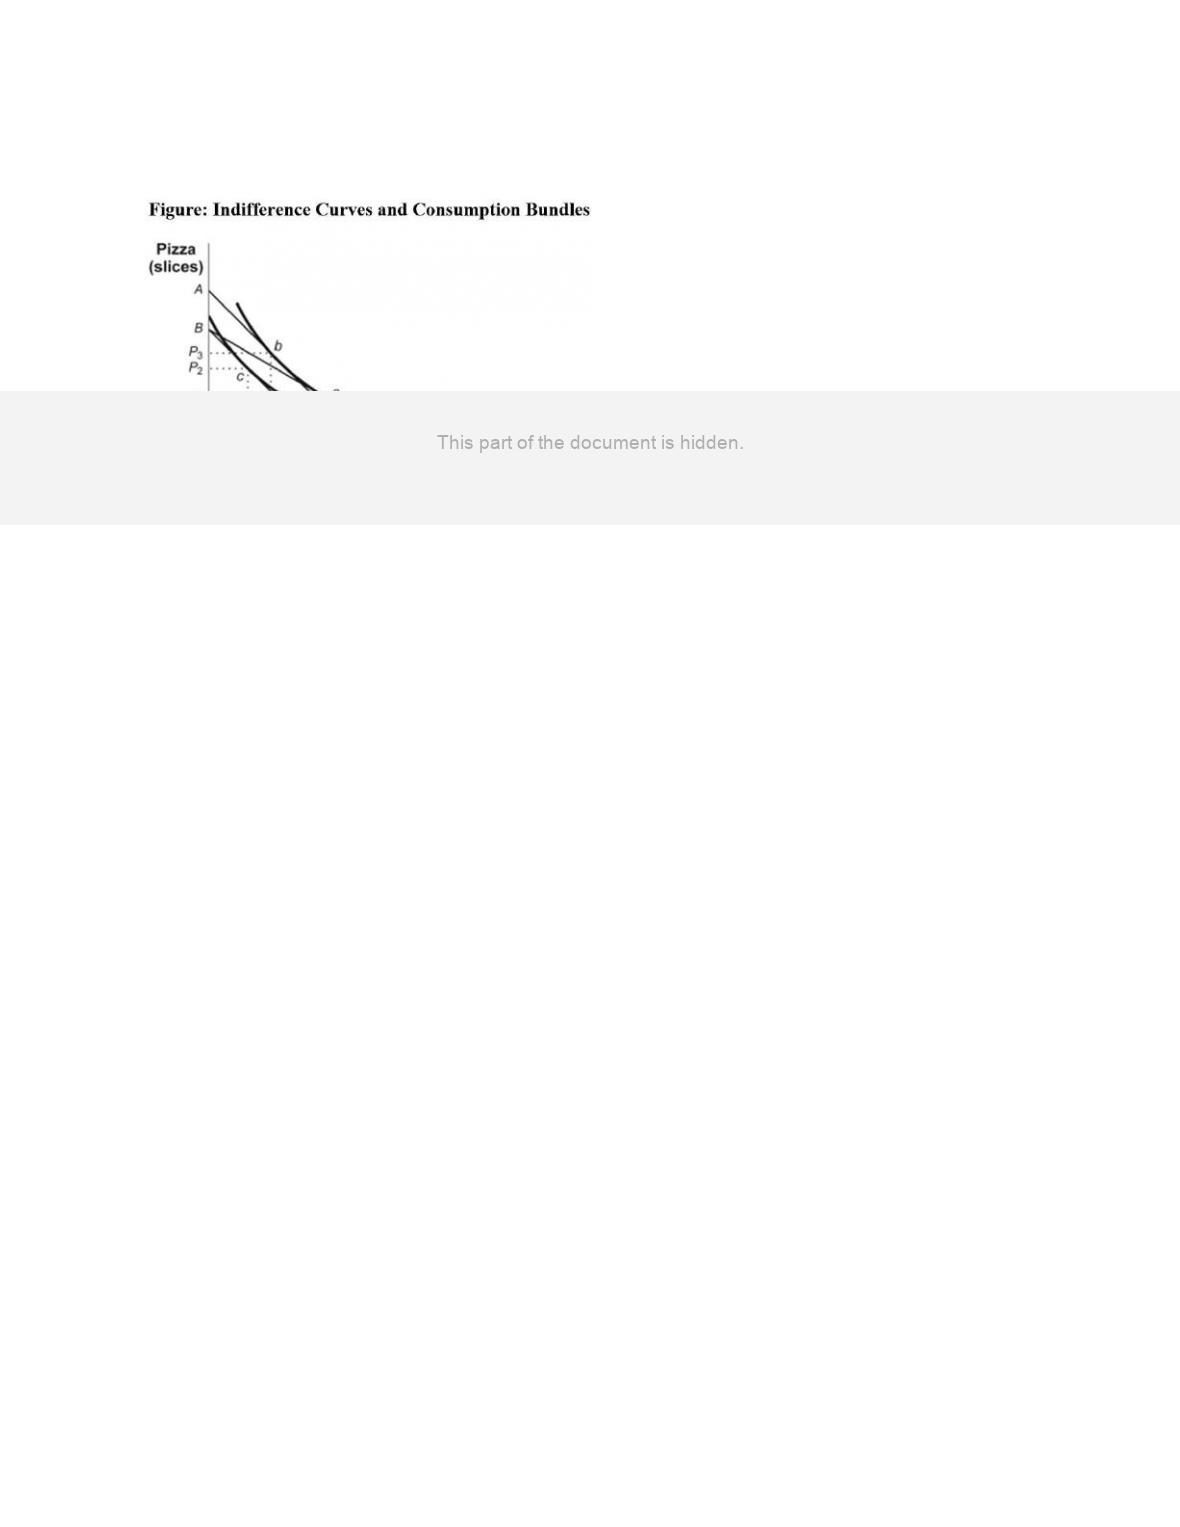
(Figure: Indifference Curves and Consumption Bundles) Use Figure Indifference
Curves and Consumption Bundles. For this consumer pizza is a(n) _____ good and hot
dogs are a(n) _____ good.
A)
normal; inferior
B)
inferior; normal
C)
normal; normal
D)
inferior; inferior
134.
(Figure: Indifference Curves and Consumption Bundles) Use Figure Indifference
Curves and Consumption Bundles. The lines AA and BC are parallel. The optimal
consumption point could shift from b to c as a result of any of the following EXCEPT:
A)
an equal percentage increase in the prices of hot dogs and pizza while income is
unchanged.
B)
a decrease in income with prices constant.
C)
a change in tastes.
D)
an equal percentage increase in the prices of hot dogs and pizza while income is
unchanged or a decrease in income with prices constant.
135.
(Figure: Indifference Curves and Consumption Bundles) Use Figure Indifference
Curves and Consumption Bundles. In the figure, the initial optimum is at a. The price of
hot dogs increases, and the new equilibrium point is c. The change in hot dog
consumption due to the income effect of the price change is:
A)
H3 to H2.
B)
H3 to H1.
C)
H2 to H1.
D)
H1 to H2.
Page 33
136.
(Figure: Indifference Curves and Consumption Bundles) Use Figure Indifference
Curves and Consumption Bundles. In the figure, the initial optimum is at a. The price of
hot dogs now increases. The change in hot dog consumption due to the substitution
effect is:
A)
H3 to H2.
B)
H3 to H1.
C)
H2 to H1.
D)
H1 to H2.
Use the following to answer questions 137-140:
Page 34
137.
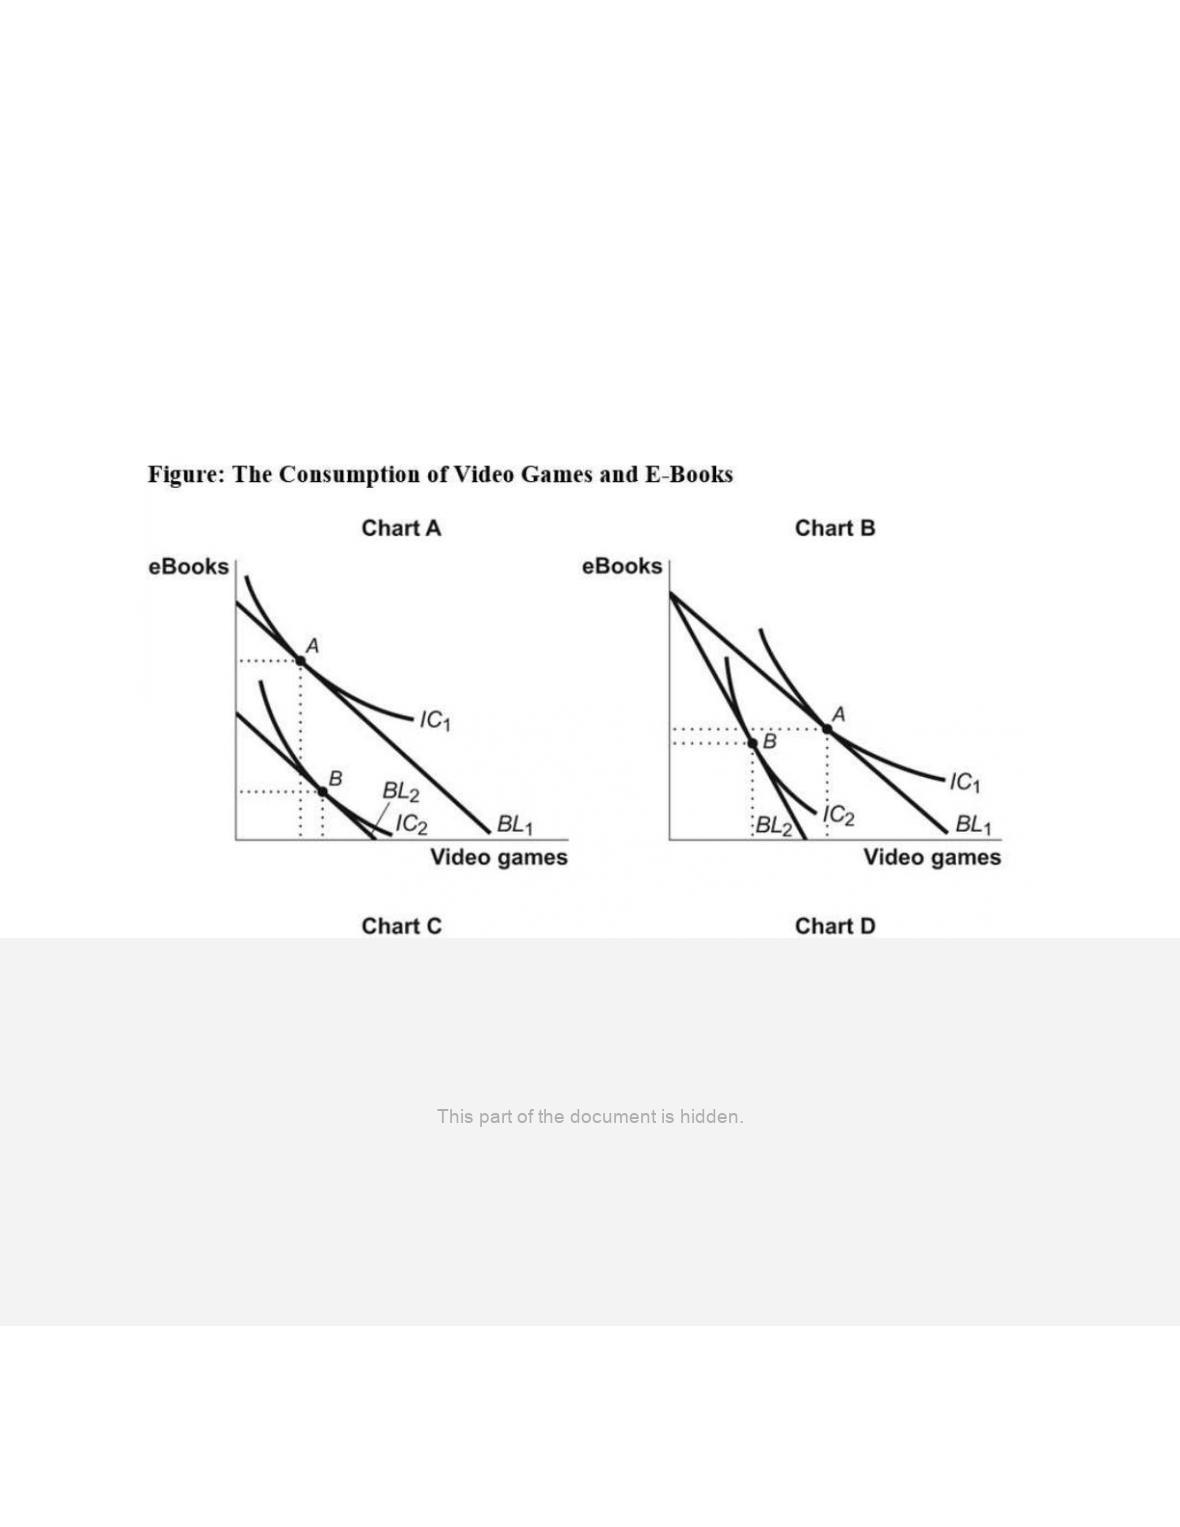
(Figure: The Consumption of Video Games and E-Books) Use Figure The Consumption
of Video Games and E-Books. Which chart shows the effect of a decrease in income
when both video games and e-books are normal goods?
A)
A
B)
B
C)
C
D)
D
138.
(Figure: The Consumption of Video Games and E-Books) Use Figure The Consumption
of Video Games and E-Books. Which chart shows the effects of a decrease in income
when video games are an inferior good and e-books are a normal good?
A)
A
B)
B
C)
C
D)
D
139.
(Figure: The Consumption of Video Games and E-Books) Use Figure The Consumption
of Video Games and E-Books. Which chart shows the effects of an increase in the price
of video games when video games and e-books are substitutes but not perfect
substitutes?
A)
A
B)
B
C)
C
D)
D
140.
(Figure: The Consumption of Video Games and E-Books) Use Figure The Consumption
of Video Games and E-Books. Which chart in the figure shows the effects of an increase
in the price of video games when video games and e-books are complements but not
perfect complements?
A)
A
B)
B
C)
C
D)
D
Page 35
Use the following to answer questions 141-148:
141.
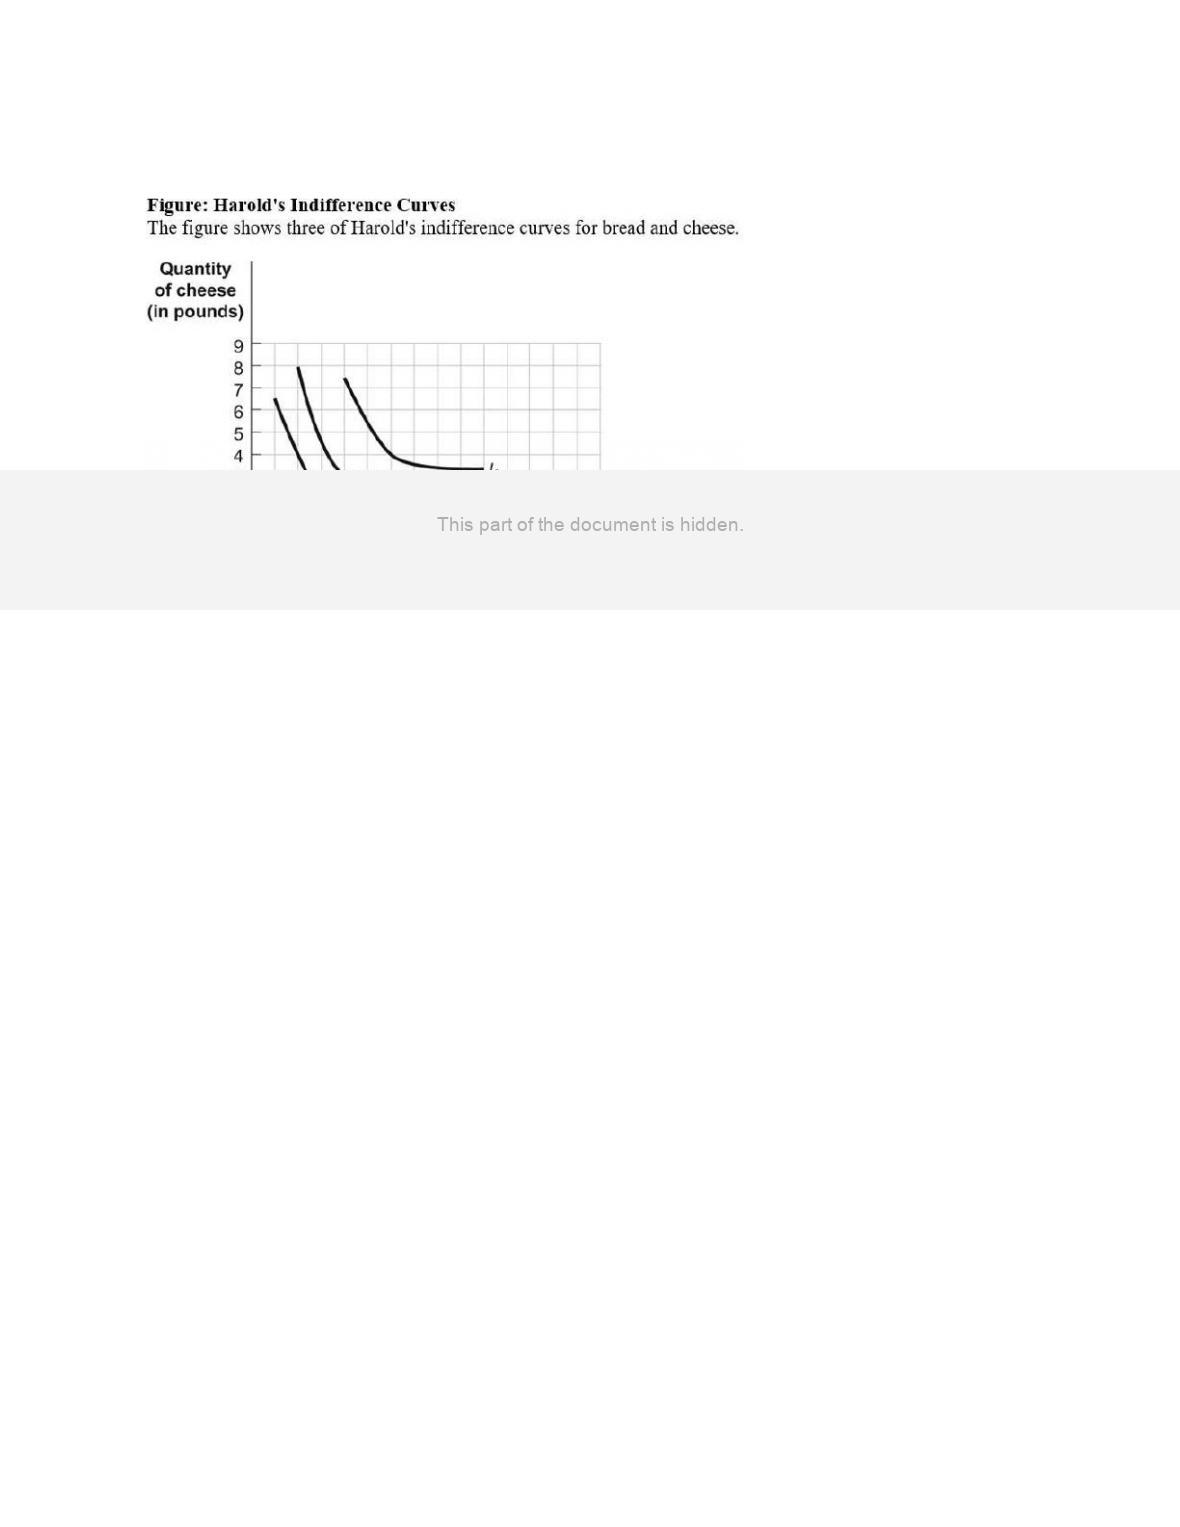
(Figure: Harold’s Indifference Curves) Use Figure Harold’s Indifference Curves. If the
price of bread is $1 per loaf, the price of cheese is $2 per pound, and Harold has $10 to
spend on bread and cheese, Harold’s optimal consumption bundle is _____ loaves of
bread and _____ pounds of cheese.
A)
6; 4
B)
4; 3
C)
3; 2
D)
2; 8
142.
(Figure: Harold’s Indifference Curves) Use Figure Harold’s Indifference Curves. If the
price of bread is $1 per loaf, the price of cheese is $2 per pound, and Harold has $14 to
spend on bread and cheese, Harold’s optimal consumption bundle is _____ loaves of
bread and _____ pounds of cheese.
A)
6; 4
B)
4; 3
C)
3; 2
D)
2; 8
Page 36
143.
(Figure: Harold’s Indifference Curves) Use Figure Harold’s Indifference Curves. Given
that the price of bread is $1 per loaf and the price of cheese is $2 per pound, as Harold’s
income increases from $10 to $14, we can determine that bread is a(n) _____ good and
cheese is a(n) _____ good.
A)
inferior; inferior
B)
normal; inferior
C)
inferior; normal
D)
normal; normal
144.
(Figure: Harold’s Indifference Curves) Use Figure Harold’s Indifference Curves. If the
price of bread is $2 per loaf, the price of cheese is $4 per pound, and Harold has $28 to
spend on bread and cheese, Harold’s optimal consumption bundle is _____ loaves of
bread and _____ pounds of cheese.
A)
6; 4
B)
4; 3
C)
3; 2
D)
2; 8
145.
(Figure: Harold’s Indifference Curves) Use Figure Harold’s Indifference Curves. If the
price of bread is $0.50 per loaf, the price of cheese is $1 per pound, and Harold has $7
to spend on bread and cheese, Harold’s optimal consumption bundle is _____ loaves of
bread and _____ pounds of cheese.
A)
6; 4
B)
4; 3
C)
3; 2
D)
2; 8
146.
(Figure: Harold’s Indifference Curves) Use Figure Harold’s Indifference Curves. If the
price of bread is $2 per loaf, the price of cheese is $2 per pound, and Harold has $10 to
spend on bread and cheese, Harold’s optimal consumption bundle is _____ loaves of
bread and _____ pounds of cheese.
A)
6; 4
B)
4; 3
C)
3; 2
D)
2; 8
Page 37
147.
(Figure: Harold’s Indifference Curves) Use Figure Harold’s Indifference Curves. The
price of cheese is $2 per pound and Harold has $10 to spend on bread and cheese. As
the price of bread rises from $1 to $2 per loaf, his consumption of bread: change?
A)
increases from 2 to 3 loaves.
B)
decreases from 3 to 2 loaves.
C)
increases from 3 to 4 loaves.
D)
decreases from 4 to 3 loaves.
148.
(Figure: Harold’s Indifference Curves) Use Figure Harold’s Indifference Curves. If the
price of cheese is $2 per pound and Harold has $10 to spend on bread and cheese,
Harold _____ his consumption of cheese as the price of bread rises from $1 per loaf to
$2 per loaf, indicating that bread and cheese are _____.
A)
increases; substitutes
B)
increases; complements
C)
decreases; substitutes
D)
decreases; complements
Use the following to answer questions 149-154:
149.
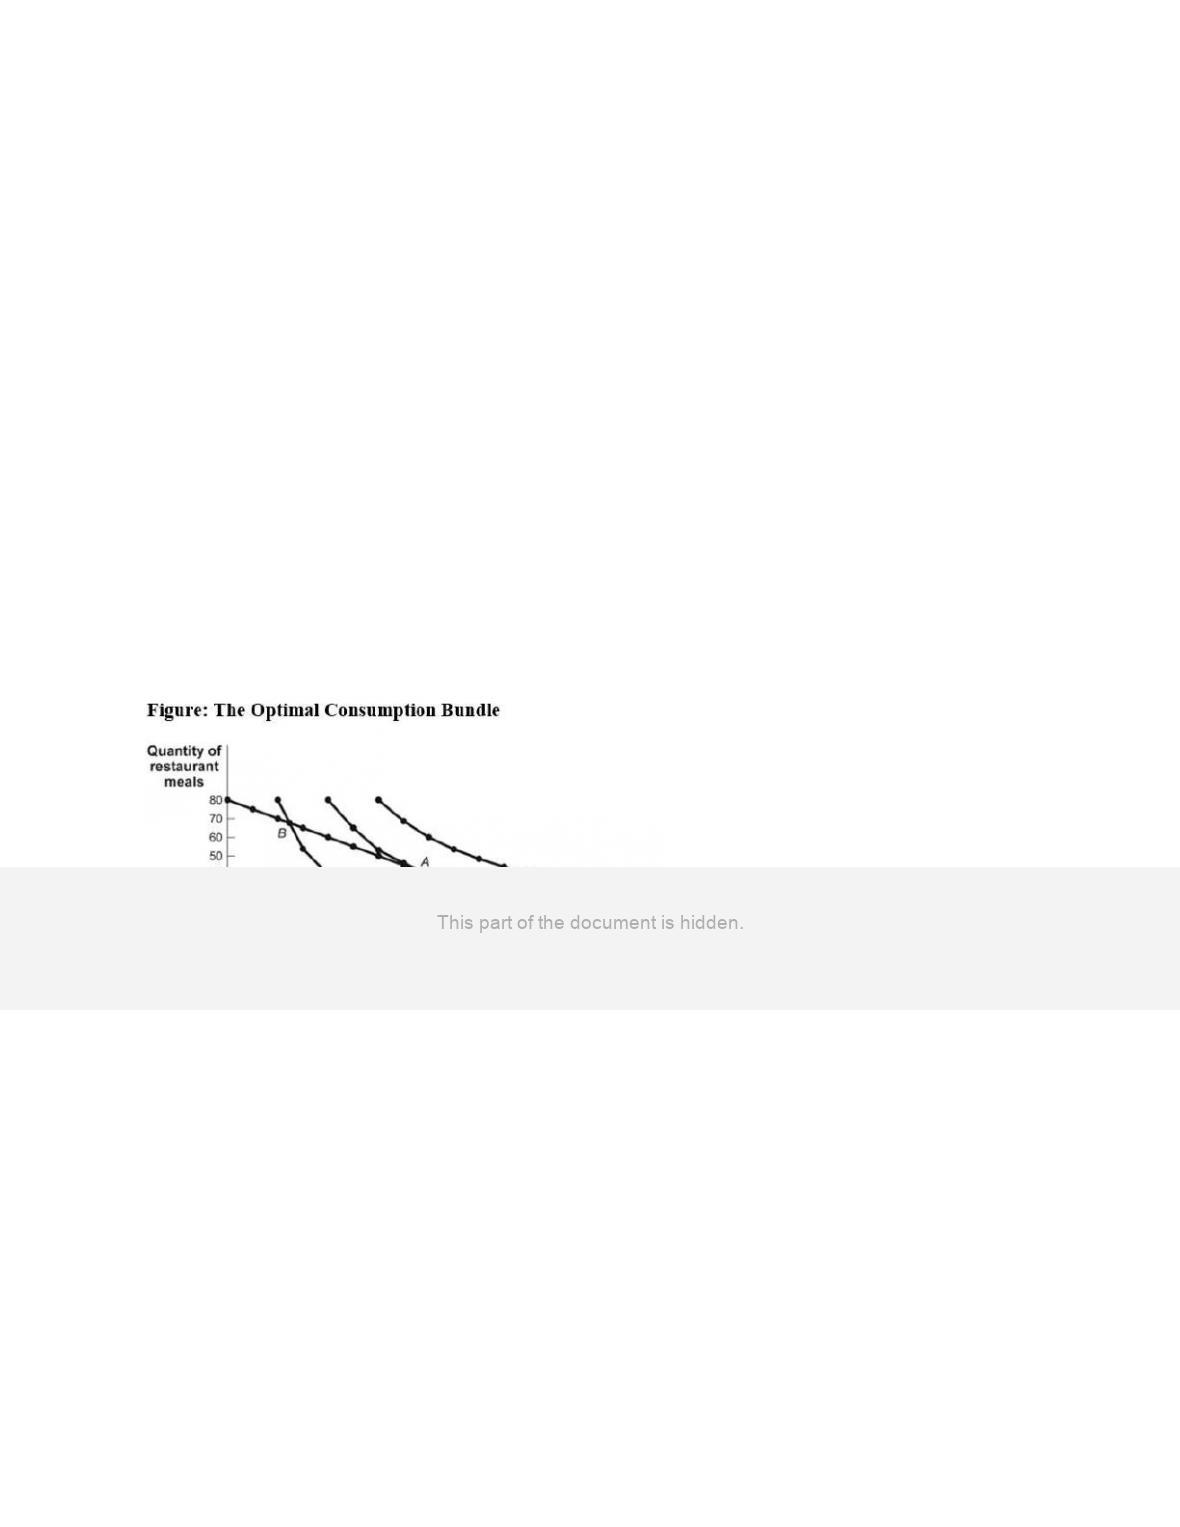
(Figure: The Optimal Consumption Bundle) Use Figure The Optimal Consumption
Bundle. If the price of restaurant meals _____, then the optimal consumption bundle
will be on _____ indifference curve.
A)
increases; a higher
B)
decreases; a higher
C)
decreases; a lower
D)
increases; the same
Page 38
150.
(Figure: The Optimal Consumption Bundle) Use Figure The Optimal Consumption
Bundle. Which of the following could lead to an optimal consumption bundle on
indifference curve I3?
A)
an increase in income
B)
an increase in the price of restaurant meals
C)
an increase in the price of rooms
D)
a decrease in income
151.
(Figure: The Optimal Consumption Bundle) Use Figure The Optimal Consumption
Bundle. Which of the following could lead to an optimal consumption bundle on
indifference curve I3?
A)
a decrease in income
B)
a decrease in the price of restaurant meals
C)
an increase in the price of rooms
D)
an increase in the price of restaurant meals
152.
(Figure: The Optimal Consumption Bundle) Use Figure The Optimal Consumption
Bundle. Which of the following could lead to an optimal consumption bundle on
indifference curve I3?
A)
a decrease in income
B)
an increase in the price of restaurant meals
C)
a decrease in the price of rooms
D)
an increase in the price of rooms
153.
(Figure: The Optimal Consumption Bundle) Use Figure The Optimal Consumption
Bundle. Which of the following could lead to an optimal consumption bundle on
indifference curve I1?
A)
an increase in income
B)
a decrease in the price of restaurant meals
C)
a decrease in the price of rooms
D)
a decrease in income
154.
(Figure: The Optimal Consumption Bundle) Use Figure The Optimal Consumption
Bundle. Which of the following could lead to an optimal consumption bundle on
indifference curve I1?
A)
an increase in income
B)
an increase in the price of restaurant meals
C)
a decrease in the price of rooms
D)
a decrease in the price of restaurant meals
Page 39
Use the following to answer questions 155-157:
155.
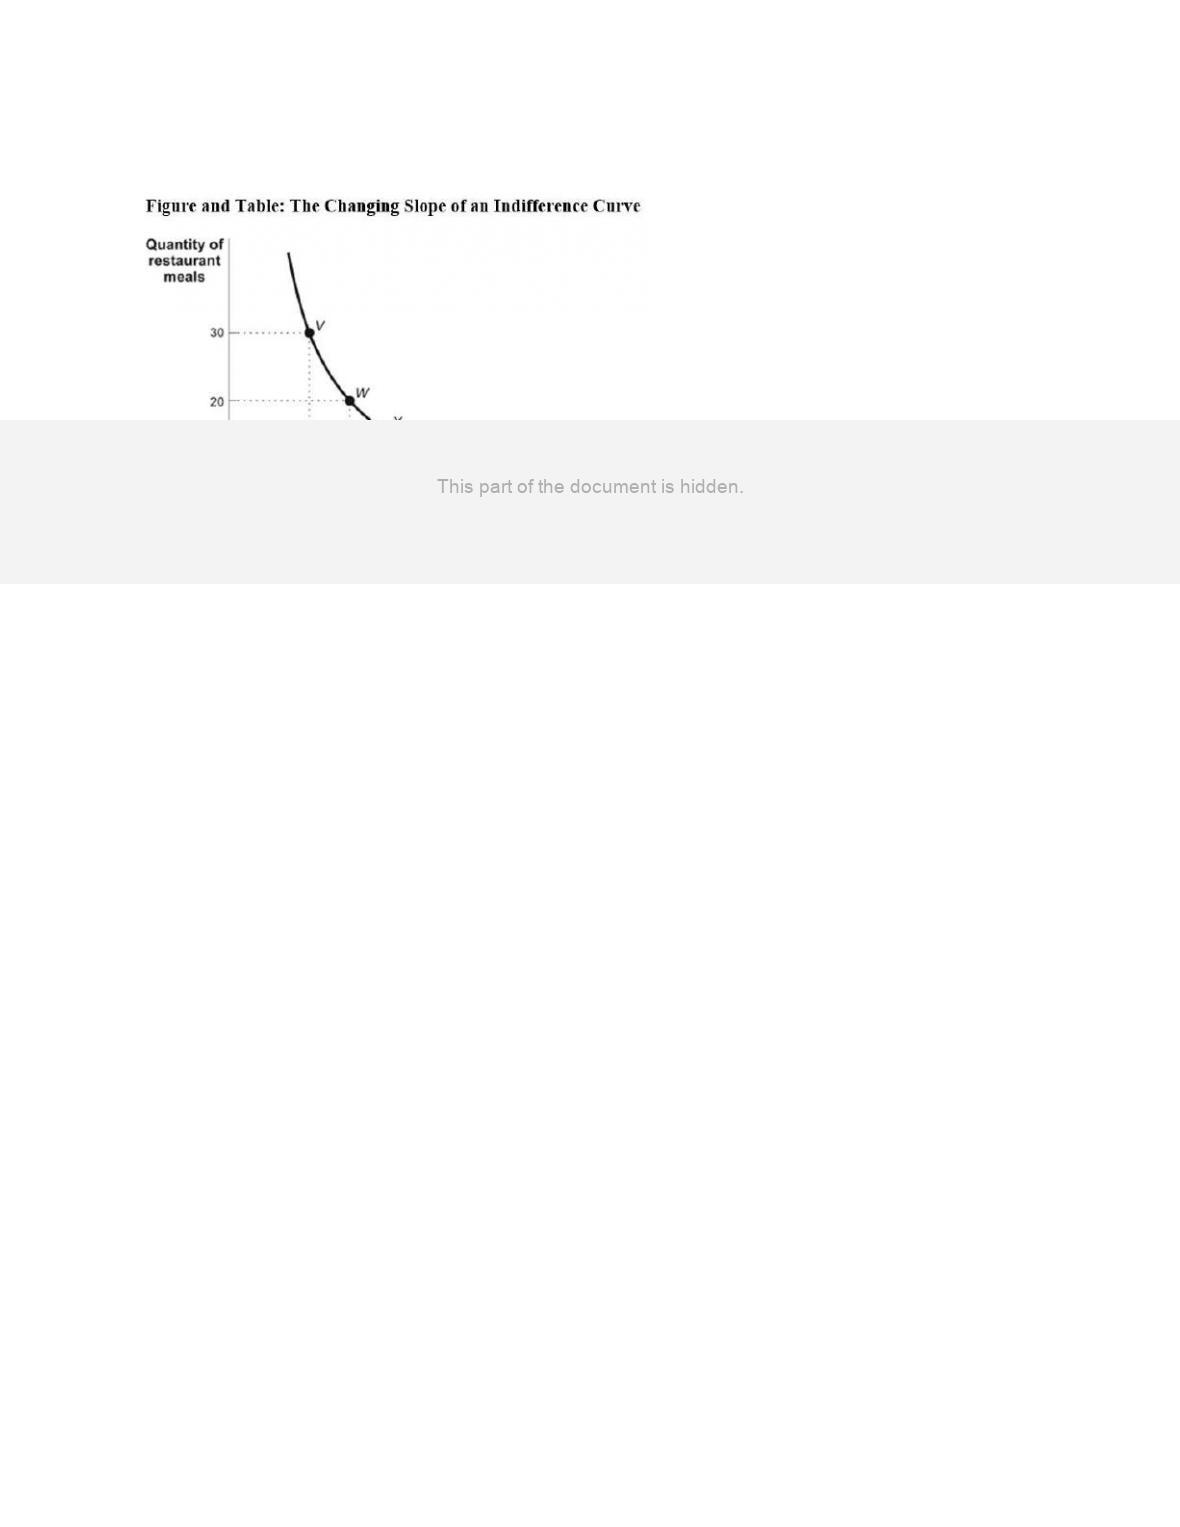
(Figure and Table: The Changing Slope of an Indifference Curve) Use Figure and table
The Changing Slope of an Indifference Curve. The slope between points W and X is:
A)
5.
B)
–5.
C)
0.2.
D)
–0.2.
156.
(Figure and Table: The Changing Slope of an Indifference Curve) Use Figure and table
The Changing Slope of an Indifference Curve. The slope between points X and Y is:
A)
3.
B)
–5.
C)
–0.33.
D)
–3.
157.
(Figure and Table: The Changing Slope of an Indifference Curve) Use Figure and table
The Changing Slope of an Indifference Curve. Which of the following statements is
TRUE?
A)
Combination V is preferred to combination X.
B)
Combination W is preferred to combination Z.
C)
Combination X is preferred to combination W.
D)
The consumer is indifferent between V and W.
Page 40
Use the following to answer questions 158-165:
158.
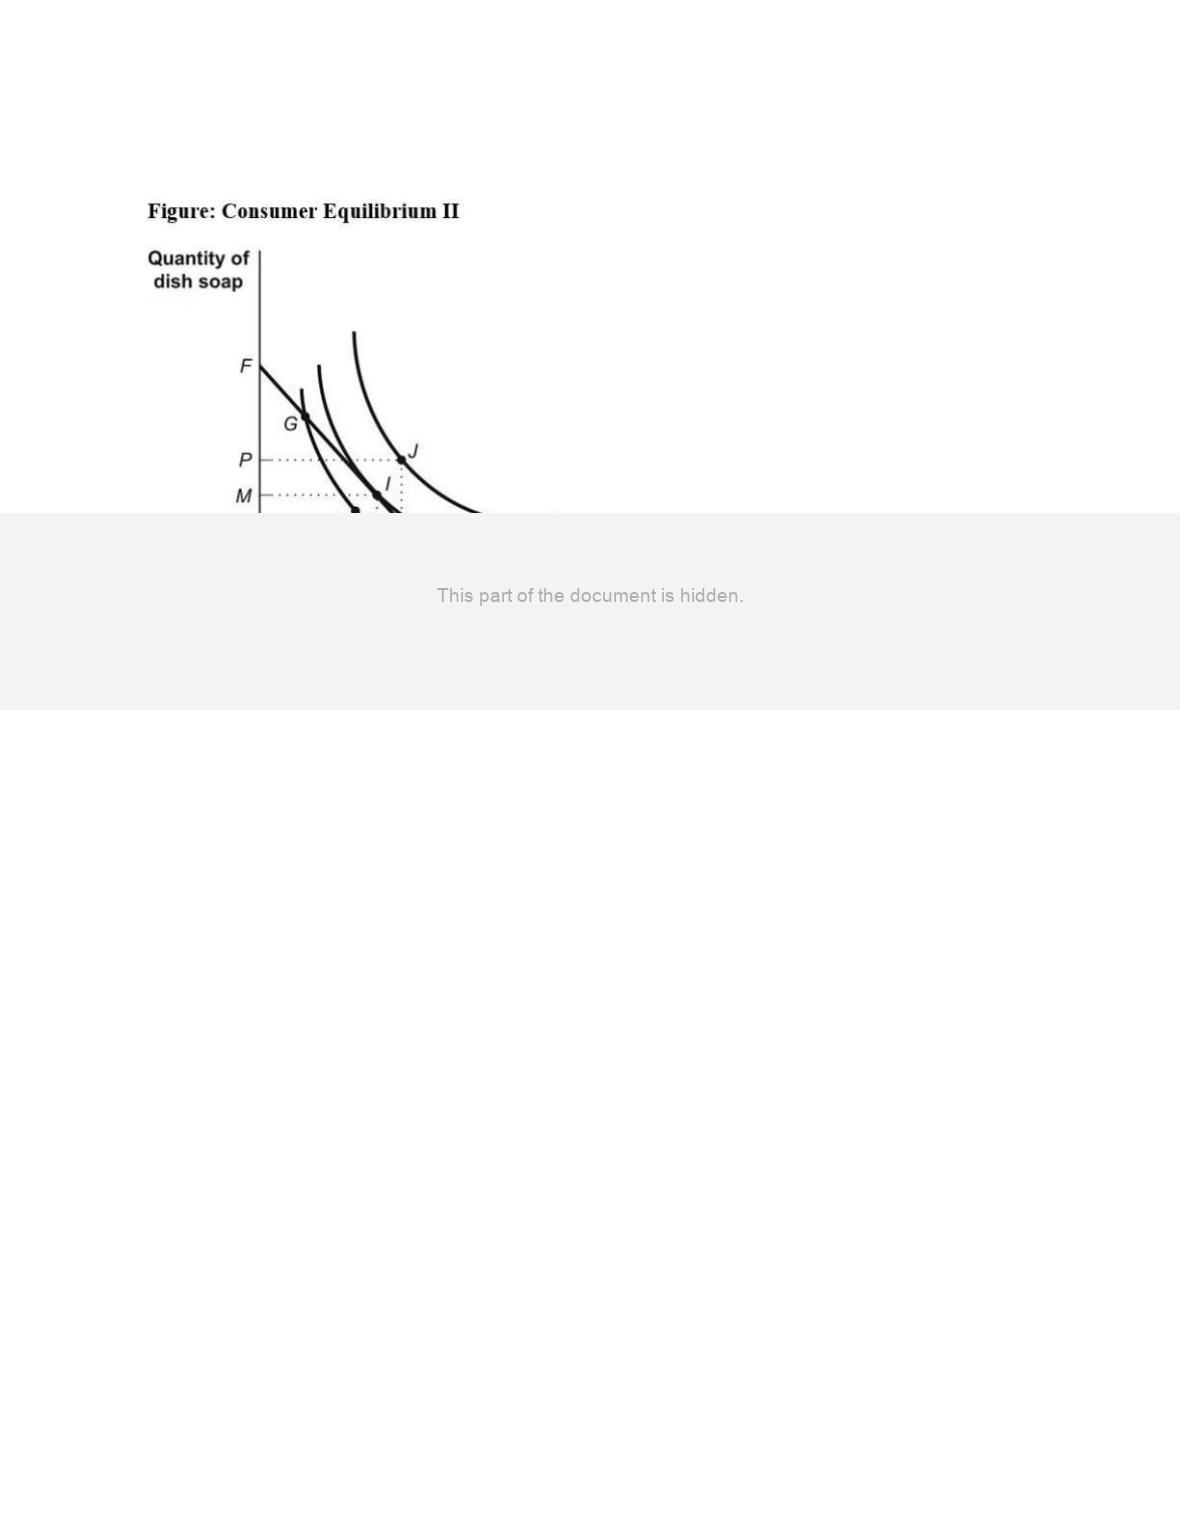
(Figure: Consumer Equilibrium II) Use Figure Consumer Equilibrium II. The
HIGHEST level of total utility is associated with point _____ on indifference curve
_____.
A)
H; C
B)
I; B
C)
G; B
D)
J; A
159.
(Figure: Consumer Equilibrium II) Use Figure Consumer Equilibrium II. The LOWEST
level of total utility shown in the figure is associated with point _____ on curve _____.
A)
H; A
B)
I; B
C)
G; C
D)
J; A
160.
(Figure: Consumer Equilibrium II) Use Figure Consumer Equilibrium II. A level of total
utility NOT attainable is at point:
A)
G.
B)
K.
C)
I.
D)
J.