Page 1
Name: __________________________ Date: _____________
1.
An indifference curve is a line showing all of the consumption bundles that:
A)
an individual can purchase with a given income.
B)
yield the same total utility for an individual.
C)
yield the same marginal utility.
D)
have the same marginal rate of substitution.
2.
When Laurie asks Matt if he wants a large popcorn and small soda or a large soda and
small popcorn, Matt says, “Oh, I’m indifferent.” This means Matt:
A)
doesn’t want popcorn and soda.
B)
thinks both bundles give him the same utility.
C)
thinks neither bundle gives him utility.
D)
thinks the utility he gained from popcorn and soda exactly equals their cost.
3.
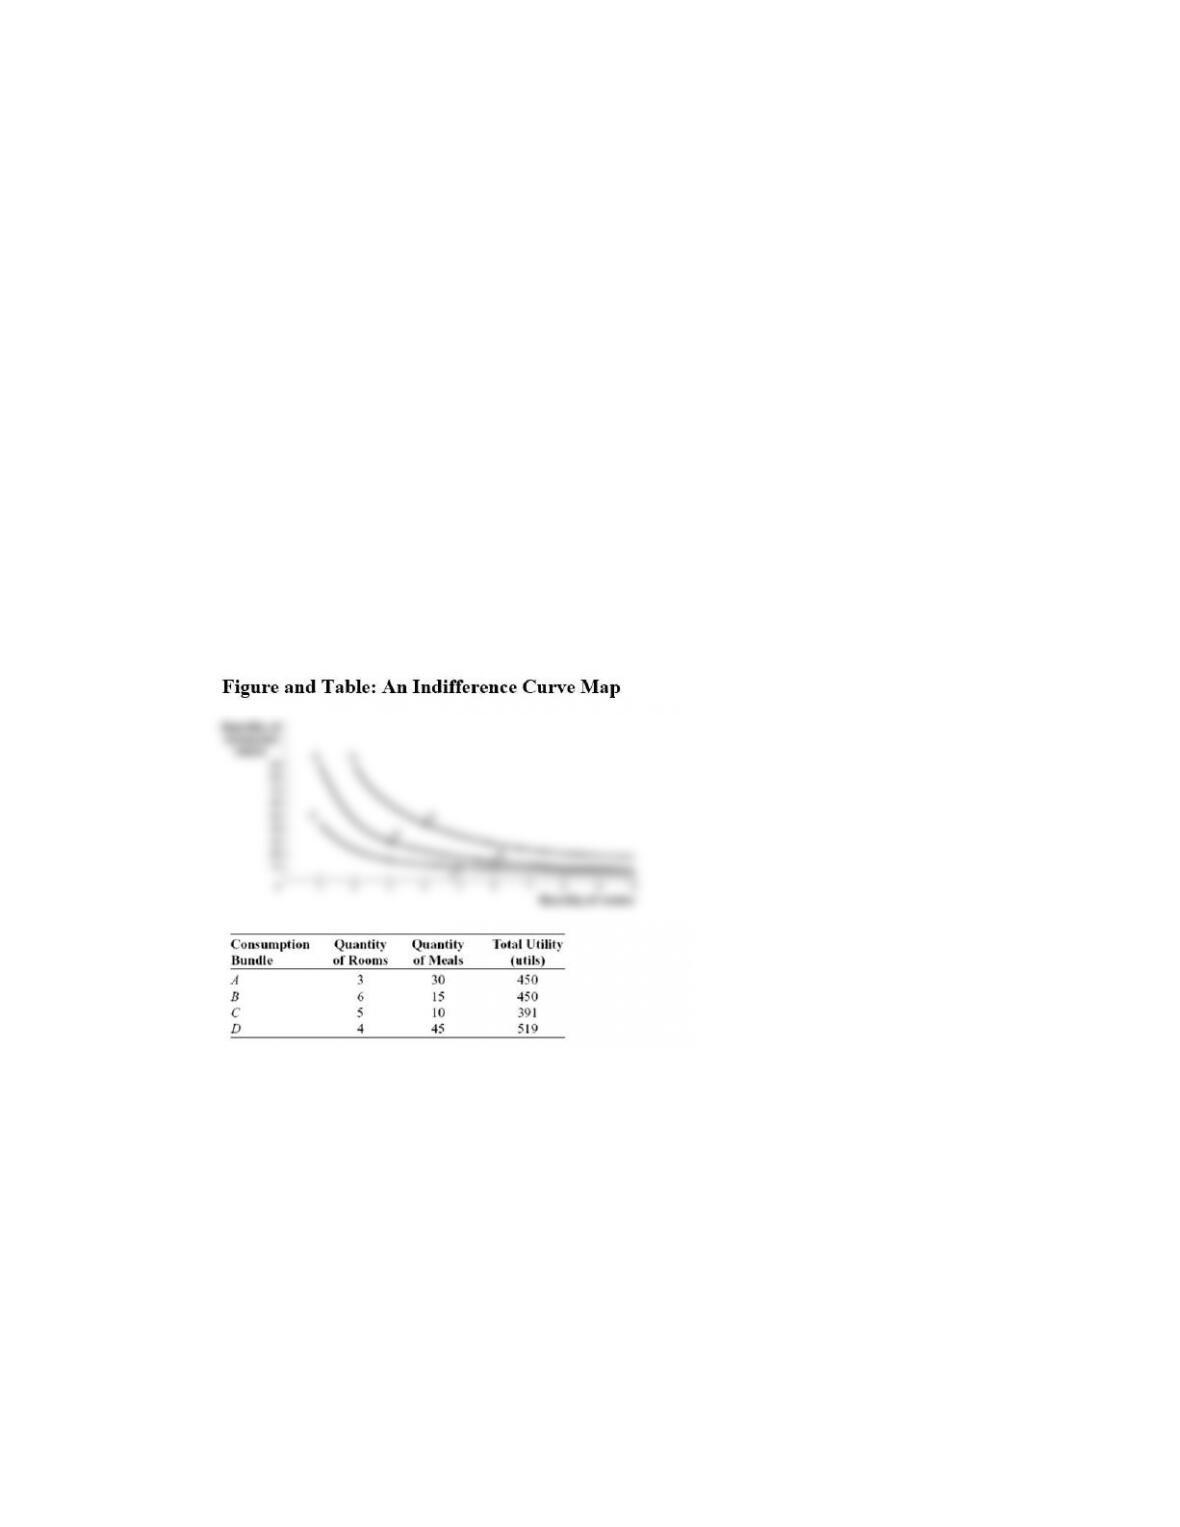
(Figure and Table: Indifference Curve Map) Use Figure and Table An Indifference
Curve Map. Combination _____ is preferred to combination _____.
A)
A; B
B)
B; D
C)
C; A
D)
B; C
Page 2
4.
Combinations of two goods that yield equal levels of utility are shown on a(n) _____
curve.
A)
indifference
B)
budget
C)
marginal utility
D)
utility-maximizing
5.
The slope of a(n) _____ curve shows the rate at which two goods can be exchanged
_____ the consumer’s _____.
A)
marginal utility; by increasing; marginal utility
B)
indifference; without affecting; total utility
C)
utility; without affecting; budget
D)
indifference; without affecting; budget
6.
An indifference curve shows combinations of two goods that yield:
A)
equal prices.
B)
equal money income.
C)
equal satisfaction.
D)
increasing prices.
7.
If a consumer moves upward along an indifference curve, his or her total utility:
A)
remains constant.
B)
first decreases, then increases.
C)
increases.
D)
first increases, then decreases.
8.
If two combinations of two goods yield the same level of satisfaction, then they are on:
A)
the same price line.
B)
the same budget constraint.
C)
the same indifference curve.
D)
different indifference curves.
9.
Higher indifference curves represent:
A)
less utility than lower indifference curves.
B)
more utility than lower indifference curves.
C)
the same level of utility as lower indifference curves.
D)
unknown levels of utility compared to lower indifference curves.
Page 3
10.
In terms of indifference curves, an increase in total utility is represented by a _____
indifference curve.
A)
shift to the right to a higher
B)
shift to the left to a lower
C)
movement upward along an
D)
movement downward along an
11.
If combination A lies on a higher indifference curve than combination B and
combination B lies on a higher indifference curve than combination C, it must be that
the total utility associated with combination A is _____ the total utility associated with
combination C.
A)
less than
B)
more than
C)
equal to
D)
more than or equal to
12.
A(n) _____ is a curve that shows all of the consumption bundles that yield the same
level of total utility for an individual.
A)
budget line
B)
indifference curve
C)
utility function
D)
marginal rate of substitution
Use the following to answer questions 13-14:
13.
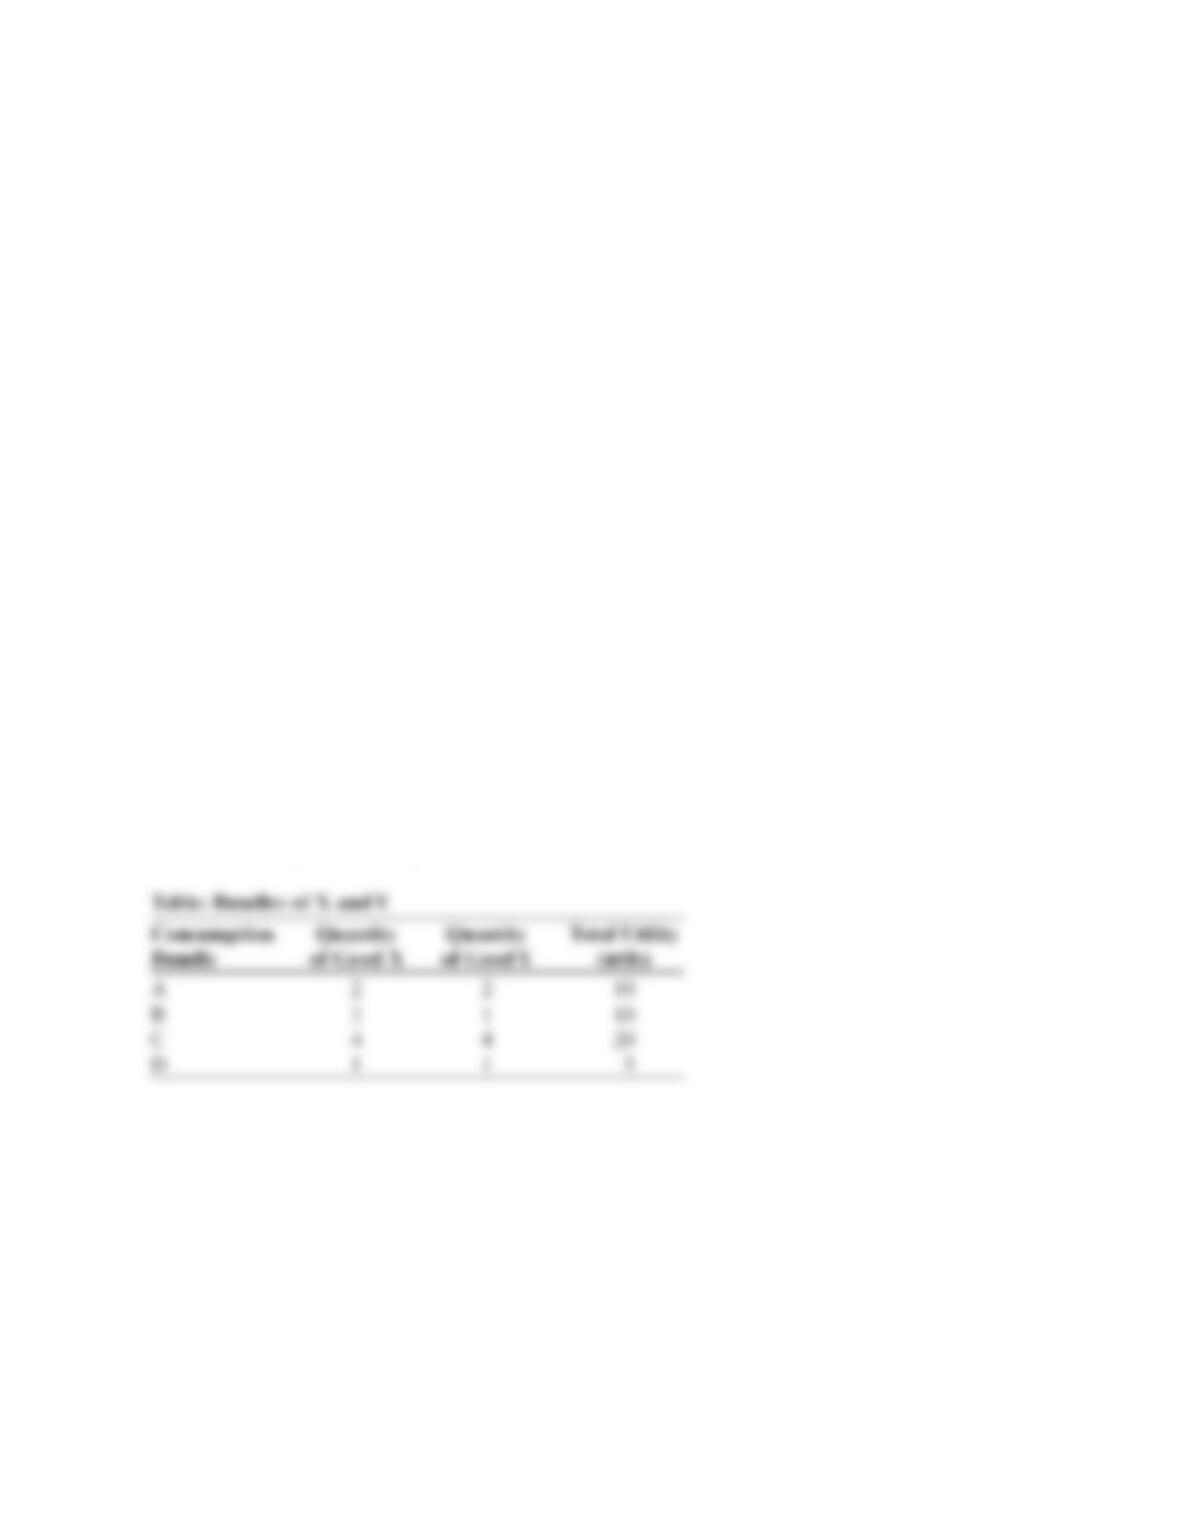
(Table: Bundles of X and Y) Use Table Bundles of X and Y. Bundle(s):
A)
A and B are on the same indifference curve.
B)
A and C are on the same indifference curve.
C)
D is on the highest indifference curve.
D)
C is on the highest indifference curve, and bundles A and B are on the lowest
indifference curve.
Page 4
14.
(Table: Bundles of X and Y) Use Table Bundles of X and Y. According to the table:
A)
bundle D is preferred to bundles A and B.
B)
the consumer is indifferent among bundles A, B, and C.
C)
bundles C and D are both preferred to bundles A and B.
D)
bundle C is preferred to all other bundles.
15.
Consumption bundles that yield equal levels of total utility are shown on the same:
A)
budget line.
B)
marginal utility curve.
C)
indifference curve.
D)
utility maximizing curve.
16.
If a consumer moves downward along an indifference curve, his or her total utility:
A)
remains constant.
B)
first decreases, then increases.
C)
decreases.
D)
first increases, then decreases.
17.
Assume that two combinations of two goods yield the same level of satisfaction. We can
conclude that these combinations are always on:
A)
the same price line.
B)
the same budget constraint.
C)
the same indifference curve.
D)
different indifference curves.
18.
A curve that represents combinations of two goods that yield equal levels of satisfaction
is a(n):
A)
indifference curve.
B)
budget curve.
C)
marginal utility curve.
D)
price–consumption curve.
19.
Higher indifference curves represent _____ lower curves.
A)
less utility than
B)
more utility than
C)
the same utility as
D)
either more or less utility than
Page 5
20.
Higher total utility is represented by _____ indifference curve.
A)
a higher
B)
a lower
C)
movement leftward along an
D)
movement rightward along an
21.
Greater levels of utility are represented by:
A)
indifference curves that are farther from the origin.
B)
indifference curves that are closer to the origin.
C)
moving up to the left on the same indifference curve.
D)
moving down to the right on the same indifference curve.
22.
One point on a standard indifference curve is 8 cookies and 2 brownies; another is 6
cookies and 4 brownies. Which of the following combinations of cookies and brownies
could lie on this indifference curve?
A)
6 cookies and 10 brownies
B)
7 cookies and 6 brownies
C)
4 cookies and 4 brownies
D)
4 cookies and 8 brownies
Use the following to answer questions 23-24:
Page 6
23.
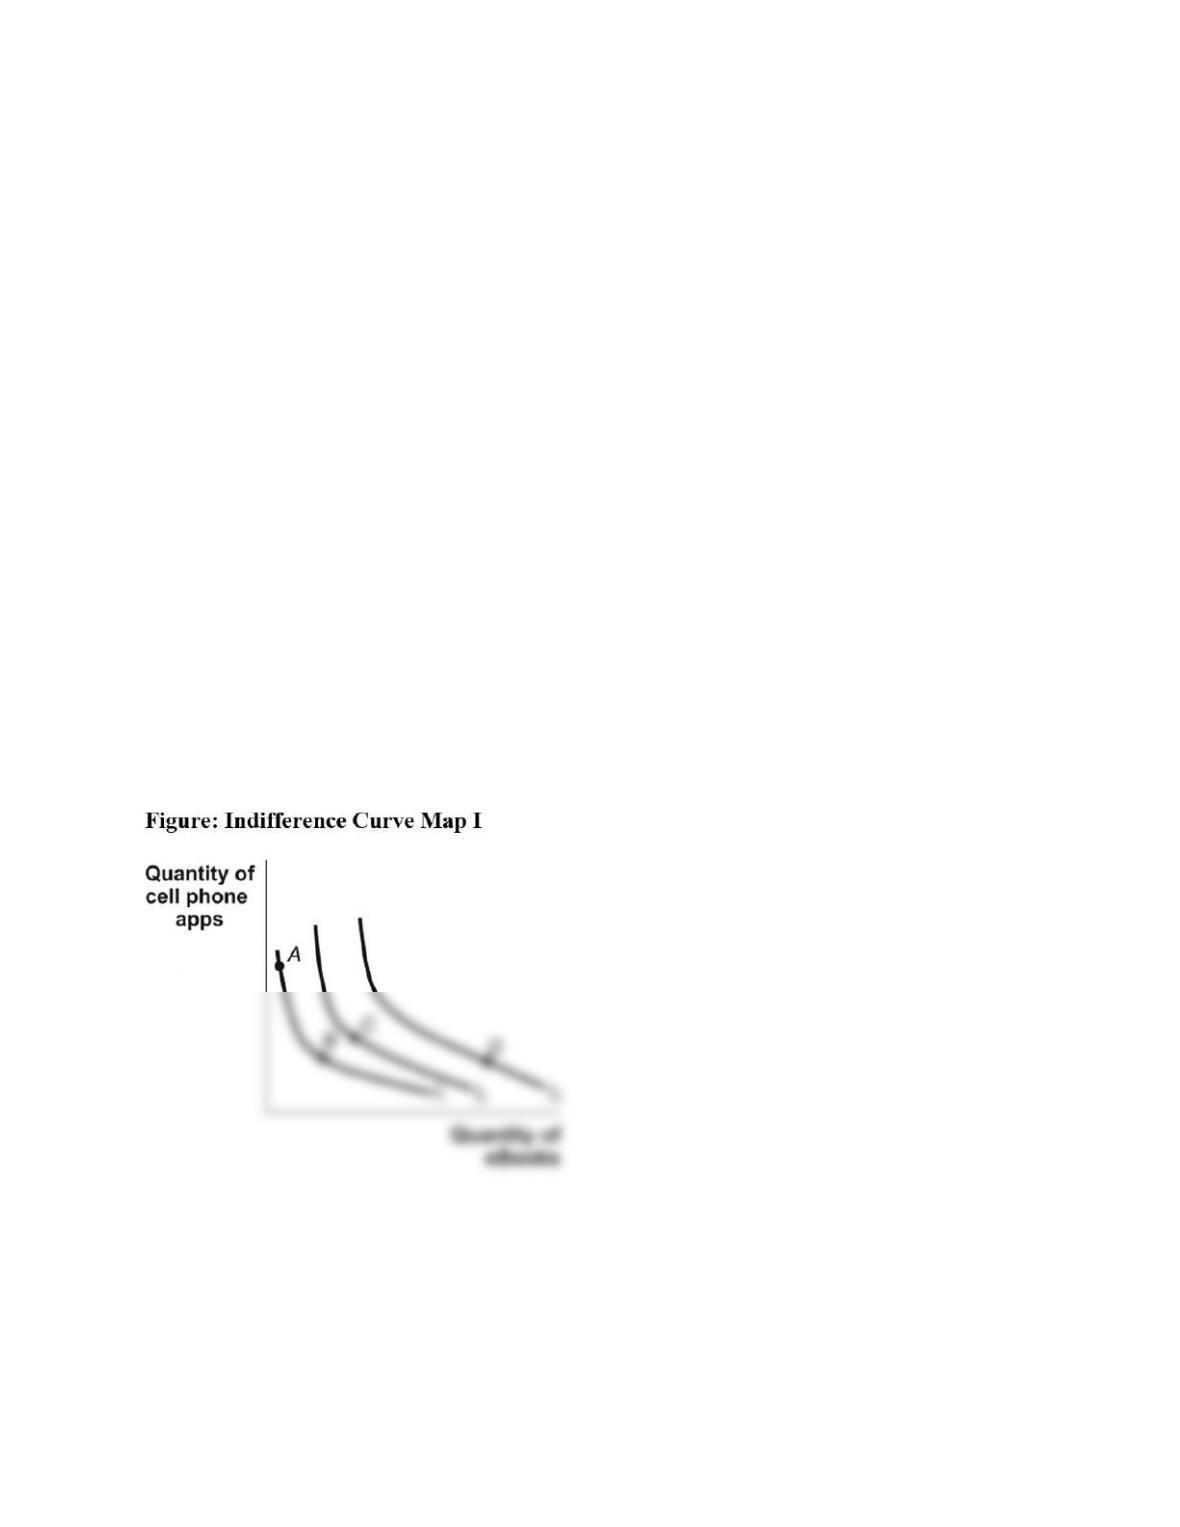
(Figure: Indifference Curve Map I) Use Figure Indifference Curve Map I. It shows that:
A)
bundles B and D provide the same level of utility.
B)
bundle A is preferred to bundle B.
C)
bundle D is preferred to bundle C, which is preferred to bundles A and B.
D)
bundle C provides the highest level of utility.
24.
(Figure: Indifference Curve Map I) Use Figure Indifference Curve Map I. It shows that:
A)
at point A utility is higher than it is at point B.
B)
utility is diminishing on I1, constant on I2, and increasing on I3.
C)
utility is higher at point D than at point A.
D)
the marginal utility of e-books is positive, while the marginal utility of cell phone
apps is negative.
25.
For most goods, indifference curves:
A)
may intersect.
B)
slope upward.
C)
are concave from the origin.
D)
slope downward.
26.
For most goods, as we move down an indifference curve:
A)
the slope gets flatter.
B)
the slope gets steeper.
C)
the slope stays the same.
D)
total utility decreases.
27.
Which of the following is NOT TRUE of indifference curves for ordinary goods?
A)
They never cross.
B)
They slope downward.
C)
They are convex from the origin.
D)
Indifference curves farther from the origin have lower levels of utility.
28.
The slope of a(n) _____ curve shows the rate at which two goods can be exchanged
_____.
A)
indifference; without changing the total budget
B)
utility; without changing the total budget
C)
indifference; without changing total utility
D)
marginal utility; to increase the consumer’s marginal utility
Page 7
29.
An indifference curve typically:
A)
slopes downward.
B)
shows combinations of two goods that yield equal money income.
C)
slopes upward.
D)
is concave.
30.
One point on an indifference curve that displays a diminishing marginal rate of
substitution between apples and oranges is 10 apples and 2 oranges; another is 8 apples
and 4 oranges. Which of the following combinations of apples and oranges could also
lie on this indifference curve?
A)
10 apples and 6 oranges
B)
6 apples and 7 oranges
C)
9 apples and 4 oranges
D)
8 apples and 3 oranges
31.
Manny consumes only bananas and DVDs, and he is on his highest possible indifference
curve. Two bundles on this indifference curve are bundle A (5 bananas and 2 DVDs),
and bundle B (3 bananas and 3 DVDs). Between points A and B, what is Manny’s
marginal rate of substitution of bananas for DVDs?
A)
1
B)
2
C)
0.5
D)
1.33
32.
Max consumes only yogurt and almonds, and he is on his highest possible indifference
curve. Bundle A (4 yogurts and 2 almonds) and bundle B (3 yogurts and 3 almonds) are
on this indifference curve. Between points A and B, what is Max’s marginal rate of
substitution of yogurt for almonds?
A)
1
B)
2
C)
3
D)
1.33
33.
LaToya sees honey and sugar as perfect substitutes. She is always willing to substitute 1
teaspoon of honey for 2 teaspoons of sugar. The marginal rate of substitution of sugar
for honey is:
A)
1.
B)
0.5.
C)
2.
D)
undefined.
Page 8
34.
The principle of _____ marginal rate of substitution states that the more chocolate Susan
consumes in proportion to coffee, the _____ coffee she is willing to substitute for
another piece of chocolate.
A)
diminishing; less
B)
diminishing; more
C)
increasing; less
D)
increasing; more
35.
Indifference curves that are convex to the origin imply:
A)
increasing marginal utility.
B)
diminishing marginal rate of substitution.
C)
that as we move down an indifference curve, the slope gets steeper.
D)
constant prices of goods.
36.
The marginal rate of substitution shows how a consumer can substitute between two
goods to:
A)
maintain the same income.
B)
maintain the same level of total utility.
C)
maintain the same marginal utility.
D)
increase total utility.
37.
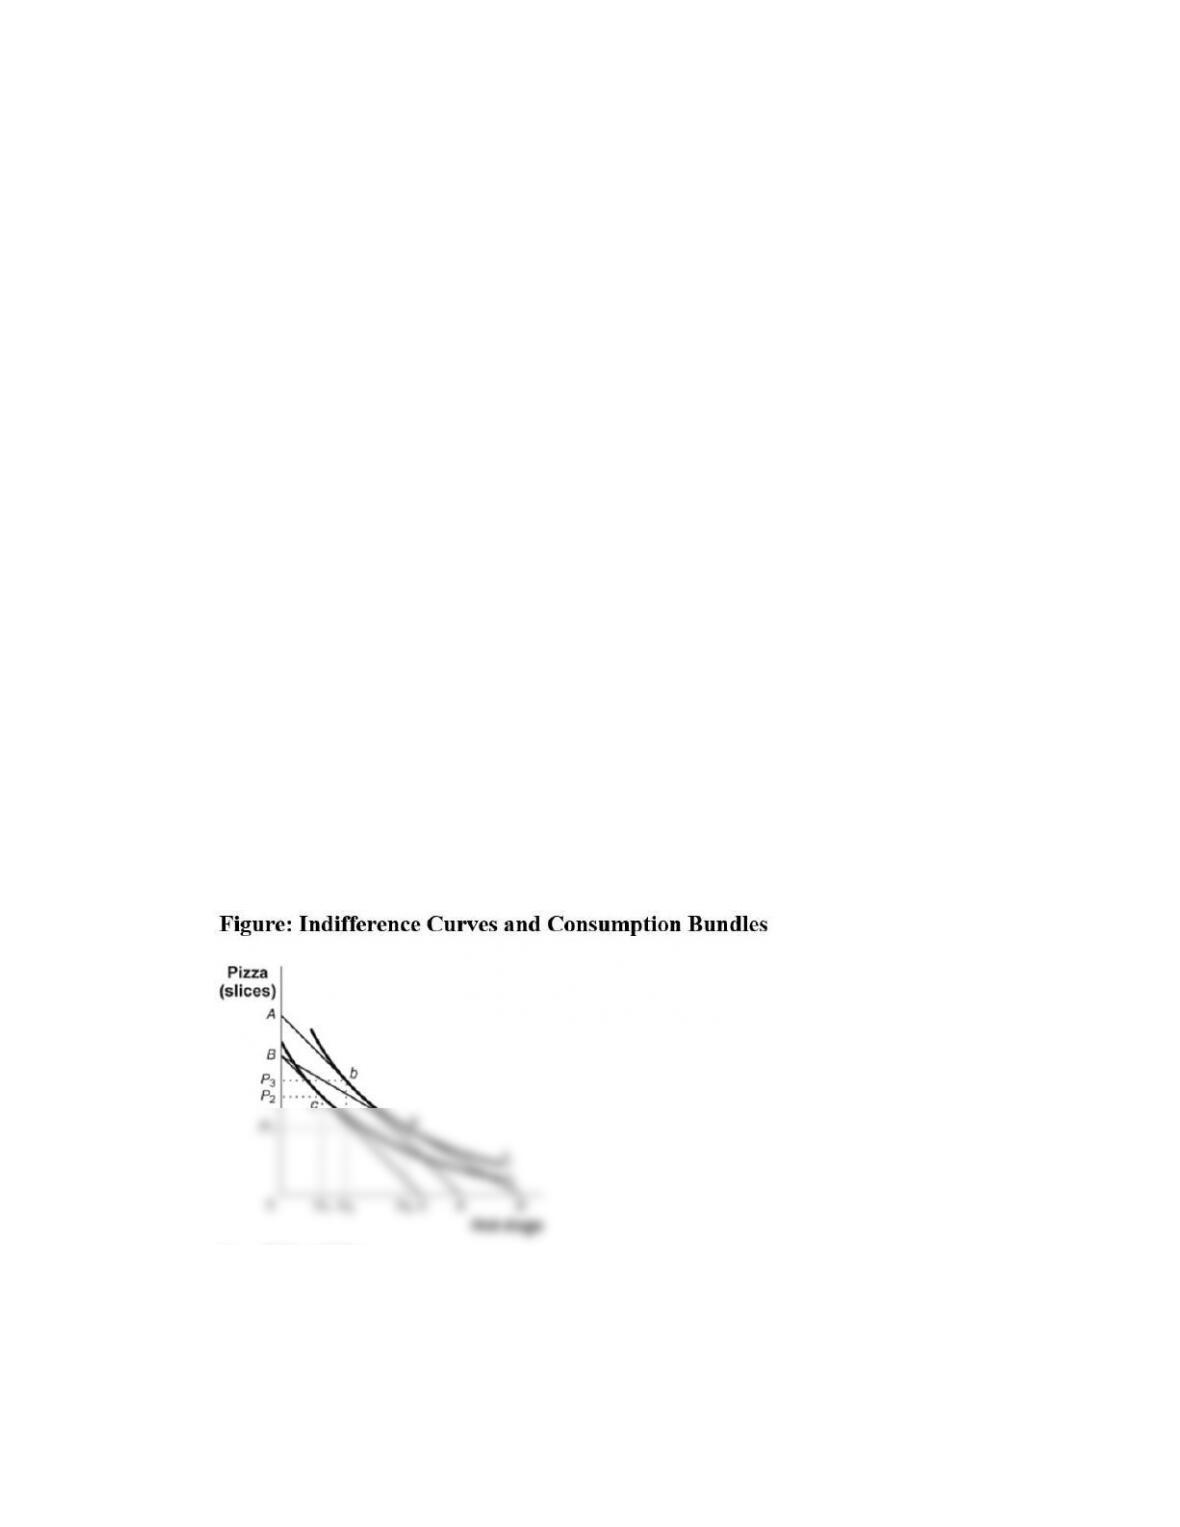
(Figure: Indifference Curves and Consumption Bundles) Let MUP = marginal utility of
pizza, MUH = marginal utility of hot dogs, PP = price of a slice of pizza, and PH = price
of a hot dog. In the figure, the absolute value of the slope of an indifference curve is
equal to:
A)
MUP / MUH.
B)
MUH / MUP.
C)
PH / PP.
D)
PP / PH.
Page 9
38.
Indifference curves that exhibit a diminishing marginal rate of substitution are:
A)
concave to the origin.
B)
upward-sloping over part of their length.
C)
downward-sloping straight lines.
D)
convex to the origin.
39.
If you are willing to give up 10 shirts (on the vertical axis) for 5 pairs of pants (on the
horizontal axis), and your level of satisfaction is unchanged, the marginal rate of
substitution of pants for shirts is:
A)
0.5.
B)
2.
C)
5.
D)
10.
40.
As a consumer moves upward along an indifference curve, giving up some of X (on the
horizontal axis) to get more of Y (on the vertical axis), his or her marginal rate of
substitution of X for Y:
A)
becomes infinite.
B)
goes from negative to positive.
C)
increases.
D)
decreases.
41.
If you are willing to give up 5 units of good Y (on the vertical axis) for 5 units of good X
(on the horizontal axis) and your level of satisfaction is unchanged, the marginal rate of
substitution is:
A)
0.5.
B)
1.
C)
2.
D)
5.
42.
The marginal rate of substitution assumes that:
A)
prices remain unchanged.
B)
money income remains unchanged.
C)
total utility remains unchanged.
D)
the quantities of both goods remain unchanged.
Page 10
43.
The maximum amount of one good a consumer would be willing to give up to obtain an
additional unit of another is called the:
A)
marginal rate of substitution.
B)
marginal rate of utility exchange.
C)
average rate of substitution.
D)
marginal rate of exchange.
44.
Ersida purchases both baby food (F) and cloth diapers (C). The price of a jar of baby
food is PF and the price of a box of cloth diapers is PC. Assume that the quantity of baby
food is on the horizontal axis and the quantity of cloth diapers is on the vertical axis. At
any point on an indifference curve, the marginal rate of substitution of food for cloth
diapers can be represented by:
A)
MUF / MUC.
B)
MUF × PF.
C)
MUF / PF.
D)
(MUF / MUC) × (PF / PC).
Use the following to answer questions 45-46:
45.
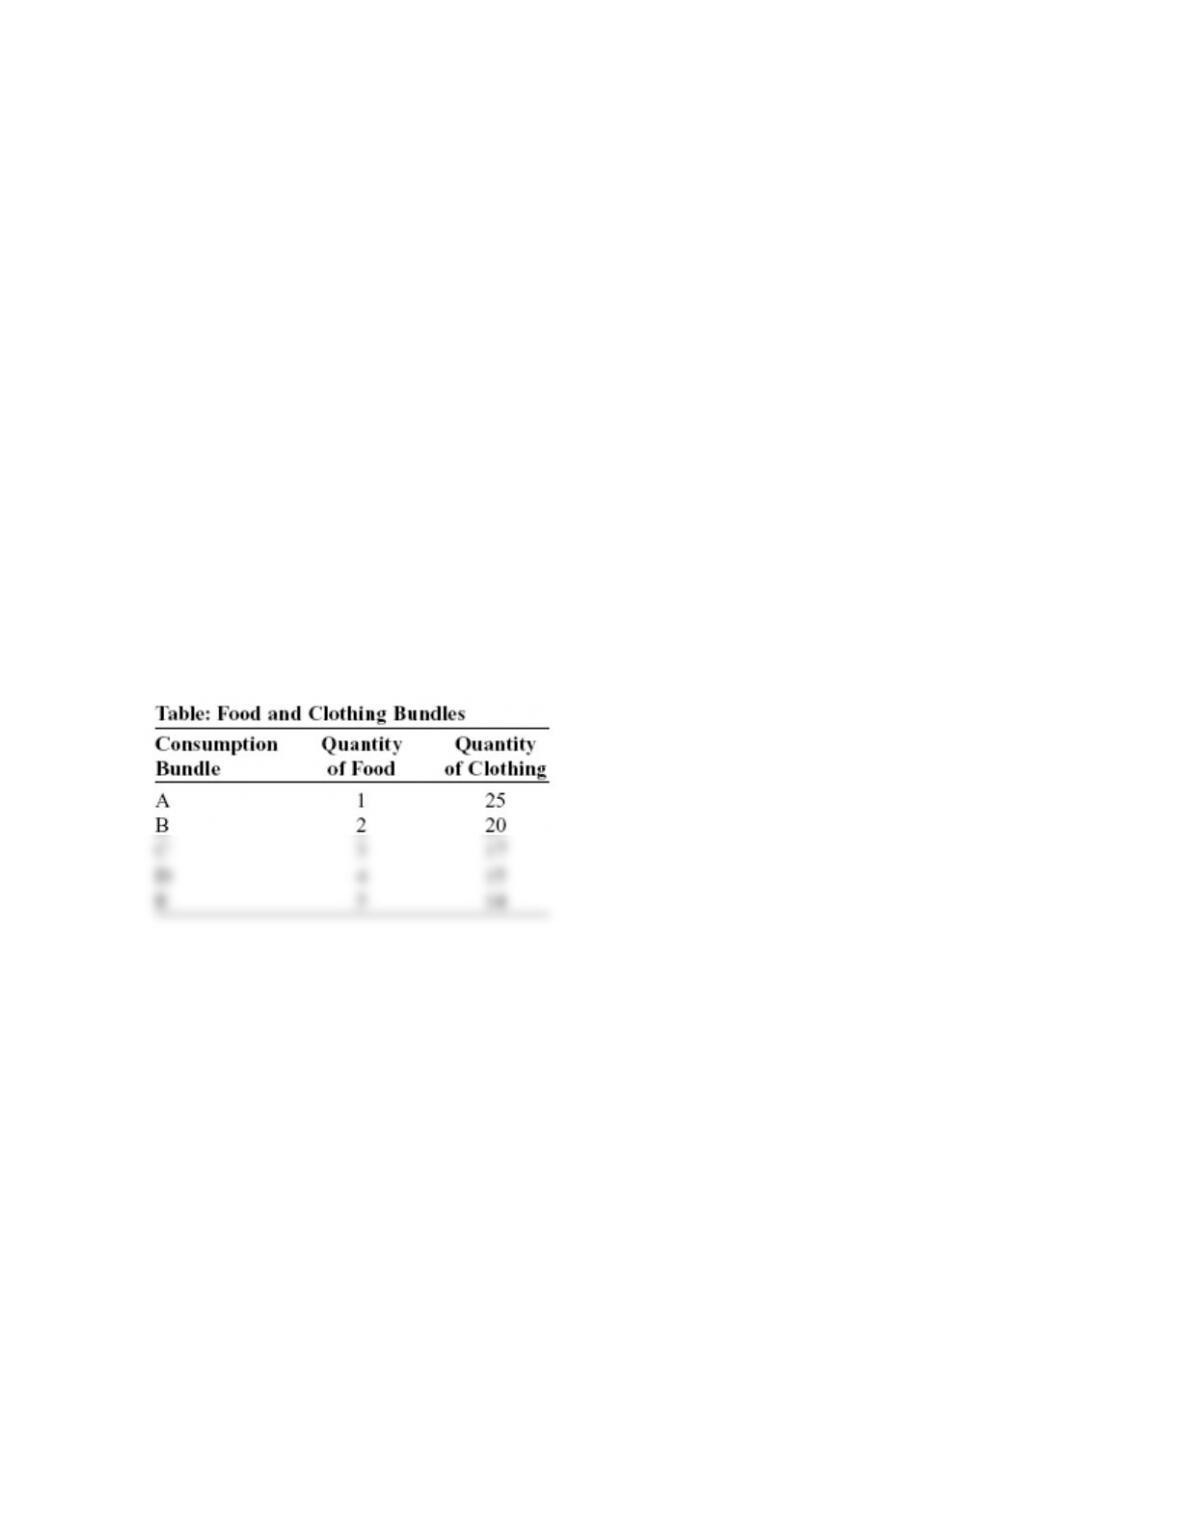
(Table: Food and Clothing Bundles) Use Table Food and Clothing Bundles. Teddy
enjoys consuming food and clothing. The table shows five bundles of food and clothing
that all provide Teddy with the same amount of utility. The marginal rate of substitution
of food for clothing as Teddy moves from bundle D to bundle E is equal to:
A)
1.
B)
–2.8.
C)
–14.
D)
–5.
Page 11
46.
(Table: Food and Clothing Bundles) Use Table Food and Clothing Bundles. Teddy
enjoys consuming food and clothing. The table shows five bundles of food and clothing
that all provide Teddy with the same amount of utility. If units of food were put on a
horizontal axis, what would we know about the shape of Teddy’s indifference curve?
A)
It is horizontal.
B)
It is upward-sloping, with a declining marginal rate of substitution.
C)
It is downward-sloping, with a constant marginal rate of substitution.
D)
It is downward-sloping, with a declining marginal rate of substitution.
47.
A decreasing marginal rate of substitution indicates that an indifference curve is:
A)
a straight line.
B)
a vertical line.
C)
a horizontal line.
D)
bowed in toward the origin.
48.
As a consumer gives up some of good A, which is on the horizontal axis, to get more of
good B, which is on the vertical axis, his or her marginal rate of substitution of good A
for good B:
A)
becomes infinite.
B)
goes from negative to positive.
C)
increases.
D)
decreases.
49.
If you are willing to give up 15 units of good A (on the vertical axis) for 5 units of good
B (on the horizontal axis) and your level of satisfaction is unchanged, the marginal rate
of substitution of B for A is:
A)
2.
B)
3.
C)
5.
D)
10.
50.
If you are willing to give up 8 units of good A (on the vertical axis) for 4 units of good B
(on the horizontal axis) and your level of satisfaction is unchanged, the marginal rate of
substitution of B for A is:
A)
0.5.
B)
2.
C)
1.
D)
5.
Page 12
51.
Calculating the marginal rate of substitution assumes that _____ remain(s) unchanged.
A)
prices
B)
money income
C)
satisfaction
D)
the quantities of both goods
52.
The _____ is the maximum amount of good X a consumer would be willing to give up
to obtain an additional unit of good Y.
A)
marginal rate of substitution
B)
marginal rate of utility exchange
C)
average rate of substitution
D)
marginal rate of exchange
53.
Rhonda spends all of her income on clothes and CDs. Suppose this situation were
graphed with clothes on the vertical axis and CDs on the horizontal axis. Rhonda
consumes a bundle of the two goods whose indifference curve is flatter than the budget
line. To increase total utility, given her income, Rhonda should:
A)
increase her consumption of clothes and decrease her consumption of CDs.
B)
increase her consumption of CDs and decrease her consumption of clothes.
C)
do nothing—she is consuming a bundle on her budget line.
D)
Not enough information is given to answer this question.
54.
A consumer maximizes utility, given her income, when she chooses a consumption
bundle whose:
A)
marginal utility of each good is equal.
B)
highest indifference curve is tangent to the budget line.
C)
marginal rate of substitution is highest.
D)
marginal utility of each good is highest.
55.
An individual consuming two goods, X and Y, has the usual downward-sloping, convex
indifference curves. All EXCEPT one of the following will characterize the optimal
consumption point. Which is the EXCEPTION?
A)
the intersection of an indifference curve and the budget line at the optimal point
B)
tangency between an indifference curve and the budget line at the optimal point
C)
the optimal consumption point lying on the budget line
D)
maximal utility at the optimal consumption point
Page 13
56.
If the combination of two goods occurs at a point of tangency between the budget line
and an indifference curve:
A)
consumer equilibrium has not been achieved.
B)
all available income has been spent and total utility is maximized.
C)
total utility can be increased by consuming less of both goods.
D)
total utility can be decreased by consuming more of both goods.
57.
When consumers maximize utility, they obtain:
A)
a point of intersection between indifference curves.
B)
any intersection of the budget line and the indifference curve.
C)
the highest indifference curve that touches their budget constraint.
D)
the lowest indifference curve that touches their budget constraint.
58.
Assume that a combination of two goods reflects a point of tangency between the
budget line and an indifference curve. In this situation, which of the following is
INCORRECT?
A)
Consumer equilibrium has been achieved.
B)
All available income has been spent.
C)
Utility can be increased by consuming less of both goods.
D)
The optimal consumption bundle has been reached.
59.
In terms of indifference curves, the optimal consumption bundle is determined by the:
A)
intersection of a budget line and an indifference curve.
B)
tangency of a budget line and an indifference curve.
C)
tangency of a price consumption curve and an income consumption curve.
D)
intersection of an income consumption curve and a price consumption curve.
60.
If the combination of two goods occurs at a point of tangency between the budget line
and an indifference curve:
A)
utility has been maximized.
B)
some available income has not been spent.
C)
utility can be decreased by consuming more of both goods.
D)
utility can be increased by consuming more of one good and less of the other.
61.
If the price of a ticket to a Minnesota Wild hockey game is $60 and the price of a snow
shovel is $40, the price of the hockey ticket relative to that of shovels is _____.
A)
40
B)
23.
C)
1.5
D)
6
Page 14
62.
If the price of a cookie is $1 and the price of a brownie is $2, the price of cookies in
terms of brownies is:
A)
0.5.
B)
1.0.
C)
2.0.
D)
undefined.
63.
If the price of a cookie is $2 and the price of a brownie is $4, the price of cookies in
terms of brownies is:
A)
0.5.
B)
1.0.
C)
2.0.
D)
undefined.
64.
Sandy has a monthly income of $4,000. She spends her income on business suits and
prepared organic meals. The price of a business suit is $1,000 and the price of a
prepared meal is $50. If we plot business suits on the vertical axis and organic meals on
the horizontal axis, the slope of Sandy’s budget line is:
A)
20.
B)
–0.05.
C)
–20.
D)
1,000.
65.
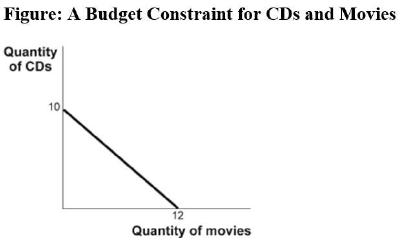
(Figure: A Budget Constraint for CDs and Movies) Use Figure A Budget Constraint for
CDs and Movies. Chantal likes to spend her weekly income on new CDs and tickets to
see movies. The price of a CD is $12 and the movie ticket price is $10. The graph shows
Chantal’s budget line. What is her weekly income?
A)
$240
B)
$100
C)
$120
D)
$22
Page 15
66.
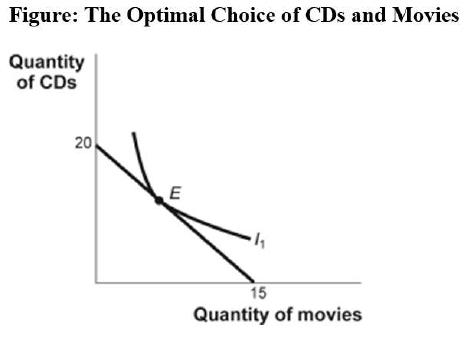
(Figure: The Optimal Choice of CDs and Movies) Use Figure The Optimal Choice of
CDs and Movies. Nina likes to spend her income on new CDs (CD) and tickets to see
movies (M). The graph shows Nina’s budget line and the optimal consumption bundle E.
What is the price of movies in terms of CDs at point E?
A)
0.33
B)
1.33
C)
MUCD / MUM
D)
PCD / PM
67.
According to the relative price rule, the optimal consumption bundle between hot dogs
and beer takes place when the _____ rate of substitution is _____ their relative price.
A)
total; equal to
B)
marginal; equal to
C)
marginal; higher than
D)
total; lower than
68.
The relative price rule says that at the optimal consumption bundle the marginal rate of
substitution between two goods must be equal to their relative price. This is equivalent
to saying that:
A)
the marginal utility per dollar is the same for both goods.
B)
the marginal utility of each good consumed must be the same.
C)
goods should be consumed in the same ratio as their relative price.
D)
the marginal rate of substitution is not equal to the ratio of marginal utilities.
Page 16
69.
After learning about indifference curves, Sandy realizes that her marginal rate of
substitution of grapes for cheese is 2. Since the price of cheese is $3 and the price of
grapes is $1, Sandy:
A)
should buy more grapes and less cheese.
B)
should buy more cheese and fewer grapes.
C)
is maximizing her utility.
D)
is on her highest possible indifference curve.
70.
While at the grocery store, Sidney sees that the price of Grape-Nuts is twice that of
Cheerios. If Sidney buys both goods, then Sidney must:
A)
get twice as much marginal utility from Grape-Nuts as from Cheerios.
B)
get twice as much marginal utility from Cheerios as from Grape-Nuts.
C)
not be maximizing utility.
D)
buy twice as much Cheerios.
71.
At the optimal consumption bundle, which of the following conditions does NOT hold?
A)
The ratio of marginal utility of any two goods is equal to the ratio of their prices.
B)
The indifference curve is tangent to the budget line.
C)
The marginal utility per dollar spent is equal for all goods consumed.
D)
The prices of the goods in the optimal bundle are equal.
72.
If the marginal rate of substitution of cookies for brownies equals the price of cookies in
terms of brownies when the consumer is on the budget line, the consumer:
A)
is maximizing total utility.
B)
should consume more cookies and fewer brownies to maximize total utility.
C)
should consume fewer cookies and more brownies to maximize total utility.
D)
may or may not be maximizing total utility.
73.
Joseph chooses a combination of apples and oranges along his budget line. The marginal
rate of substitution of apples for oranges is 2, the price of an apple is $0.50, and the
price of an orange is $1.50. Joseph:
A)
is maximizing total utility.
B)
should consume more apples and fewer oranges to maximize total utility.
C)
should consume fewer apples and more oranges to maximize total utility.
D)
may or may not be maximizing total utility.
Page 17
74.
Joseph chooses a combination of apples and oranges along his budget line. The marginal
rate of substitution of apples for oranges is 2, the price of an apple is $0.50, and the
price of an orange is $0.50. Joseph:
A)
is maximizing total utility.
B)
should consume more apples and fewer oranges to maximize total utility.
C)
should consume fewer apples and more oranges to maximize total utility.
D)
may or may not be maximizing total utility.
75.
Joseph chooses a combination of apples and oranges along his budget line. The marginal
rate of substitution of apples for oranges is 2, the price of an apple is $0.50, and the
price of an orange is $0.25. Joseph:
A)
is maximizing total utility.
B)
should consume more apples and fewer oranges to maximize total utility.
C)
should consume fewer apples and more oranges to maximize total utility.
D)
may or may not be maximizing total utility.
76.
Joseph chooses a combination of apples and oranges along his budget line. The marginal
rate of substitution of apples for oranges is 2, the price of an apple is $0.50, and the
price of an orange is $0.10. Joseph:
A)
is maximizing total utility.
B)
should consume more apples and fewer oranges to maximize total utility.
C)
should consume fewer apples and more oranges to maximize total utility.
D)
may or may not be maximizing total utility.
77.
Gillian is consuming her optimal consumption bundle of peanuts and raisins. The
marginal utility associated with the last peanut she consumes is 4 utils, and the marginal
utility associated with the last raisin is 2 utils. What must be the price of peanuts relative
to that of raisins?
A)
0.5
B)
1
C)
2
D)
The relative price is undefined.
78.
Luis is consuming his optimal consumption bundle of pizza and tacos. The marginal
utility associated with the last pizza he consumes is 1 util, and the marginal utility
associated with the last taco is 3 utils. What must be the relative price of pizza in terms
of tacos?
A)
0.33
B)
1
C)
3
D)
The relative price is undefined.
Page 18
79.
Margo has a monthly income of $60 to spend on coffee or bagels. Each cup of coffee
costs $3 and each bagel costs $4. Margo spends all of her income, and at her
consumption bundle, she is willing to forgo 1 bagel to get the next cup of coffee to
achieve the same level of utility. To maximize her utility, Margo should:
A)
increase coffee consumption and decrease bagel consumption.
B)
increase bagel consumption and decrease coffee consumption.
C)
do nothing.
D)
decrease both coffee and bagel consumption.
Use the following to answer questions 80-83:
80.
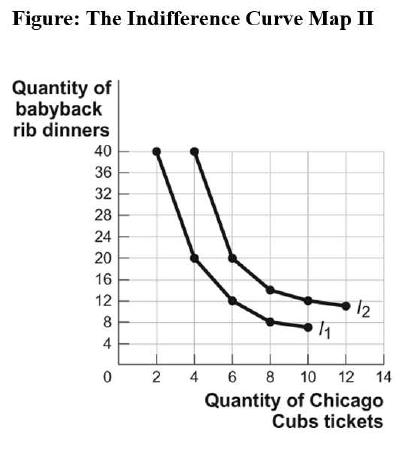
(Figure: The Indifference Curve Map II) Use Figure The Indifference Curve Map II.
Sara enjoys attending Chicago Cubs baseball games and eating baby back rib dinners.
The figure shows two of her indifference curves for Cubs tickets and baby back rib
dinners. Which of the following combinations gives Sara the highest level of utility?
A)
40 baby back rib dinners and 2 Cubs tickets
B)
20 baby back rib dinners and 4 Cubs tickets
C)
12 baby back rib dinners and 10 Cubs tickets
D)
All combinations give the same level of utility.
Page 19
81.
(Figure: The Indifference Curve Map II) Use Figure The Indifference Curve Map II.
Sara enjoys attending Chicago Cubs baseball games and eating baby back rib dinners.
The figure shows two of her indifference curves for Cubs tickets and baby back rib
dinners. If she consumes 20 baby back rib dinners and 4 tickets to Cubs games, she
would be equally happy to give up 8 dinners for _____ more ticket(s) to Cubs games.
A)
1
B)
0.5
C)
2
D)
4
82.
(Figure: The Indifference Curve Map II) Use Figure The Indifference Curve Map II.
Sara enjoys attending Chicago Cubs baseball games and eating baby back rib dinners.
The figure shows two of her indifference curves for Cubs tickets and baby back rib
dinners. If she consumes 20 baby back rib dinners and 6 tickets to Cubs games, she
would be equally happy to give up 8 dinners for _____ more ticket(s) to Cubs games.
A)
1
B)
0.5
C)
3
D)
4
83.
(Figure: The Indifference Curve Map II) Use Figure The Indifference Curve Map II.
Sara enjoys attending Chicago Cubs baseball games and eating baby back rib dinners.
The figure shows two of her indifference curves for Cubs tickets and baby back rib
dinners. If a new health report is released stating that there is a connection between baby
back rib dinners and heart attacks and this concerns Sara, each combination of Cubs
tickets and baby back ribs will now yield _____ for Sara.
A)
less utility
B)
more utility
C)
the same level of utility
D)
It is impossible to determine how Sara’s utility will be affected.
Page 20
Use the following to answer questions 84-88:
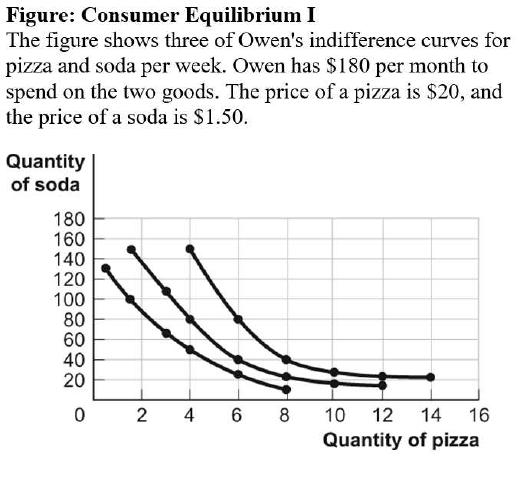
84.
(Figure: Consumer Equilibrium I) Use Figure Consumer Equilibrium I. What is Owen’s
optimal consumption bundle?
A)
4 pizzas and 150 sodas
B)
8 pizzas and 40 sodas
C)
6 pizzas and 40 sodas
D)
14 pizzas and 20 sodas
85.
(Figure: Consumer Equilibrium I) Use Figure Consumer Equilibrium I. If Owen
consumes 1.5 pizzas and 100 sodas, he:
A)
is maximizing his total utility.
B)
should consume more pizza and less soda to maximize his total utility.
C)
should consume less pizza and more soda to maximize his total utility.
D)
should consume more pizza and more soda to maximize his total utility.
86.
(Figure: Consumer Equilibrium I) Use Figure Consumer Equilibrium I. If Owen
consumes 1.5 pizzas and 100 sodas, which of the following describes the relationship
between his marginal rate of substitution of pizza for soda and the price of pizza in
terms of soda?
A)
The marginal rate of substitution equals the relative price.
B)
The marginal rate of substitution is greater than the relative price.
C)
The marginal rate of substitution is less than the relative price.
D)
It is impossible to determine, given the information available.