Chapter 15—Testing for Differences Between Groups and for Predictive Relationships
TRUE/FALSE
1. Cross-tabulation tables typically provide an easy, intuitive way of understanding data.
2. When the difference between two groups is measured, bivariate statistics are used.
3. If a researcher is interested in whether adult males purchase a product more frequently than adult
females, univariate statistics would be used in the analysis of data.
4. One way to test the significance of the relationship shown in a contingency tables is by means of the
chi-square test.
5. The chi-square test involves comparison of the observed frequencies of the groups with the expected
frequencies of the groups.
6. The chi-square test tests the significance of the relationship shown in an R X C contingency table in
which R stands for row and C stands for column.
7. To use the chi-square test, both variables in a 2 x 2 contingency table must be measured on a ratio
scale.
8. The chi-square test requires that the expected frequency in each cell of the contingency table be at least
30.
9. The independent samples t-test tests the differences between means from no more than four
independent samples or groups.
10. A pooled estimate of the standard error is a poorer estimate of the standard error than one based on the
variance from either sample.
11. The degrees of freedom are calculated as df = n
−
1 when using the t–test for comparing two means,
where n = n1 + n2.
12. A Z–test for differences of proportions requires a sample size greater than 100.
13. The null hypothesis for an ANOVA test comparing the means of three groups is: 1 = 2 = 3.
15. In a regression equation, the slope of the line, , is the change in X that is due to a corresponding
change of one unit of Y.
16. In most business research, the estimate of in a regression equation is most important.
17. In regression, the standardized Y-intercept term is always 1.
18. If the purpose of the regression analysis is forecasting, then standardized regression estimates are most
appropriate.
19. Multivariate statistical analysis permits the researcher to consider more than one dependent variable at
the same time.
20. In multiple regression, the dependent variable must be continuous and interval-scaled.
21. Multiple regression analysis includes a single independent variable but several dependent variables.
22. Mulitvariate dependence techniques are variants of the general linear model (GLM).
23. Several dummy variables can be included in a regression model.
24. In multiple regression, dummy variables are those that have no effect on the dependent variable.
25. In a regression equation, the beta coefficients indicate the effect on the dependent variable of a 1-unit
increase in any of the independent variables.
MULTIPLE CHOICE
1. A researcher hypothesizes that males and females differ with respect to attitude toward sports
sponsorships. To investigate this hypothesis that these two groups’ attitudes differ, the researcher will
use a ____.
a.
bivariate test of differences
b.
univariate test of differences
c.
multivariate test of differences
d.
cluster analysis
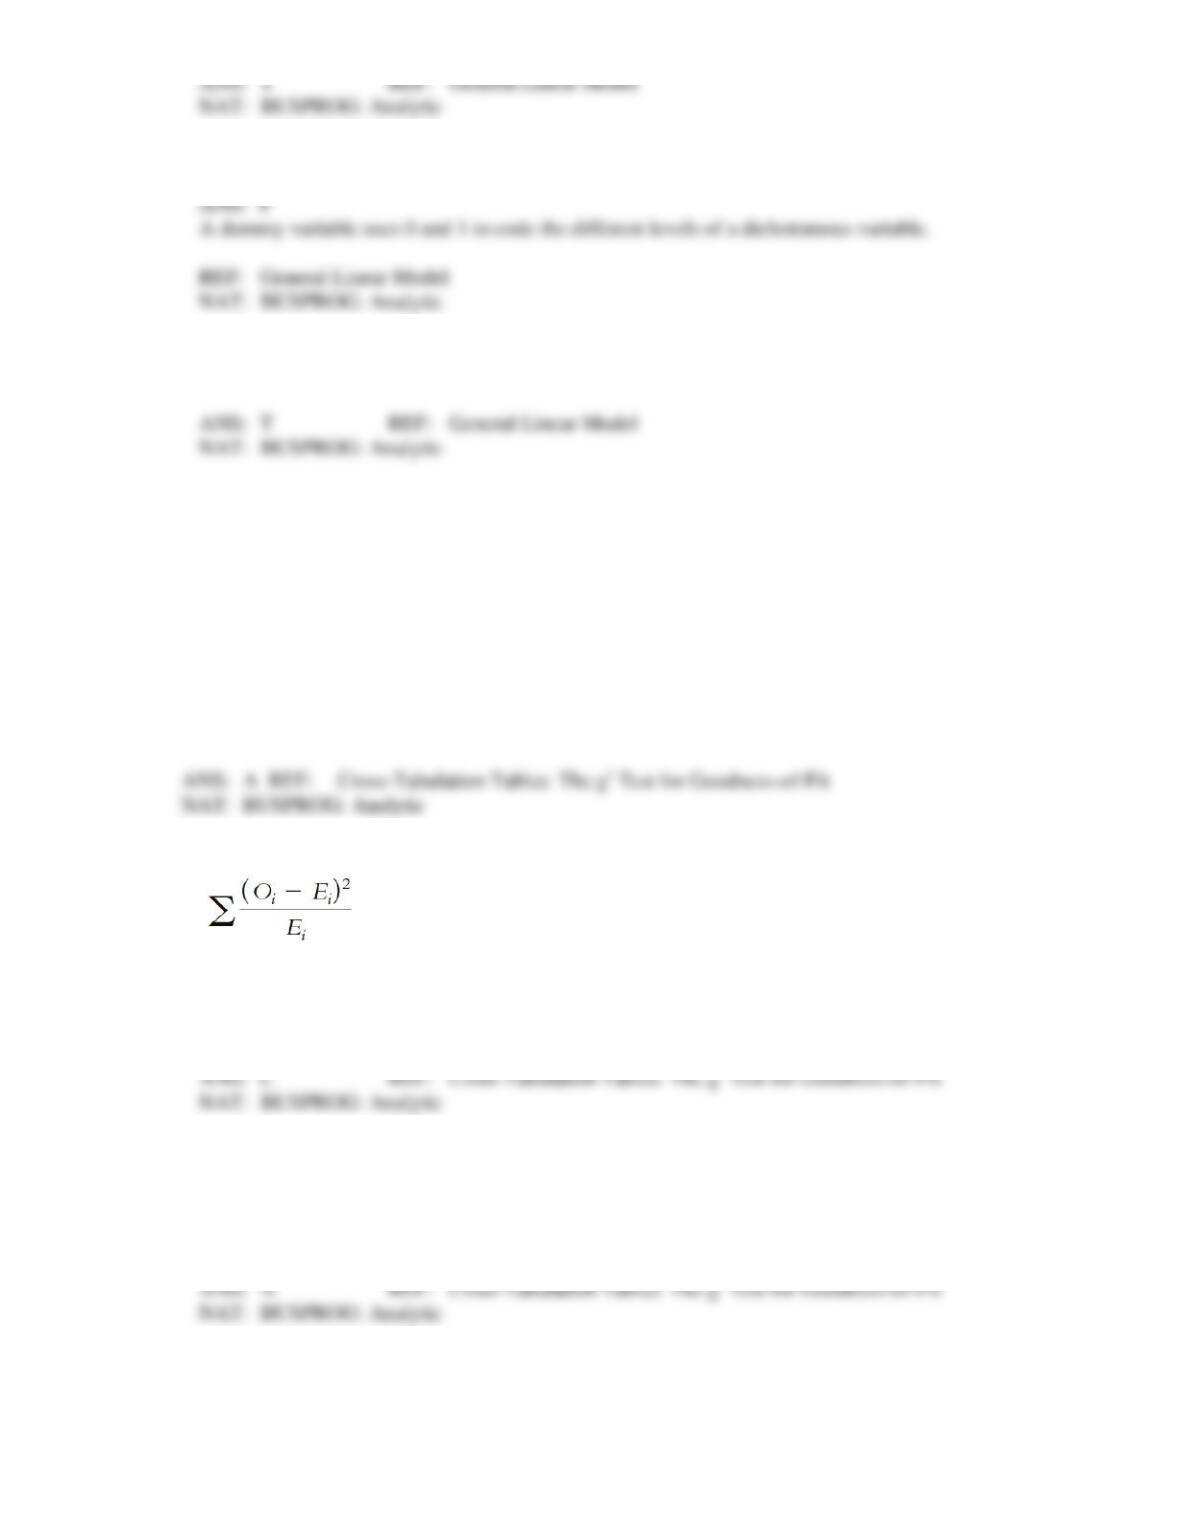
2. The formula given below represents the method for calculating the ____.
a.
Z-test
b.
F-test
c.
2 test
d.
3. The formula for the chi-square test uses ____.
a.
observed and expected frequencies
b.
observed and expected percentages
c.
the two sample means
d.
the two sample standard deviations
4. How many degrees of freedom are there in a four-cell chi-square test?
a.
(R + 1)
b.
(R – 1)
c.
(R – 1)(C – 1)
d.
R(C – 1)
5. In a brand awareness study, 25 of a group of 35 males identify the brand correctly and 15 of a group of
35 females identify this brand correctly. The chi-square value for this study is approximately ____.
a.
3.26
b.
4.15
c.
5.84
d.
7.92
6. In using the t-test to compare the means of two groups, the alternative hypothesis is typically stated as
____.
a.
1 2
b.
1 = 2
c.
1 – 2 = 2
d.
1 + 2 = 1
7. In comparing the difference of the means between two groups, the null hypothesis can also be stated as
____.
a.
1 – 2 = 0
b.
1 + 2 = 0
c.
1 x 2 = 0
d.
1 / 2 = 0
8. What is another form of the alternative hypothesis when testing the difference between the means of
the two groups?
a.
1 – 2 = 0
b.
1 – 2 0
c.
1 – 2 = 2
d.
1 – 2 2
9. Suppose that you are using a 9-point rating scale to compare men who have an annual income over
$50,000 (Group 1) with men who have an annual income less than or equal to $50,000 (Group 2) with
regard to their assessment of a new product. There are forty men in Group 1 and they have a mean of 7
and a standard deviation of 2.5, while the 35 men in Group 2 have a mean of 5 and a standard
deviation of 1.4. What is the approximate value of t using the t-test?
a.
3.43
b.
4.19
c.
5.64
d.
There is not enough information to determine this.
10. A study compares the means of two groups in which there are 45 males in Group 1 and 37 females in
Group 2. The degrees of freedom for this study when using the t-test for the difference between means
is ____.
a.
74
b.
80
c.
82
d.
160
11. In using the Z-test for comparing two proportions, the null hypothesis is typically stated as ____.
a.
1 = 2.
b.
1 2.
c.
1 x 2 = 1
d.
1 – 2 = 1
12. When the on-time performance of airlines is used to predict the number of customer complaints in a
regression equation, on-time performance is the ____ variable and the number of customer complaints
is the ____ variable.
a.
independent; dependent
b.
dependent; dependent
c.
dependent; independent
d.
independent; predictor
13. In regression analysis, the symbol X is commonly used for the ____ variable, and the symbol Y is
commonly used for the ____ variable.
a.
dependent; moderating
b.
independent; dependent
c.
dependent; independent
d.
independent; moderating
14. In the regression equation, Y = a +
X, Y is the ____.
a.
dependent variable
b.
slope
c.
independent variable
d.
intercept
15. In the regression equation, Y = a +
X ,
is the ____.
a.
y-intercept
b.
independent variable
c.
slope of the regression line
d.
dependent variable
16. In the regression equation, Y = a +
X, a is the symbol for the ____.
a.
slope of the regression line
b.
y-intercept of the regression line
c.
dependent variable
d.
independent variable
17. The equation, Y = a +
X, is the equation for the ____.
a.
coefficient of determination
b.
correlation coefficient
c.
least-squares regression line
d.
F-test
18. Consider this regression equation: Y = 24.35 – 14.2 X. Here, 24.35 is the ____, and -14.2 is the ____.
a.
slope; y-intercept
b.
independent variable; slope
c.
dependent variable; y-intercept
d.
y-intercept; slope
19. If the regression equation is: Y = -4.2 + 3.6 X, then the expected score for Y when X is 4 would be
____.
a.
-18.6
b.
10.2
c.
18.6
d.
20.2
20. Which value provides a common metric allowing regression results to be compared to one another,
regardless of what the original scale range may have been?
a.
standardized regression coefficient ()
b.
2
c.
coefficient of determination (R2)
d.
raw parameter estimates
21. The statistical significance of a regression model is determined using the ____.
a.
t-test
b.
2
c.
F-test
d.
Z-test
22. Which type of analysis involves three or more variables?
a.
univariate statistical analysis
b.
bivariate statistical analysis
c.
multivariate statistical analysis
d.
polyvariate statistical analysis
23. Multivariate dependence techniques are variants of the ____, which is a way of modeling some
process based on how different variables cause fluctuations from the average dependent variable.
a.
ordinary linear model (OLM)
b.
weighted average model (WAM)
c.
general linear model (GLM)
d.
metric scaling model (MSM)
24. When a researcher is attempting to predict sales volume by using building permits, amount of
advertising, and the income levels of residents, the researcher is most likely using ____.
a.
univariate analysis
b.
a chi-square analysis
c.
multiple regression analysis
d.
factor analysis
25. A variable that has two distinct levels that are coded as either zero or one is called a(n) ____.
a.
regression variable
b.
dummy variable
c.
MANOVA variable
d.
ANOVA variable
26. Which analysis is portrayed by the equation: Y = b +
1X1 +
2X2 +
3X3… +
nXn?
a.
simple regression
b.
multiple regression
c.
chi-square
d.
factor analysis
27. Consider the regression equation: Y = 98.3 +.35X1 + 22.3X2, the predicted value for Y when X1 = 3 and
X2 = 5 is ____.
a.
67.23
b.
98.34
c.
118.45
d.
210.85
28. In the formula df = n – k, k represents the ____.
a.
number of observations
b.
degrees of freedom of the denominator
c.
number of independent variables
d.
sample size
29. Jamal is analyzing data and his current focus centers on how strongly interrelated the independent
variables in his model are. Jamal is concerned about ____.
a.
multicollinearity
b.
MANOVA
c.
degrees of freedom
d.
convergence
30. Which of the following is computed by most regression programs and provides an indication of how
much multicollinearity exists among a set of independent variables?
a.
2
b.
c.
collinear coefficient
d.
variance inflation factor (VIF)
COMPLETION
1. In using the t-test to compare the difference between the means of two groups, the formula for
determining the degrees of freedom is ____________________.
2. An appropriate test for comparing the scores of two interval variables drawn from related populations
is the ____________________.
3. The null hypothesis when using the Z-test for the differences between the proportions of two groups is
that ____________________.
4. ____________________ is the appropriate test to use when comparing the means of three or more
groups to see if they are significantly different from one another.
5. The ____________________ is the mean of a variable over all observations.
6. The sum of differences between the group mean and the grand mean summed over all groups for a
given set of observations is called ____________________.
7. The statistical test used to determine whether there is more variability in the scores of one sample than
in the scores of another sample is the ____________________.
8. The F-test partitions total variance into ____________________ variance and
____________________ variance.
9. If the number of coupons given out at shopping malls is used to predict the number of tickets that will
be sold to a country and western band’s performance at a local club, the number of coupons is the
____________________ variable.
10. The test for the statistical significance of the regression model is the ____________________ test.
11. Statistical methods that permit the study of three or more variables at the same time are called
____________________ statistical analysis.
12. Multivariate dependence techniques are variants of the ____________________.
13. A(n) ____________________ variable has two distinct levels that are coded as 0 and 1.
14. ____________________ may be used to assess problems with multicollinearity.
15. ____________________ in regression analysis refers to how strongly interrelated the independent
variables in a model are.
ESSAY
1. Discuss when a paired-samples t–test is appropriate and give an example of when it should be used.
2. Describe a Z-test for comparing two proportions along with its appropriate null hypothesis.
3. What is ANOVA and when is it the appropriate statistical technique? What test is used to determine
significance?
4. Discuss the pros and cons of raw regression estimates and standardized regression estimates and
discuss when each is appropriate.
5. Discuss the steps in interpreting a multiple regression output.
ANS: