Chapter 13— Big Data Basics: Describing Samples and Populations
TRUE/FALSE
1. Auxiliary variables are those that the researcher should build into a survey that allow a comparison
between sample units that do respond and those that do not respond.
2. The primary purpose of inferential statistics is to make a judgment about a population.
3. Population parameters are computed from sample data.
4. Percentage frequency is the long-run relative frequency with which an event will occur.
5. A top box score generally refers to the frequency count of respondents who choose the most favorable
response toward a company.
6. The mean is simply the arithmetic average.
7. The midpoint of a distribution, above which and below which half of the scores fall, is called the
mode.
8. The mode is the measure of central tendency that identifies the value that occurs most often.
9. If between 125 and 150 units of a product have been produced each day during the past month, the
range of this production is 25 units.
10. The average deviation score is frequently used in marketing research studies.
11. The normal distribution is a symmetrical, bell-shaped distribution that describes the expected
probability distribution of many chance occurrences.
12. One hundred percent of the scores in a normal distribution fall within plus or minus two standard
deviations of the mean.
13. The standardized normal distribution has a mean of 1.0 and a standard deviation of zero.
14. The standardized normal distribution is a purely theoretical probability distribution that is of little use
in inferential statistics.
15. The value of Z is computed by the formula: Z = (X –
)/
.
16. A frequency distribution of a sample is called a sample distribution.
17. The central limit theorem states that, as sample size increases, the distribution of sample means of
samples of size n (when randomly selected) approaches a normal distribution.
18. A cross reference is an estimate of the population mean in the form of a single value.
19. A confidence interval estimate is a specified range of numbers within which a population mean is
expected to lie.
20. A common practice in marketing research is to use the 75 percent confidence interval about the mean
in research studies.
21. A researcher must calculate the sample mean to calculate the confidence intervals.
22. The confidence interval increases as the sample size, n, increases.
23. Increases in sample size reduce sampling error at a decreasing rate.
24. Three factors are required to specify sample size: (1) the variance of the population; (2) the population
mean; and (3) the confidence level.
25. In most cases, the size of the population does not have a major effect on the sample size.
MULTIPLE CHOICE
1. When a researcher wants to estimate national market share based on the results of the test market for a
new product in St. Louis and Kansas City, this is an example of:
a.
descriptive statistics
b.
the central limit theorem
c.
inferential statistics
d.
the standardized normal distribution
2. Summary measures about variables computed using only data taken from a sample are called sample:
a.
statistics
b.
parameters
c.
estimates
d.
scores
3. Nicole has created a table that summarizes the number of times a particular value of a variable occurs.
Nicole has created a ____ distribution.
a.
parameter
b.
normal
c.
frequency
d.
probability
4. ____ is the long-run relative frequency with which an event will occur.
a.
Probability
b.
Central tendency
c.
Estimation
d.
Deviation
5. In a test marked study, 206 out of a sample of 560 people state that they “liked” the product being
studied. The proportion of people in this study who said that they liked this product was about:
a.
.23
b.
.37
c.
.56
d.
.71
6. Which of the following refers to the proportion of respondents who choose the most positive choice in
a multiple choice question?
a.
heteroskedasticity
b.
mode
c.
median
d.
top-box score
7. Which of the following is not a measure of the central tendency of a set of scores?
a.
mode
b.
median
c.
mean
d.
range
8. The arithmetic average of a set of numbers is referred to as the _____.
a.
proportion
b.
mode
c.
mean
d.
median
9. Find the mean score of the following set of scores: 2, 5, 7, 4, 8.
a.
4.8
b.
5.2
c.
7.0
d.
26.0
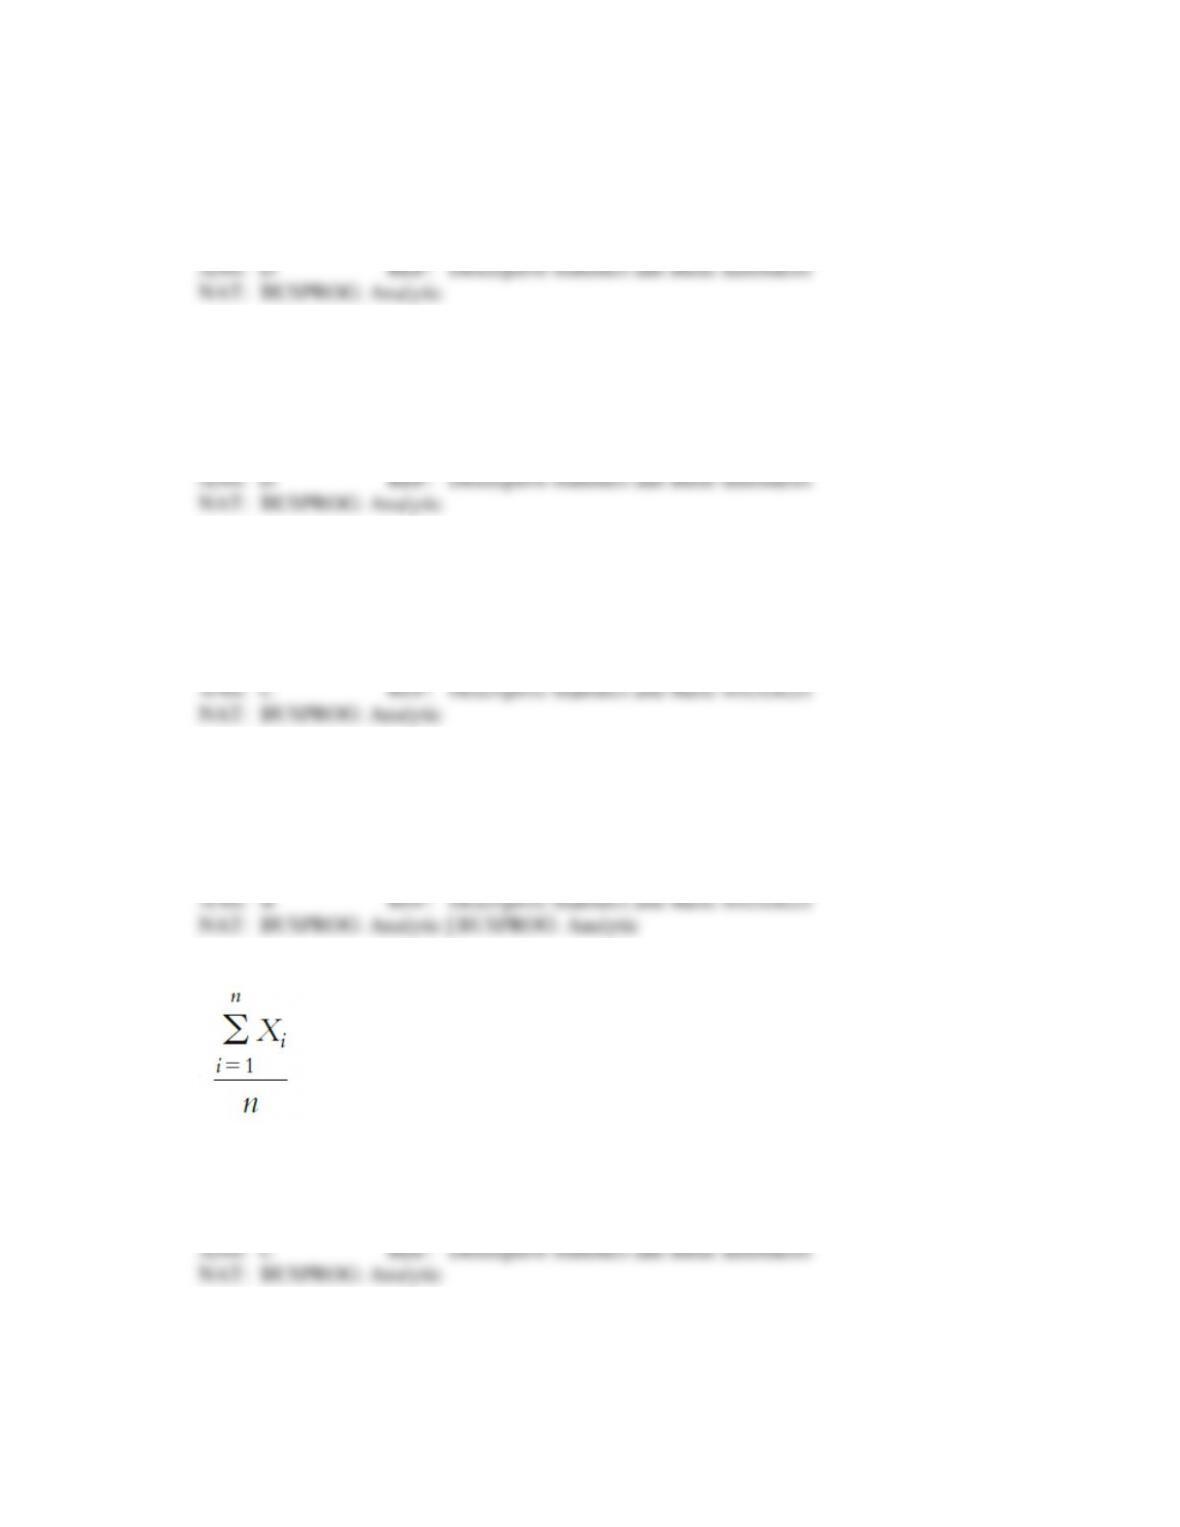
10. The formula below is used to calculate the ____.
a.
mode of a sample
b.
median of a sample
c.
sample mean
d.
range of a sample
11. The value below which half the values in a distribution fall is the ____.
a.
mean
b.
median
c.
mode
d.
range
12. The measure of central tendency that identifies the value that occurs most often is called the ____.
a.
mean
b.
median
c.
mode
d.
range
13. The ____ is a measure of dispersion.
a.
mean
b.
proportion
c.
range
d.
mode
14. Suppose the price of MP3 players in Denver range from $59 to $179. Then, the range of these prices is
____.
a.
$59
b.
$120
c.
$179
d.
$238
15. Suppose the average units produced in a month by a Ford Motor Co. plant for Ford Explorers is 22, but
only 18 Explorers are produced on a given day in that same month. Then, the deviation score for this
one day is ____.
a.
-4
b.
-2
c.
+2
d.
+4
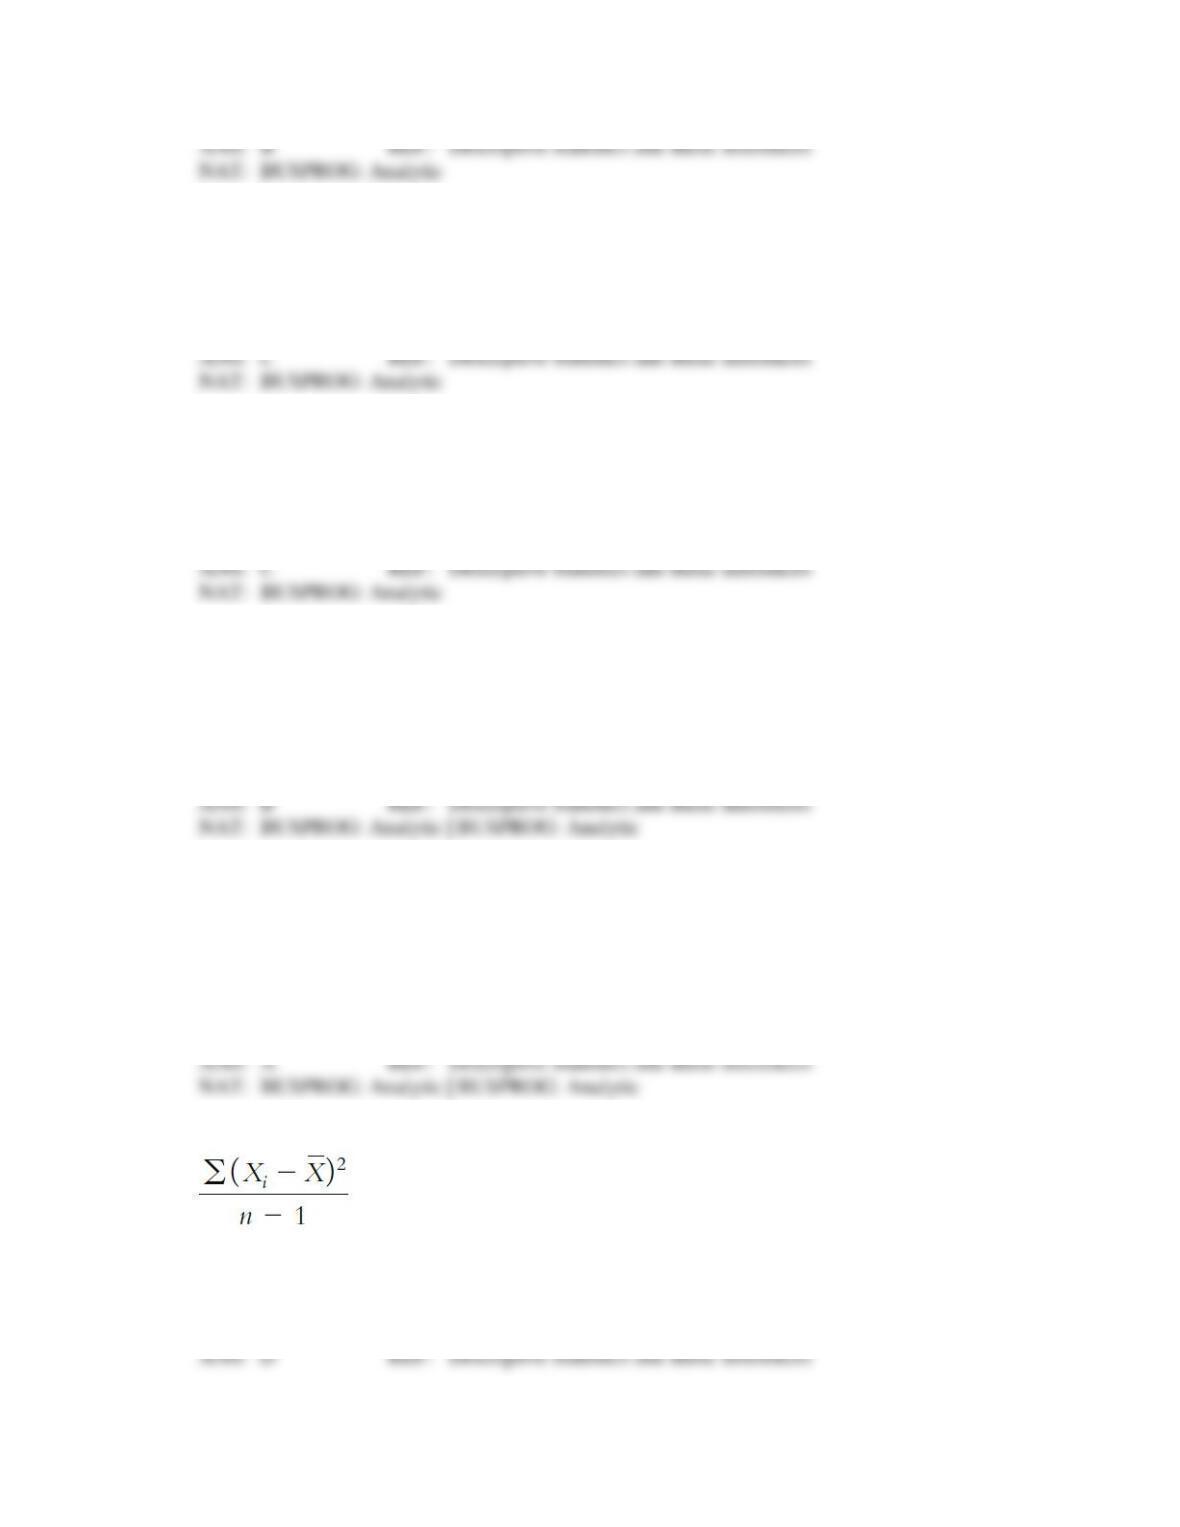
16. The formula below is used to compute ____.
a.
standard deviation
b.
standard error of the mean
c.
standard error of the proportion
d.
variance
17. Which of the following eliminates the drawback of having the measure of dispersion in squared units
rather than in the original measurement units?
a.
standard deviation
b.
variance
c.
deviation
d.
mean
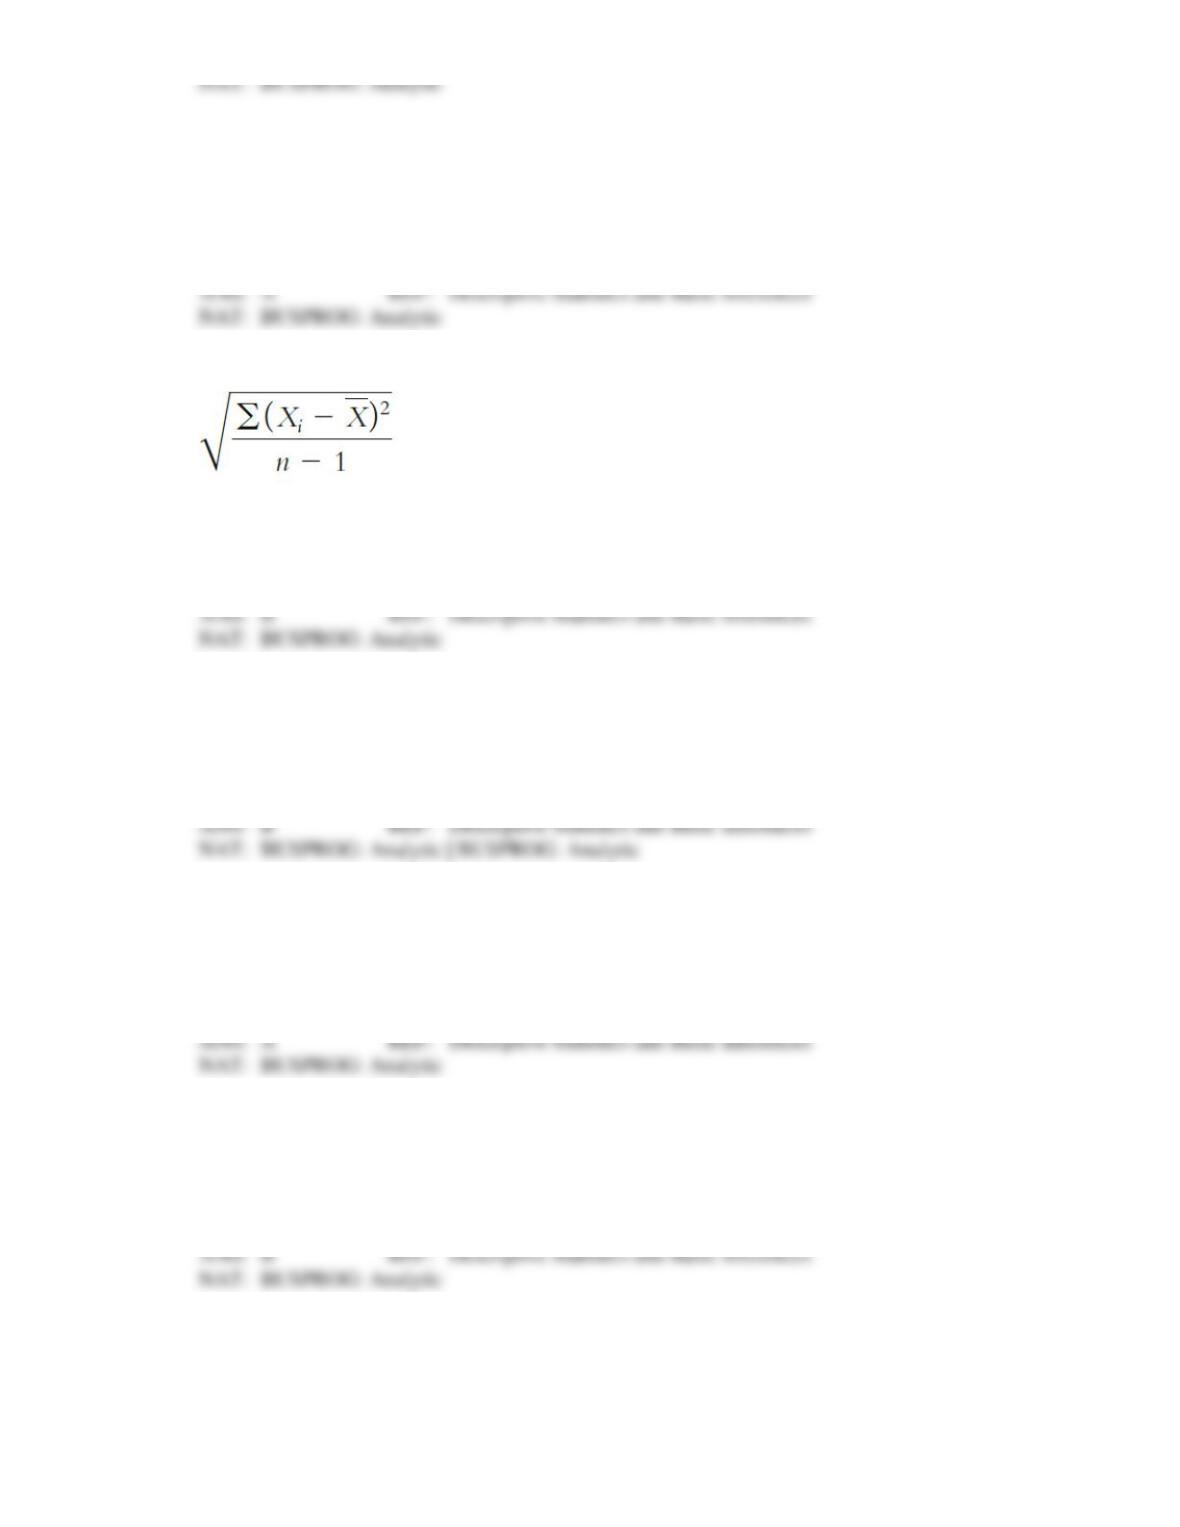
18. The following formula is used to compute ____.
a.
standard error of the mean
b.
standard deviation
c.
standard normal distribution
d.
variance
19. Find the approximate standard deviation of the following set of scores: 3, 6, 2, 7, 8.
a.
2.24
b.
2.59
c.
3.32
d.
6.70
20. Which of the following is the symbol for the sample standard deviation?
a.
S
b.
2
c.
d.
2
21. Which of the following is the symbol for the population standard deviation?
a.
S
b.
c.
d.
S2
22. One of the most common probability distributions in statistics is the _____ distribution.
a.
normal
b.
standard
c.
central
d.
confidence interval
23. All of the following are characteristics of the standardized normal distribution EXCEPT that it ____.
a.
is symmetrical about its mean
b.
has an infinite number of cases
c.
mean identifies the normal curve’s highest point (the mode)
d.
has a mean of 1 and a standard deviation of 0
24. Suppose a population mean is assumed to be 20 and the sample standard deviation is 5. Then, a score
of 15 would have a Z-value of approximately ____.
a.
-7.00
b.
-1.00
c.
+1.00
d.
+5.00
25. A frequency distribution of the population elements is called a ____.
a.
normal distribution
b.
sample statistic
c.
population distribution
d.
standard error
26. The standard deviation of the sampling distribution is called the ____.
a.
range
b.
standard median
c.
dispersion
d.
standard error of the mean
27. Which theorem states that as sample size increases, the distribution of sample means of size n,
randomly selected, approaches a normal distribution?
a.
prospect
b.
central-limit
c.
dispersion
d.
entropy
28. An estimate of the population mean in the form of a single value, usually the sample mean, is called a
____.
a.
confidence interval estimate
b.
standard deviation
c.
point estimate
d.
variant
29. If the sample standard deviation is 10.5 and the sample mean is 48 based on a study with a sample size
of 120, the 95 percent confidence interval about the mean is between approximately ____.
a.
44.37 and 51.63
b.
46.12 and 49.88
c.
47.88 and 48.12
d.
40.0 and 50.0
30. If 35 percent of TV viewers recalled seeing an ad for a Ford Explorer on a particular television
program based on a sample of 800 viewers, the 95 percent confidence interval for this study would be
between approximately ____.
a.
30 percent and 40 percent
b.
32 percent and 38 percent
c.
28 percent and 42 percent
d.
20 percent and 30 percent
COMPLETION
1. Measured characteristics of a specific population are called ____________________.
2. When a data set is summarized by counting the number of times each value for a variable occurs in the
sample, this is known as a ____________________.
3. A frequency distribution organized into a table or graph that summarizes percentage values associated
with particular values of a variable is called a(n) ____________________.
4. The percentage of elements that meet some criterion is referred to as the ____________________.
5. When you add up a set of scores and divide the result by the number of scores, you have determined
the ____________________ of the distribution.
6. The middle score in a set of rank ordered scores is called the ____________________ score.
7. The simplest measure of the dispersion of a set of scores is the ____________________.
8. The ____________________ distribution is bell shaped.
9. A frequency distribution of a sample is called a(n) ____________________.
10. The standard deviation of the sampling distribution is called the ____________________ of the mean.
11. The idea that as sample size increases, the distribution of sample means of samples of size n, when
randomly selected, approaches a normal distribution is known as the ____________________.
12. An estimate of the population mean in the form of a single value is called a(n)
____________________ estimate.
13. The range of numbers within which the population mean is expected to lie 95 percent of the time
referred to as a(n) ____________________ estimate.
14. Traditionally, market researchers have used the ____________________ percent confidence level in
research studies.
15. In computing a 95 percent confidence interval about a proportion for a sample size of 40, the
appropriate Z-value to be used is ____________________.
ESSAY
1. Name and describe the measures of central tendency.
2. Describe the measures of dispersion and explain why standard deviation is used most often.
3. List the characteristics of the standardized normal distribution and explain why it is a useful
distribution in inferential statistics.
4. Explain the central-limit theorem and discuss why it is useful to marketing researchers.
5. Discuss the three factors required to specify sample size.