Name:
Class:
Date:
Chapter 05: Elementary Statistics
Copyright Cengage Learning. Powered by Cognero.
Page 1
1. A procedure for calculating an average that relies on the most numerous value in a distribution is the ____.
a.
median
b.
mode
c.
standard deviation
d.
mean
ANSWER:
b
2. If one adds the values in a group to create a sum and then divides the sum by the number of values in the group, the
____ would be derived.
a.
standard deviation
b.
mode
c.
median
d.
mean
ANSWER:
d
3. What is a collection of values called?
a.
a distribution
b.
a central tendency
c.
a standard deviation
d.
a histogram
ANSWER:
a
4. A ____ distribution is characterized by a clustering of values around a central point and being well-centered on the
mean.
a.
deviation
b.
skewed
c.
normal
d.
nonsymmetrical
ANSWER:
c
5. If a graph of a distribution shows a wide range of values, which statement is most likely true?
a.
the mean and the median are identical
b.
the distribution has a large standard deviation
c.
the distribution has a small standard deviation
d.
there is little variation in the values in the distribution
ANSWER:
b
6. If a graph of a distribution shows a very narrow range, which statement is most likely true?
a.
the mean and the median are identical
b.
the distribution has a large standard deviation
c.
the distribution has a small standard deviation
d.
there is much variation in the values in the distribution
ANSWER:
c
Name:
Class:
Date:
Chapter 05: Elementary Statistics
Copyright Cengage Learning. Powered by Cognero.
Page 2
7. In comparing two curves graphed on the same axis, if the difference between the two means is four standard deviations
or more, the difference between the two curves is considered to be statistically ____.
a.
conclusive
b.
inconclusive
c.
insignificant
d.
significant
ANSWER:
d
8. For the most reliable conclusions about data, the sample size should be at least ____.
a.
5
b.
10
c.
25
d.
50
ANSWER:
b
9. What is the mean of a standard normal distribution?
a.
0
b.
1
c.
2
d.
5
ANSWER:
a
10. In a standard normal distribution, about ____ percent of values are within one standard deviation.
a.
15
b.
22
c.
35
d.
68
ANSWER:
d
11. For a distribution to be normal, it must show a specific clustering of values called ____.
a.
a mean equal to the standard deviation
b.
central tendency
c.
a mean of 0
d.
a standard deviation of 1
ANSWER:
b
12. In a distribution, the difference between each value and the mean of the distribution is used to calculate the ____.
a.
standard deviation
b.
normalcy
c.
median
d.
mode
ANSWER:
a
13. In a standard normal distribution, about ____ percent of values are between 2 and 3 standard deviations above or

Name:
Class:
Date:
Chapter 05: Elementary Statistics
Copyright Cengage Learning. Powered by Cognero.
Page 3
below the mean.
a.
2.2
b.
3.6
c.
4.3
d.
5.6
ANSWER:
c
14.
In the distribution below, what is the median?
4, 6, 7, 9, 12, 17, 19
a.
9
b.
10
c.
12
d.
74
ANSWER:
a
15.
In the distribution below, what is the mean?
4, 6, 7, 9, 12, 17, 19
a.
9.6
b.
10.6
c.
12.6
d.
14.6
ANSWER:
b
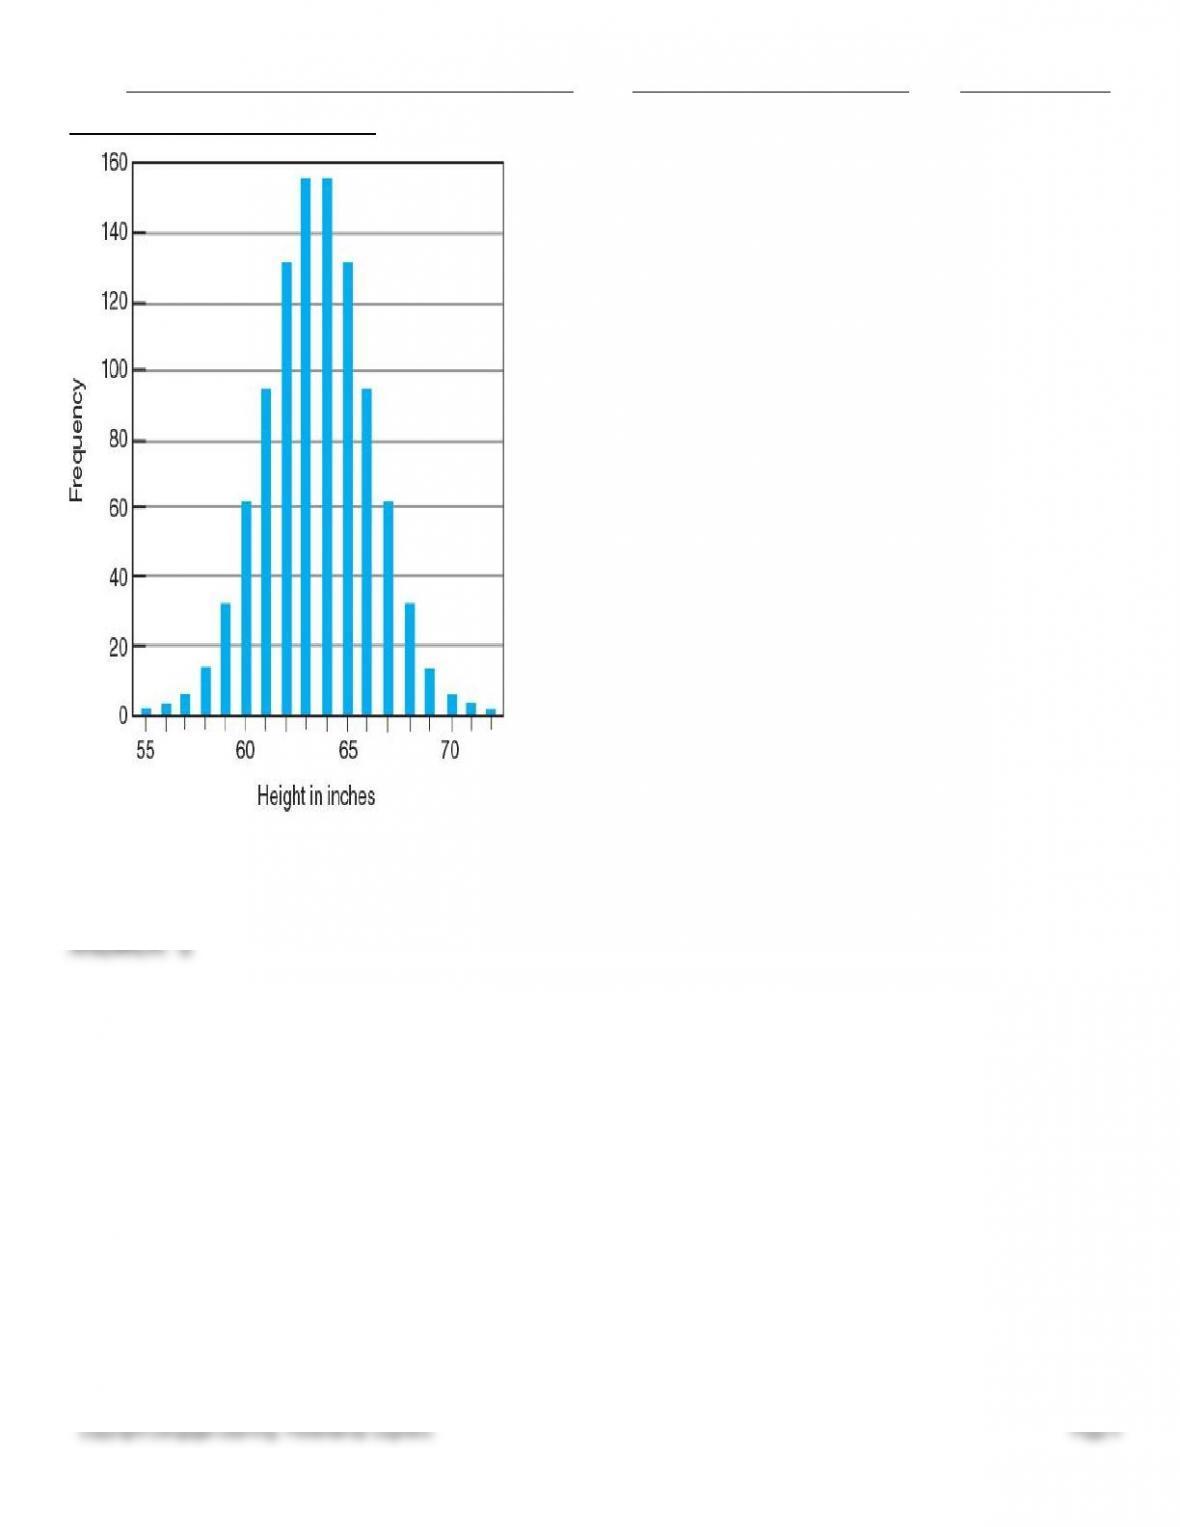
16. This graph, called a ____, shows the frequencies of heights of 1000 women.
Name:
Class:
Date:
Chapter 05: Elementary Statistics
Copyright Cengage Learning. Powered by Cognero.
Page 4
a.
skew curve
b.
histogram
c.
central tendency graph
d.
plot of means
ANSWER:
b
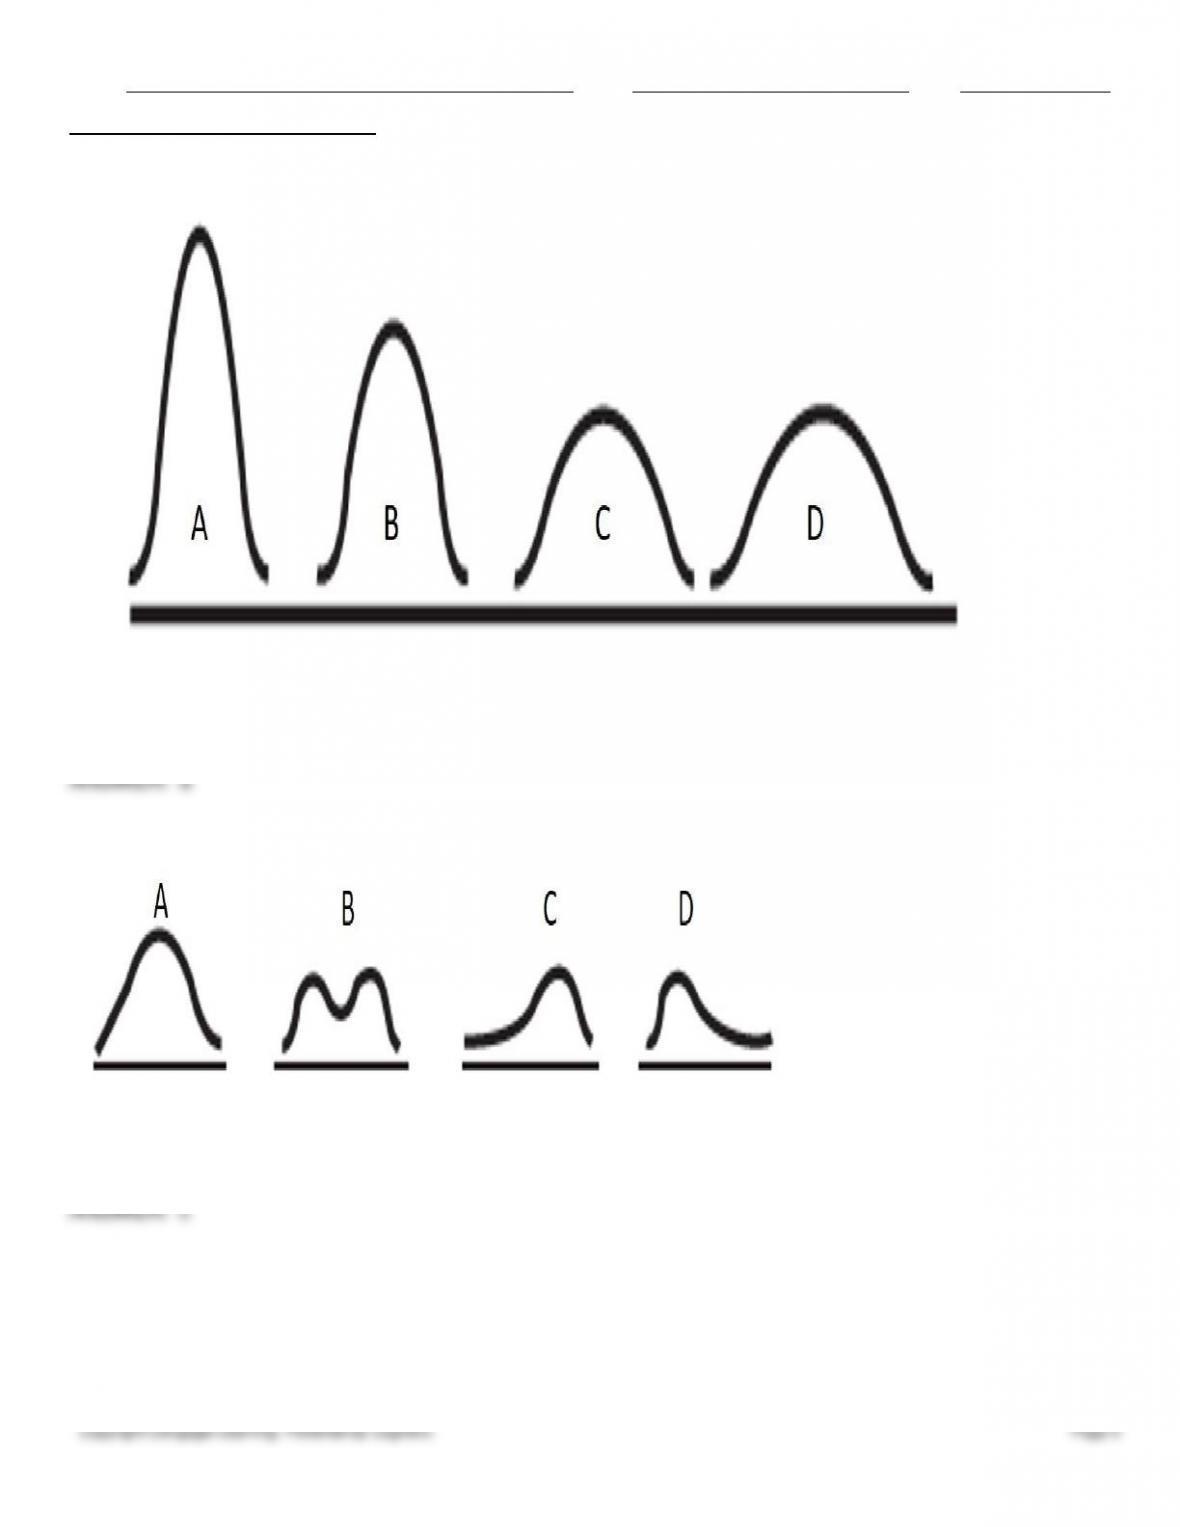
17. In these examples of bell curves, which one indicates that most of the data lie closest to the average?
Name:
Class:
Date:
Chapter 05: Elementary Statistics
Copyright Cengage Learning. Powered by Cognero.
Page 5
a.
A
b.
B
c.
C
d.
D
ANSWER:
a
18. Which letter represents a normal distribution?
a.
A
b.
B
c.
C
d.
D
ANSWER:
c
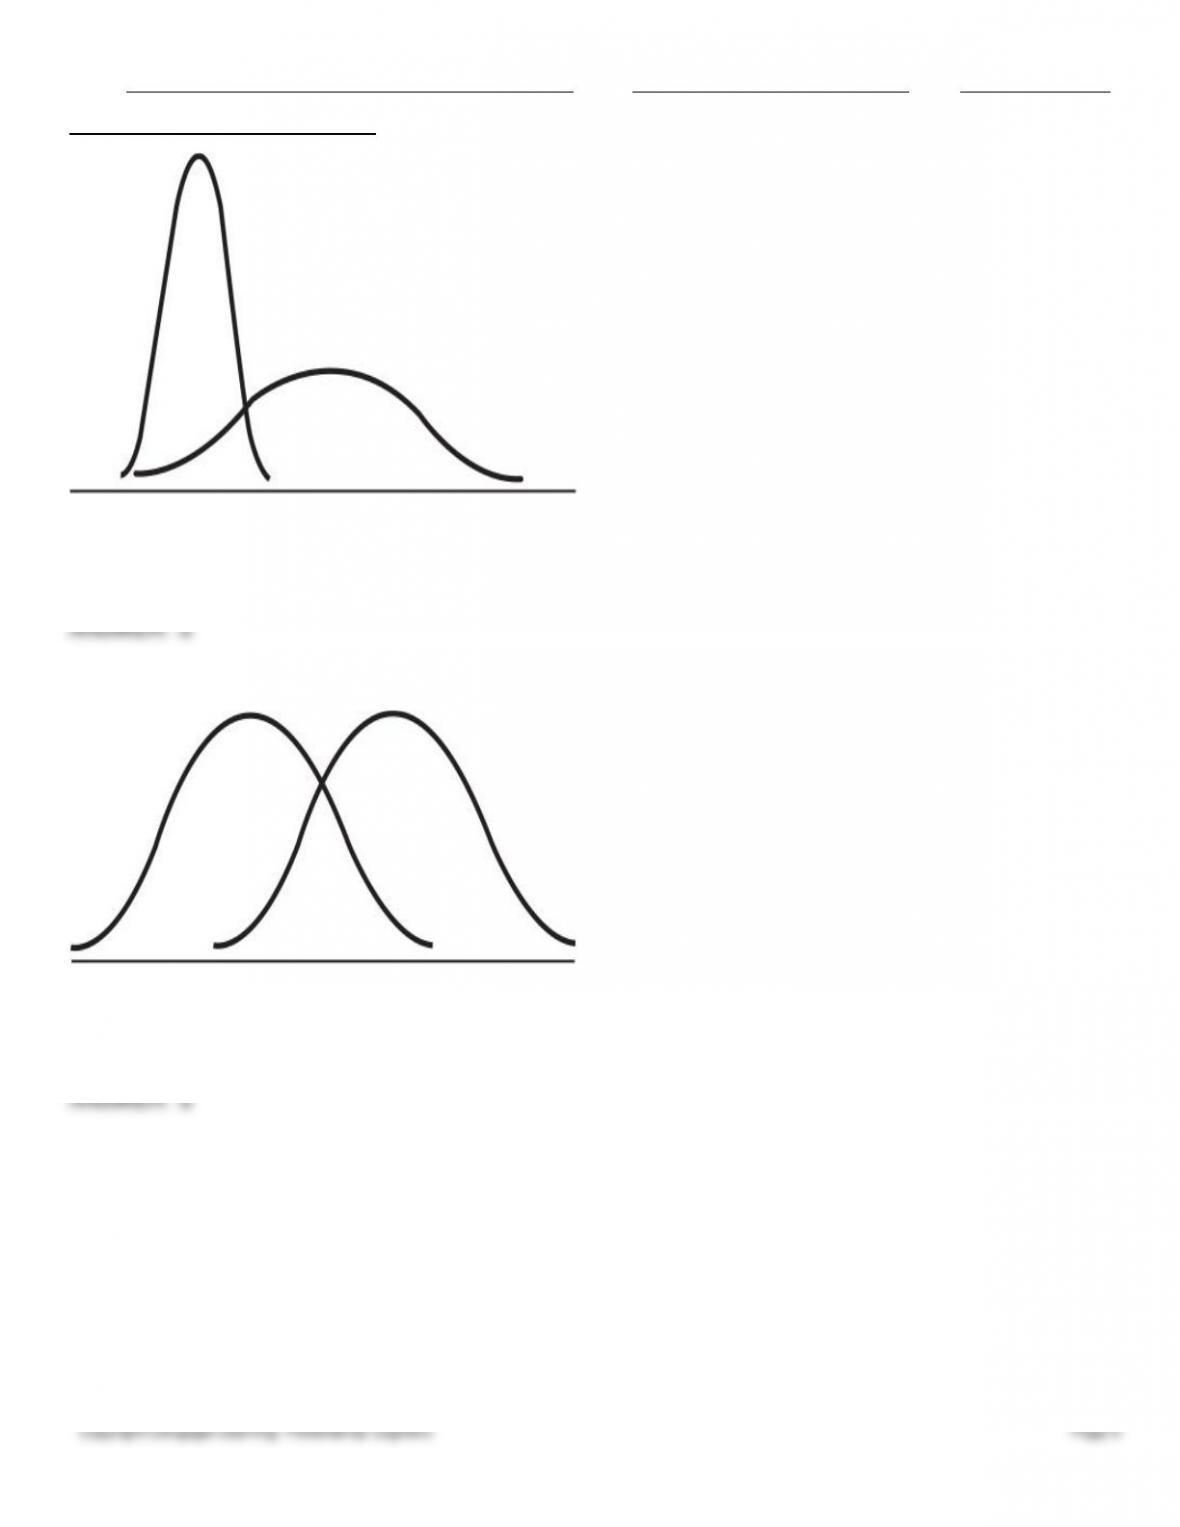
19. These two curves show ____.
Name:
Class:
Date:
Chapter 05: Elementary Statistics
Copyright Cengage Learning. Powered by Cognero.
Page 6
a.
large differences in standard deviations
b.
similar means
c.
skewed curves
d.
standard normal curves
ANSWER:
a
20. These two curves show ____.
a.
large differences in standard deviations
b.
inconclusive evidence of similarity
c.
skewed curves
d.
standard normal curves
ANSWER:
a