41
Copyright 2019 © McGraw-Hill Education. All rights reserved. No reproduction or distribution without the prior
written consent of McGraw-Hill Education.
Answer: A
Explanation: Leverage ratio = Assets/Equity = $4,300,000/($500,000 + 2,800,000) = 1.3
Difficulty: 2 Medium
Topic: Ratio Analysis
Learning Objective: 14-03 Use ratio decomposition analysis to show how profitability depends
on efficient use of assets; profit margin; and leverage.
Bloom’s: Apply
AACSB: Analytical Thinking
Accessibility: Keyboard Navigation

42
43) The financial statements of Burnaby Mountain Trading Company are shown below.
Income Statement 2017
Sales
$
7,000,000
Cost of Goods Sold
5,000,000
Gross Profit
$
2,000,000
Selling and Administrative Expenses
1,700,000
EBIT
$
300,000
Interest Expense
50,000
Income before Tax
$
250,000
Taxes
100,000
Net Income
$
150,000
Burnaby Mountain Trading Company
Comparative Balance Sheets
2017
2016
Cash
$
90,000
$
80,000
Accounts Receivable
810,000
800,000
Inventory
800,000
720,000
Total Current Assets
$
1,700,000
$
1,600,000
Fixed Assets
2,600,000
2,400,000
Total Assets
$
4,300,000
$
4,000,000
Accounts Payable
$
500,000
$
400,000
Bank Loans
100,000
100,000
Total Current Liabilities
$
600,000
$
500,000
Long-term Bonds
400,000
300,000
Total Liabilities
$
1,000,000
$
800,000
Common Stock (200,000 shares)
500,000
500,000
Retainded Earnings
2,800,000
2,700,000
Total Equity
$
3,300,000
$
3,200,000
Total Liabilities and Equity
$
4,300,000
$
4,000,000
Note: The common shares are trading in the stock market for $27 each.
Refer to the financial statements of Burnaby Mountain Trading Company. The firm’s times-
interest-earned ratio for 2017 is ________.
A) 2.8
B) 6
C) 9
D) 11.11
43
Copyright 2019 © McGraw-Hill Education. All rights reserved. No reproduction or distribution without the prior
written consent of McGraw-Hill Education.
Answer: B
Explanation: TIE = 300,000/50,000 = 6
Difficulty: 2 Medium
Topic: Ratio Analysis
Learning Objective: 14-03 Use ratio decomposition analysis to show how profitability depends
on efficient use of assets; profit margin; and leverage.
Bloom’s: Apply
AACSB: Analytical Thinking
Accessibility: Keyboard Navigation

44
44) The financial statements of Burnaby Mountain Trading Company are shown below.
Income Statement 2017
Sales
$
7,000,000
Cost of Goods Sold
5,000,000
Gross Profit
$
2,000,000
Selling and Administrative Expenses
1,700,000
EBIT
$
300,000
Interest Expense
50,000
Income before Tax
$
250,000
Taxes
100,000
Net Income
$
150,000
Burnaby Mountain Trading Company
Comparative Balance Sheets
2017
2016
Cash
$
90,000
$
80,000
Accounts Receivable
810,000
800,000
Inventory
800,000
720,000
Total Current Assets
$
1,700,000
$
1,600,000
Fixed Assets
2,600,000
2,400,000
Total Assets
$
4,300,000
$
4,000,000
Accounts Payable
$
500,000
$
400,000
Bank Loans
100,000
100,000
Total Current Liabilities
$
600,000
$
500,000
Long-term Bonds
400,000
300,000
Total Liabilities
$
1,000,000
$
800,000
Common Stock (200,000 shares)
500,000
500,000
Retainded Earnings
2,800,000
2,700,000
Total Equity
$
3,300,000
$
3,200,000
Total Liabilities and Equity
$
4,300,000
$
4,000,000
Note: The common shares are trading in the stock market for $27 each.
Refer to the financial statements of Burnaby Mountain Trading Company. The firm’s fixed-asset
turnover ratio for 2017 is ________. (Please keep in mind that when a ratio involves both income
statement and balance sheet numbers, the balance sheet numbers for the beginning and end of the
year must be averaged.)

A) 2.8
B) 6
C) 9
D) 11.11
46
45) The financial statements of Burnaby Mountain Trading Company are shown below.
Income Statement 2017
Sales
$
7,000,000
Cost of Goods Sold
5,000,000
Gross Profit
$
2,000,000
Selling and Administrative Expenses
1,700,000
EBIT
$
300,000
Interest Expense
50,000
Income before Tax
$
250,000
Taxes
100,000
Net Income
$
150,000
Burnaby Mountain Trading Company
Comparative Balance Sheets
2017
2016
Cash
$
90,000
$
80,000
Accounts Receivable
810,000
800,000
Inventory
800,000
720,000
Total Current Assets
$
1,700,000
$
1,600,000
Fixed Assets
2,600,000
2,400,000
Total Assets
$
4,300,000
$
4,000,000
Accounts Payable
$
500,000
$
400,000
Bank Loans
100,000
100,000
Total Current Liabilities
$
600,000
$
500,000
Long-term Bonds
400,000
300,000
Total Liabilities
$
1,000,000
$
800,000
Common Stock (200,000 shares)
500,000
500,000
Retainded Earnings
2,800,000
2,700,000
Total Equity
$
3,300,000
$
3,200,000
Total Liabilities and Equity
$
4,300,000
$
4,000,000
Note: The common shares are trading in the stock market for $27 each.
Refer to the financial statements of Burnaby Mountain Trading Company. The firm’s asset
turnover ratio for 2017 is ________. (Please keep in mind that when a ratio involves both income
statement and balance sheet numbers, the balance sheet numbers for the beginning and end of the
year must be averaged.)
A) 1.3
B) 1.5
C) 1.69
D) 2.83

48
46) The financial statements of Burnaby Mountain Trading Company are shown below.
Income Statement 2017
Sales
$
7,000,000
Cost of Goods Sold
5,000,000
Gross Profit
$
2,000,000
Selling and Administrative Expenses
1,700,000
EBIT
$
300,000
Interest Expense
50,000
Income before Tax
$
250,000
Taxes
100,000
Net Income
$
150,000
Burnaby Mountain Trading Company
Comparative Balance Sheets
2017
2016
Cash
$
90,000
$
80,000
Accounts Receivable
810,000
800,000
Inventory
800,000
720,000
Total Current Assets
$
1,700,000
$
1,600,000
Fixed Assets
2,600,000
2,400,000
Total Assets
$
4,300,000
$
4,000,000
Accounts Payable
$
500,000
$
400,000
Bank Loans
100,000
100,000
Total Current Liabilities
$
600,000
$
500,000
Long-term Bonds
400,000
300,000
Total Liabilities
$
1,000,000
$
800,000
Common Stock (200,000 shares)
500,000
500,000
Retainded Earnings
2,800,000
2,700,000
Total Equity
$
3,300,000
$
3,200,000
Total Liabilities and Equity
$
4,300,000
$
4,000,000
Note: The common shares are trading in the stock market for $27 each.
Refer to the financial statements of Burnaby Mountain Trading Company. The firm’s return-on-
sales ratio for 2017 is ________.
A) 0.0409
B) 0.0429
C) 0.0475
D) 0.0753
49
Copyright 2019 © McGraw-Hill Education. All rights reserved. No reproduction or distribution without the prior
written consent of McGraw-Hill Education.
Answer: B
Explanation: ROS = = 0.0429
Difficulty: 2 Medium
Topic: Ratio Analysis
Learning Objective: 14-03 Use ratio decomposition analysis to show how profitability depends
on efficient use of assets; profit margin; and leverage.
Bloom’s: Apply
AACSB: Analytical Thinking
Accessibility: Keyboard Navigation
50
47) The financial statements of Burnaby Mountain Trading Company are shown below.
Income Statement 2017
Sales
$
7,000,000
Cost of Goods Sold
5,000,000
Gross Profit
$
2,000,000
Selling and Administrative Expenses
1,700,000
EBIT
$
300,000
Interest Expense
50,000
Income before Tax
$
250,000
Taxes
100,000
Net Income
$
150,000
Burnaby Mountain Trading Company
Comparative Balance Sheets
2017
2016
Cash
$
90,000
$
80,000
Accounts Receivable
810,000
800,000
Inventory
800,000
720,000
Total Current Assets
$
1,700,000
$
1,600,000
Fixed Assets
2,600,000
2,400,000
Total Assets
$
4,300,000
$
4,000,000
Accounts Payable
$
500,000
$
400,000
Bank Loans
100,000
100,000
Total Current Liabilities
$
600,000
$
500,000
Long-term Bonds
400,000
300,000
Total Liabilities
$
1,000,000
$
800,000
Common Stock (200,000 shares)
500,000
500,000
Retainded Earnings
2,800,000
2,700,000
Total Equity
$
3,300,000
$
3,200,000
Total Liabilities and Equity
$
4,300,000
$
4,000,000
Note: The common shares are trading in the stock market for $27 each.
Refer to the financial statements of Burnaby Mountain Trading Company. The firm’s return-on-
equity ratio for 2017 is ________. (Please keep in mind that when a ratio involves both income
statement and balance sheet numbers, the balance sheet numbers for the beginning and end of the
year must be averaged.)
A) 0.0409
B) 0.0429
C) 0.0462
D) 0.0923

52
48) The financial statements of Burnaby Mountain Trading Company are shown below.
Income Statement 2017
Sales
$
7,000,000
Cost of Goods Sold
5,000,000
Gross Profit
$
2,000,000
Selling and Administrative Expenses
1,700,000
EBIT
$
300,000
Interest Expense
50,000
Income before Tax
$
250,000
Taxes
100,000
Net Income
$
150,000
Burnaby Mountain Trading Company
Comparative Balance Sheets
2017
2016
Cash
$
90,000
$
80,000
Accounts Receivable
810,000
800,000
Inventory
800,000
720,000
Total Current Assets
$
1,700,000
$
1,600,000
Fixed Assets
2,600,000
2,400,000
Total Assets
$
4,300,000
$
4,000,000
Accounts Payable
$
500,000
$
400,000
Bank Loans
100,000
100,000
Total Current Liabilities
$
600,000
$
500,000
Long-term Bonds
400,000
300,000
Total Liabilities
$
1,000,000
$
800,000
Common Stock (200,000 shares)
500,000
500,000
Retainded Earnings
2,800,000
2,700,000
Total Equity
$
3,300,000
$
3,200,000
Total Liabilities and Equity
$
4,300,000
$
4,000,000
Note: The common shares are trading in the stock market for $27 each.
Refer to the financial statements of Burnaby Mountain Trading Company. The firm’s P/E ratio
for 2017 is ________.
A) 2.8
B) 3.6
C) 6
D) 11.11
53
Copyright 2019 © McGraw-Hill Education. All rights reserved. No reproduction or distribution without the prior
written consent of McGraw-Hill Education.
Answer: B
Explanation: P/E = 27/(150,000/20,000) = 3.6
Difficulty: 2 Medium
Topic: Ratio Analysis
Learning Objective: 14-03 Use ratio decomposition analysis to show how profitability depends
on efficient use of assets; profit margin; and leverage.
Bloom’s: Apply
AACSB: Analytical Thinking
Accessibility: Keyboard Navigation
49) The financial statements of Burnaby Mountain Trading Company are shown below.
Income Statement 2017
Sales
$
7,000,000
Cost of Goods Sold
5,000,000
Gross Profit
$
2,000,000
Selling and Administrative Expenses
1,700,000
EBIT
$
300,000
Interest Expense
50,000
Income before Tax
$
250,000
Taxes
100,000
Net Income
$
150,000
Burnaby Mountain Trading Company
Comparative Balance Sheets
2017
2016
Cash
$
90,000
$
80,000
Accounts Receivable
810,000
800,000
Inventory
800,000
720,000
Total Current Assets
$
1,700,000
$
1,600,000
Fixed Assets
2,600,000
2,400,000
Total Assets
$
4,300,000
$
4,000,000
Accounts Payable
$
500,000
$
400,000
Bank Loans
100,000
100,000
Total Current Liabilities
$
600,000
$
500,000
Long-term Bonds
400,000
300,000
Total Liabilities
$
1,000,000
$
800,000
Common Stock (200,000 shares)
500,000
500,000
Retainded Earnings
2,800,000
2,700,000
Total Equity
$
3,300,000
$
3,200,000
Total Liabilities and Equity
$
4,300,000
$
4,000,000
Note: The common shares are trading in the stock market for $27 each.
Refer to the financial statements of Burnaby Mountain Trading Company. The firm’s market-to–
book value for 2017 is ________.
A) 0.1708
B) 0.1529
C) 0.1462
D) 0.1636
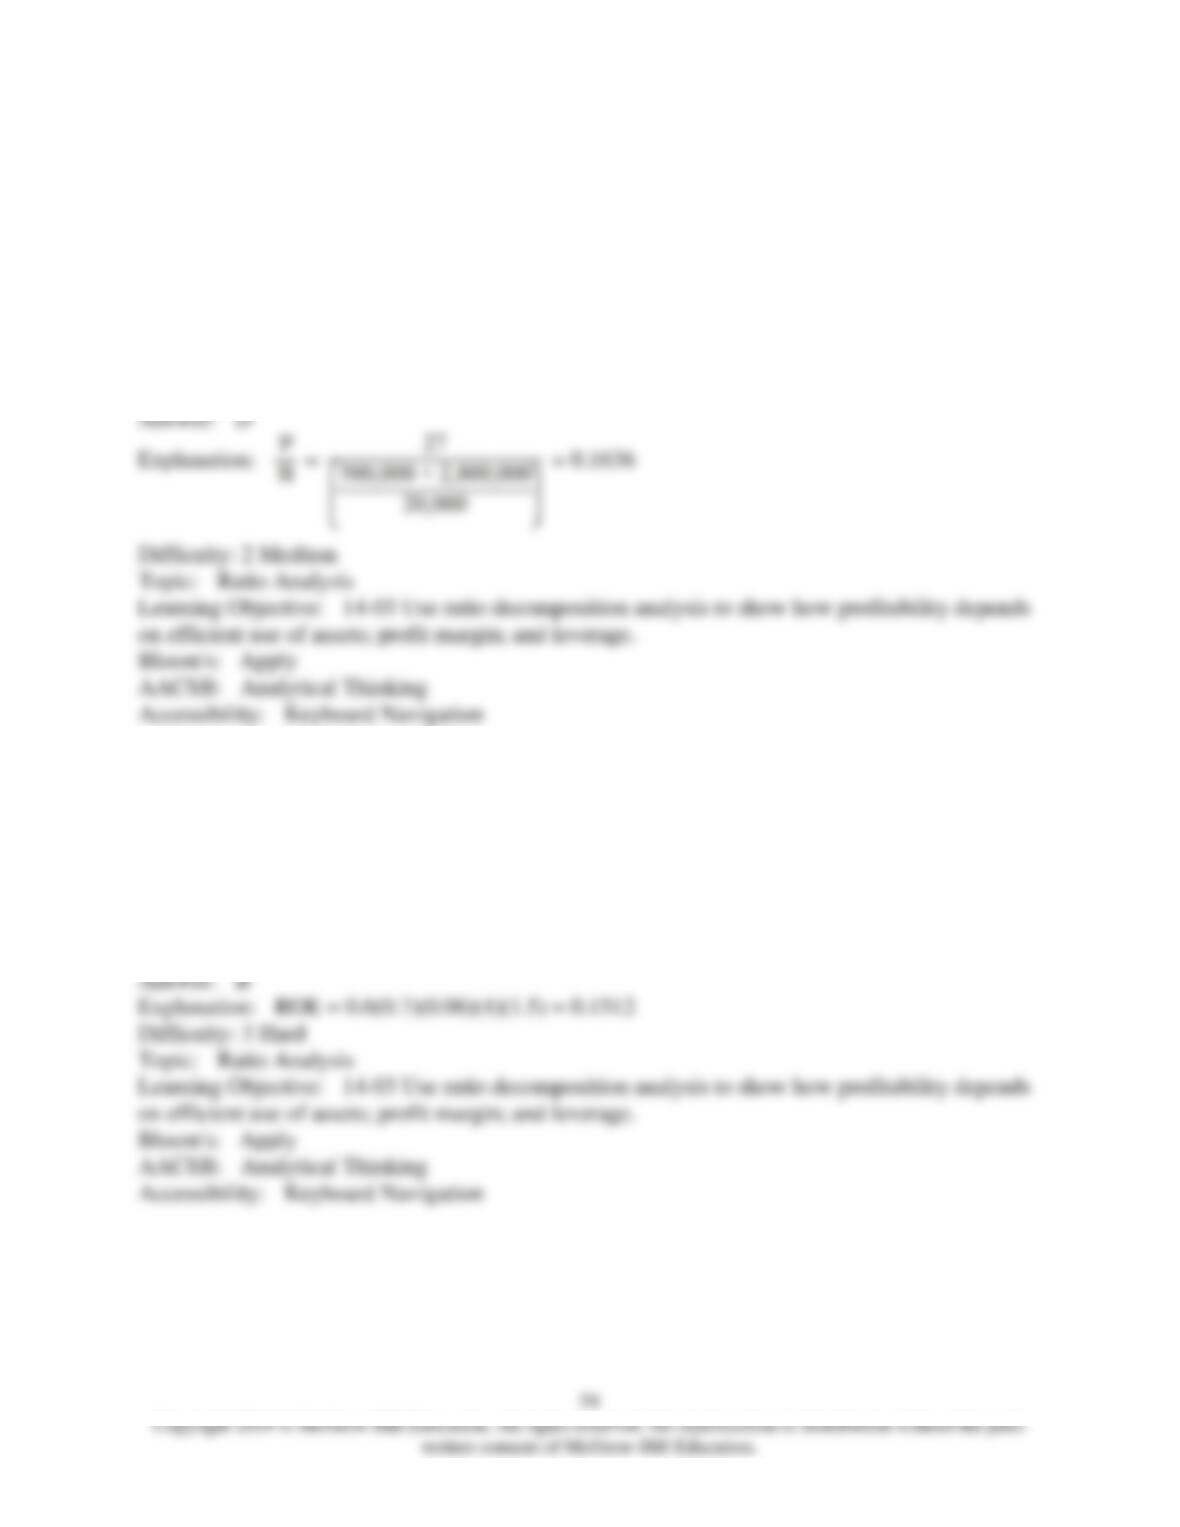
50) A firm has a net profit/pretax profit ratio of 0.6, a leverage ratio of 1.5, a pretax profit/EBIT
of 0.7, an asset turnover ratio of 4, a current ratio of 2, and a return-on-sales ratio of 6%. Its ROE
is ________.
A) 7.56%
B) 15.12%
C) 20.16%
D) 30.24%
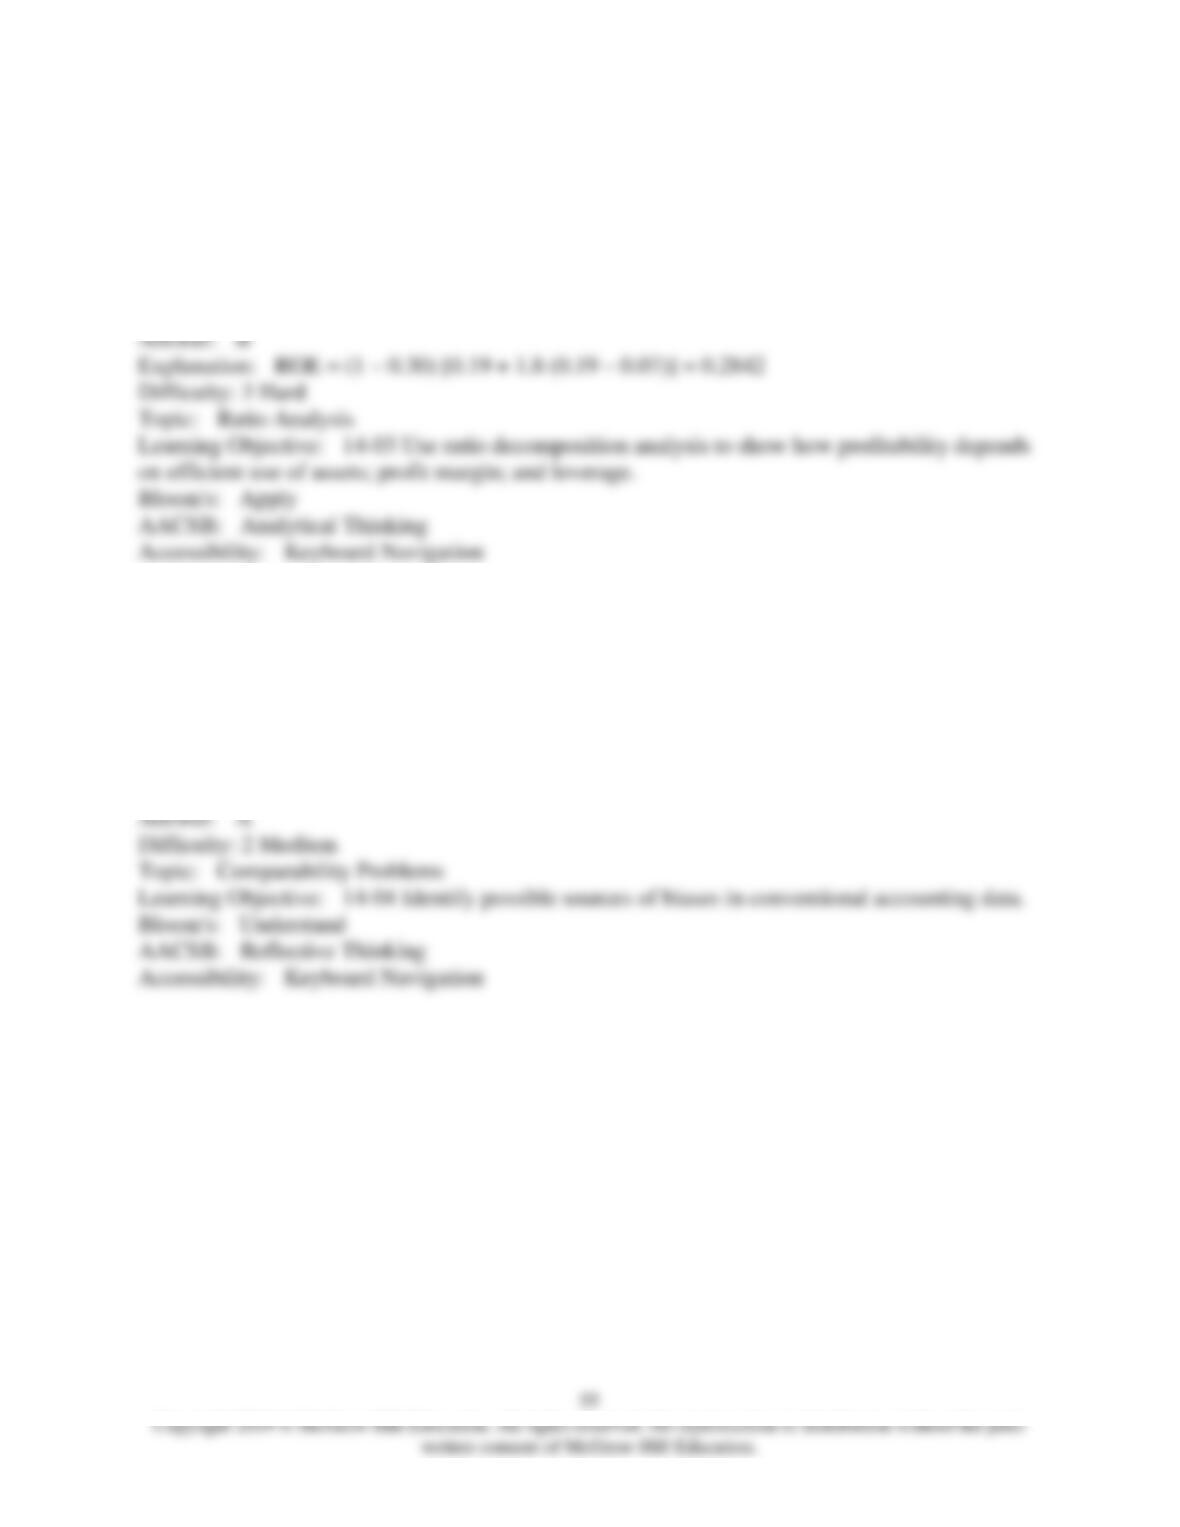
51) A firm has an ROA of 19%, a debt/equity ratio of 1.8, and a tax rate of 30%, and the interest
rate on its debt is 7%. Its ROE is ________.
A) 15.12%
B) 28.42%
C) 37.24%
D) 40.6%
52) The level of real income of a firm can be distorted by the reporting of depreciation and
interest expense. During periods of low inflation, the level of reported depreciation tends to
________ income, and the level of interest expense reported tends to ________ income.
A) understate; overstate
B) understate; understate
C) overstate; understate
D) overstate; overstate
53) If a firm’s ratio of stockholders’ equity/total assets is lower than the industry average and its
ratio of long-term debt/stockholders’ equity is also lower than the industry average, this would
suggest that the firm ________.
A) has more current liabilities than the industry average
B) has more leased assets than the industry average
C) will be less profitable than the industry average
D) has more current assets than the industry average
54) A firm has a lower inventory turnover, a longer ACP, and a lower fixed-asset turnover than
the industry averages. You should not be surprised to find that this firm has:
I. Lower ATO than the industry average
II. Lower ROA than the industry average
III. Lower ROE than the industry average
A) I only
B) I and II only
C) II and III only
D) I, II, and III
55) A high price-to-book ratio may indicate which one of the following?
A) The firm expanded its plant and equipment in the past few years.
B) The firm is doing a poorer job controlling its inventory expense than other related firms.
C) Investors may believe that this firm has opportunities for earning a rate of return in excess of
the market capitalization rate.
D) All of these options.
56) A firm has an ROE equal to the industry average, but its price-to-book ratio is below the
industry average. You know that the firm’s ________.
A) earnings yield is above the industry average
B) P/E ratio is above the industry average
C) dividend payout ratio is too high
D) interest burden must be below the industry average