194) Tim Marlow, the owner of The Clock Works, wanted to know how many clocks he must
sell in order to cover his fixed cost at a given price. Marlow knew that he had total fixed costs of
$20,000 for equipment, taxes, and a bank loan. He also had a unit variable cost of $20 per clock
for labor and materials. If the price Marlow charges for each of his clocks is $40, what is his
break-even point quantity?
A) 100 clocks
B) 334 clocks
C) 500 clocks
D) 1,000 clocks
E) 10,000 clocks
195) Ampro-Mag makes materials for safely controlling hazardous spills of all kinds. It sells
these items as a neutralizing kit priced at $100. The costs of the materials that go into each kit are
$45. It costs $5 in labor to assemble a kit. The company has monthly expenses of $1,000 for rent
and insurance, $200 for heat and electricity, $500 for advertising in trade journals, and $3,500
for the monthly salary of its owner. What is Ampro-Mag’s monthly break-even point in terms of
number of neutralizing kits sold?
A) 40 kits
B) 52 kits
C) 104 kits
D) 116 kits
E) 520 kits
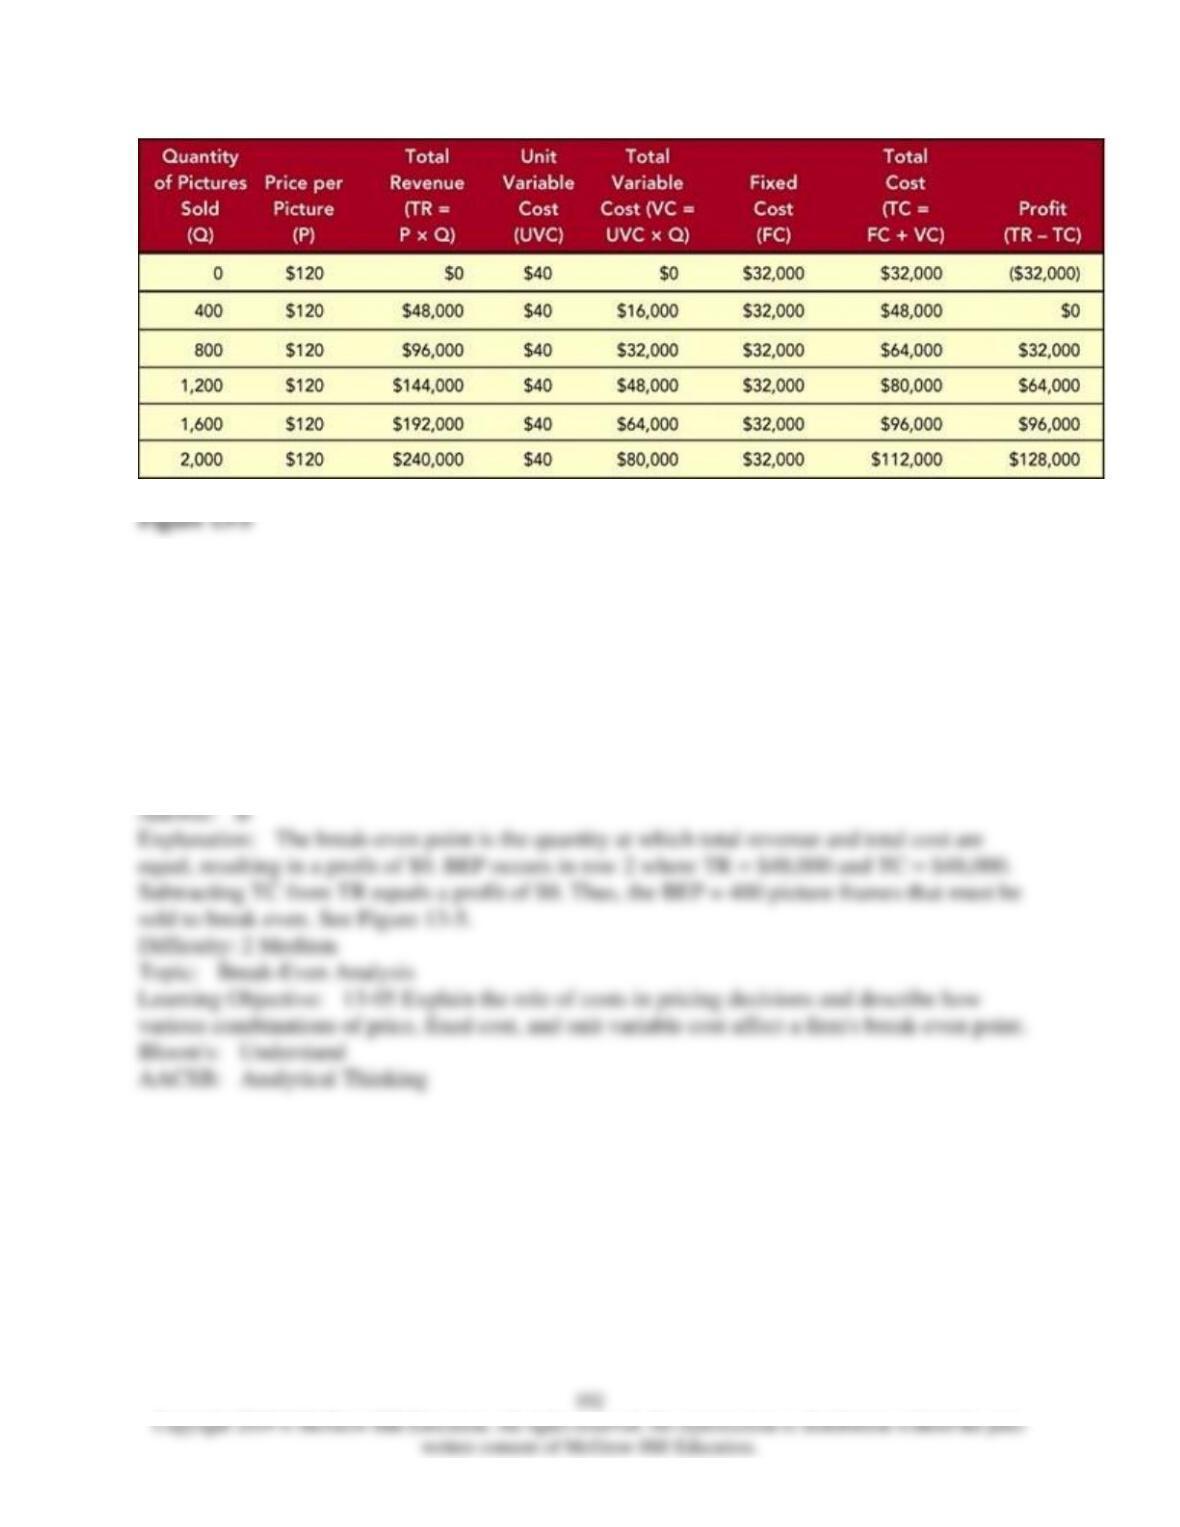
196) The owner of a picture frame store has generated a spreadsheet of several calculations
based on different quantity, price, revenue, cost, and profit scenarios shown in Figure 13-5
above. What is the break-even point quantity for her picture frame store?
A) 0
B) 400
C) 800
D) 1,200
E) 2,000
197) The owner of a picture frame store has generated a spreadsheet of several calculations
based on different quantity, price, revenue, cost, and profit scenarios shown in Figure 13-5
above. Of the following options, at what sales level is profit maximized?
A) 0
B) 400
C) 800
D) 1,200
E) 2,000
198) A graphic presentation of the break-even analysis that shows the intersection of total
revenue and total cost to identify profit or loss for a given quantity sold is referred to as a(n)
A) Gantt chart.
B) demand curve.
C) ROI analysis.
D) cross-tabulation.
E) break-even chart.
199) A break-even chart is a graphic presentation
A) that shows the maximum number of units that will be sold at a certain price.
B) of a break-even analysis that shows when total revenue and total cost intersect to identify
profit or loss for a given quantity sold.
C) that relates variable costs in terms of product or service substitutes in order to determine
which items or services would least affect total revenues.
D) that relates profits and revenues versus total costs in order to determine the time frame in
which a company could achieve profitability.
E) is a form of scatter graph used to identify specific activities or items that are creating the
greatest return on investment.
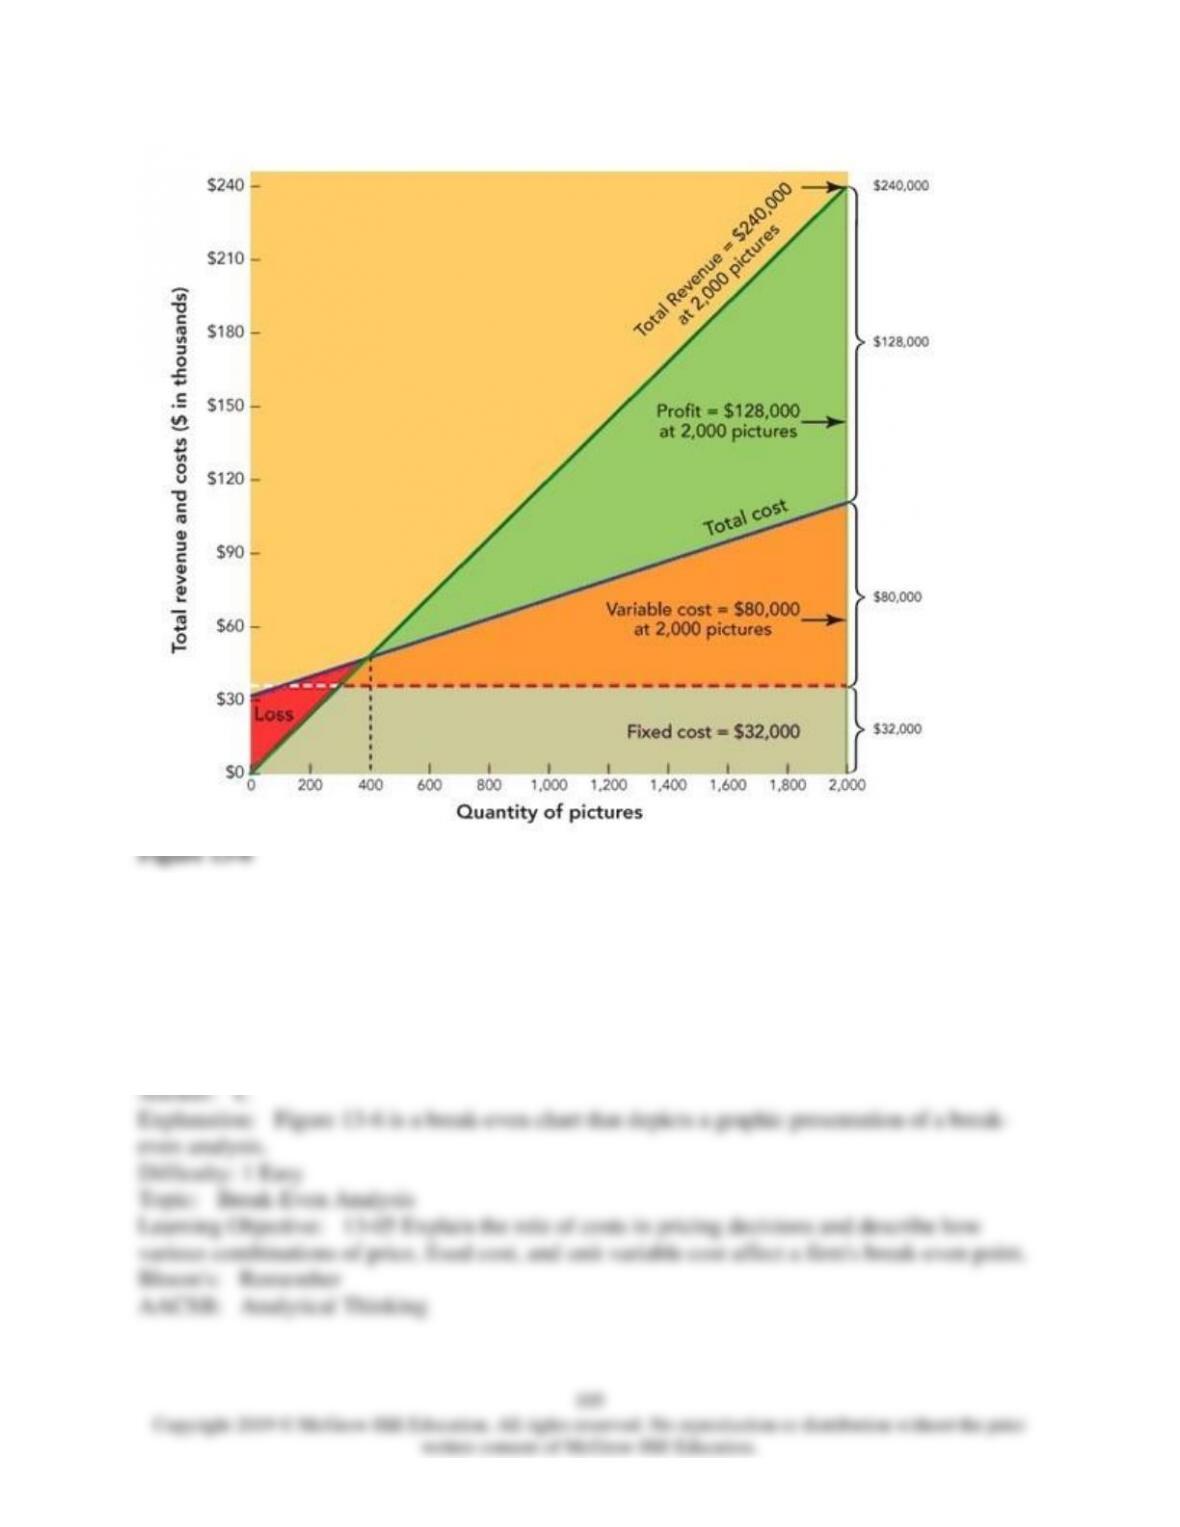
200) Figure 13-6 above depicts a
A) Gantt chart.
B) demand curve.
C) break-even chart.
D) ROI analysis.
E) cross-tabulation.
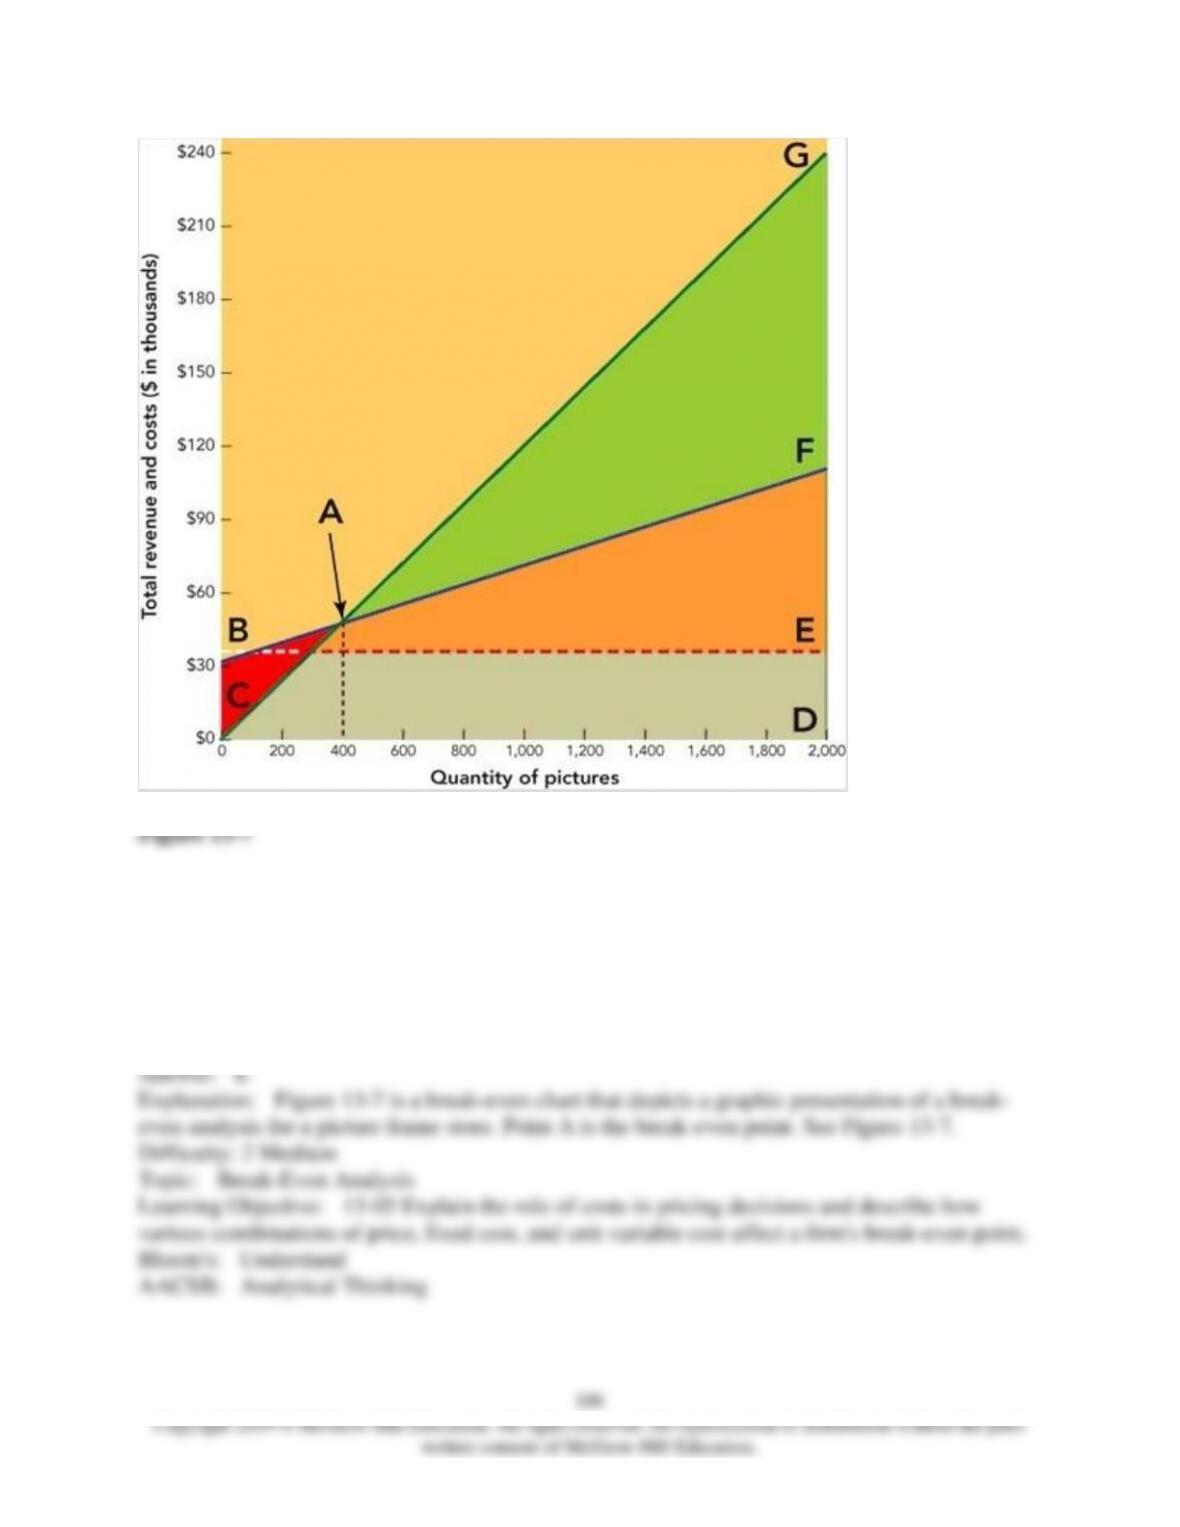
201) In the break-even chart in Figure 13-7 above, point A identifies the firm’s ________ point.
A) loss
B) price
C) margin
D) profit
E) break-even
202) In the break-even chart in Figure 13-7 above, the wedge ABC represents the firm’s
A) fixed costs.
B) break-even point.
C) loss.
D) profit.
E) total revenue.
203) In the break-even chart in Figure 13-7 above, the rectangular area EBCD represents the
firm’s
A) fixed costs.
B) break-even point.
C) variable costs.
D) profit.
E) total revenue.
204) In the break-even chart in Figure 13-7 above, the triangular area FBE represents the firm’s
A) fixed costs.
B) break-even point.
C) variable costs.
D) profit.
E) total revenue.
205) In the break-even chart in Figure 13-7 above, the triangular area GAF represents the firm’s
A) fixed costs.
B) break-even point.
C) variable costs.
D) profit.
E) total revenue.
206) In the break-even chart in Figure 13-7 above, the line CG represents the firm’s
A) fixed costs.
B) break-even point.
C) variable costs.
D) profit.
E) total revenue.
207) The break-even chart for a picture frame store in Figure 13-7 above shows that by selling
200 pictures, the store will
A) break even.
B) earn a profit.
C) incur a loss.
D) have no fixed costs.
E) have no variable costs.
208) Suppose you are the owner of a picture frame store. Assume that the average price
customers are willing to pay for each picture frame is $120. Also, suppose your fixed costs (FC)
total $32,000 (real estate taxes, interest on a bank loan, etc.) and unit variable cost (UVC) for a
picture frame is $40 (labor, glass, frame, and matting). According to Figure 13-7 above, how
much profit will your picture frame store make if it sells 400 picture frames?
A) $48,000
B) $32,000
C) $16,000
D) $0
E) ($32,000)
209) The break-even chart for a picture frame store in Figure 13-7 above shows that by selling
800 pictures, the store will
A) break even.
B) earn a profit.
C) incur a loss.
D) have no fixed costs.
E) have no variable costs.
210) Suppose you are the owner of a picture frame store and you wish to calculate how many
pictures you must sell to cover your fixed and variable costs at a given price. Demand for
pictures is strong, so the average price customers are willing to pay for each picture frame is
$120. Also, suppose your fixed costs (FC) total $32,000 (real estate taxes, interest on a bank
loan, etc.) and unit variable cost (UVC) for a picture frame is $40 (labor, glass, frame, and
matting). What is the quantity of picture frames you will need to sell to break even?
A) 200 picture frames
B) 400 picture frames
C) 800 picture frames
D) 1,600 picture frames
E) 2,000 picture frames
211) Suppose you are the owner of a picture frame store and you wish to calculate how many
frames you must sell to cover your fixed and variable costs at a given price. Let’s assume that the
demand for your frames is strong, so the average price customers are willing to pay for each
picture frame is $120. Also, suppose your fixed costs (FC) total $32,000 (real estate taxes,
interest on a bank loan, etc.) and unit variable cost (UVC) for a picture frame is $40 (labor, glass,
frame, and matting). If your picture frame store sold 2,000 picture frames, what would your
profit (or loss) be?
A) a loss of $32,000
B) $0
C) $32,000 profit
D) $112,000 profit
E) $128,000 profit