40–21
Copyright © 2018 McGraw-Hill Education. All rights reserved. No reproduction or distribution without the prior
written consent of McGraw-Hill Education.
Topic:
The Economic Basis for Trade
37. The primary gain from international trade is
38.
The production possibilities curves suggest that
40–22
Copyright © 2018 McGraw-Hill Education. All rights reserved. No reproduction or distribution without the prior
written consent of McGraw-Hill Education.
and trade add to a nations output.
Test Bank: I
T o pi c : The Economic Basis for Trade
Type: Graph
39.
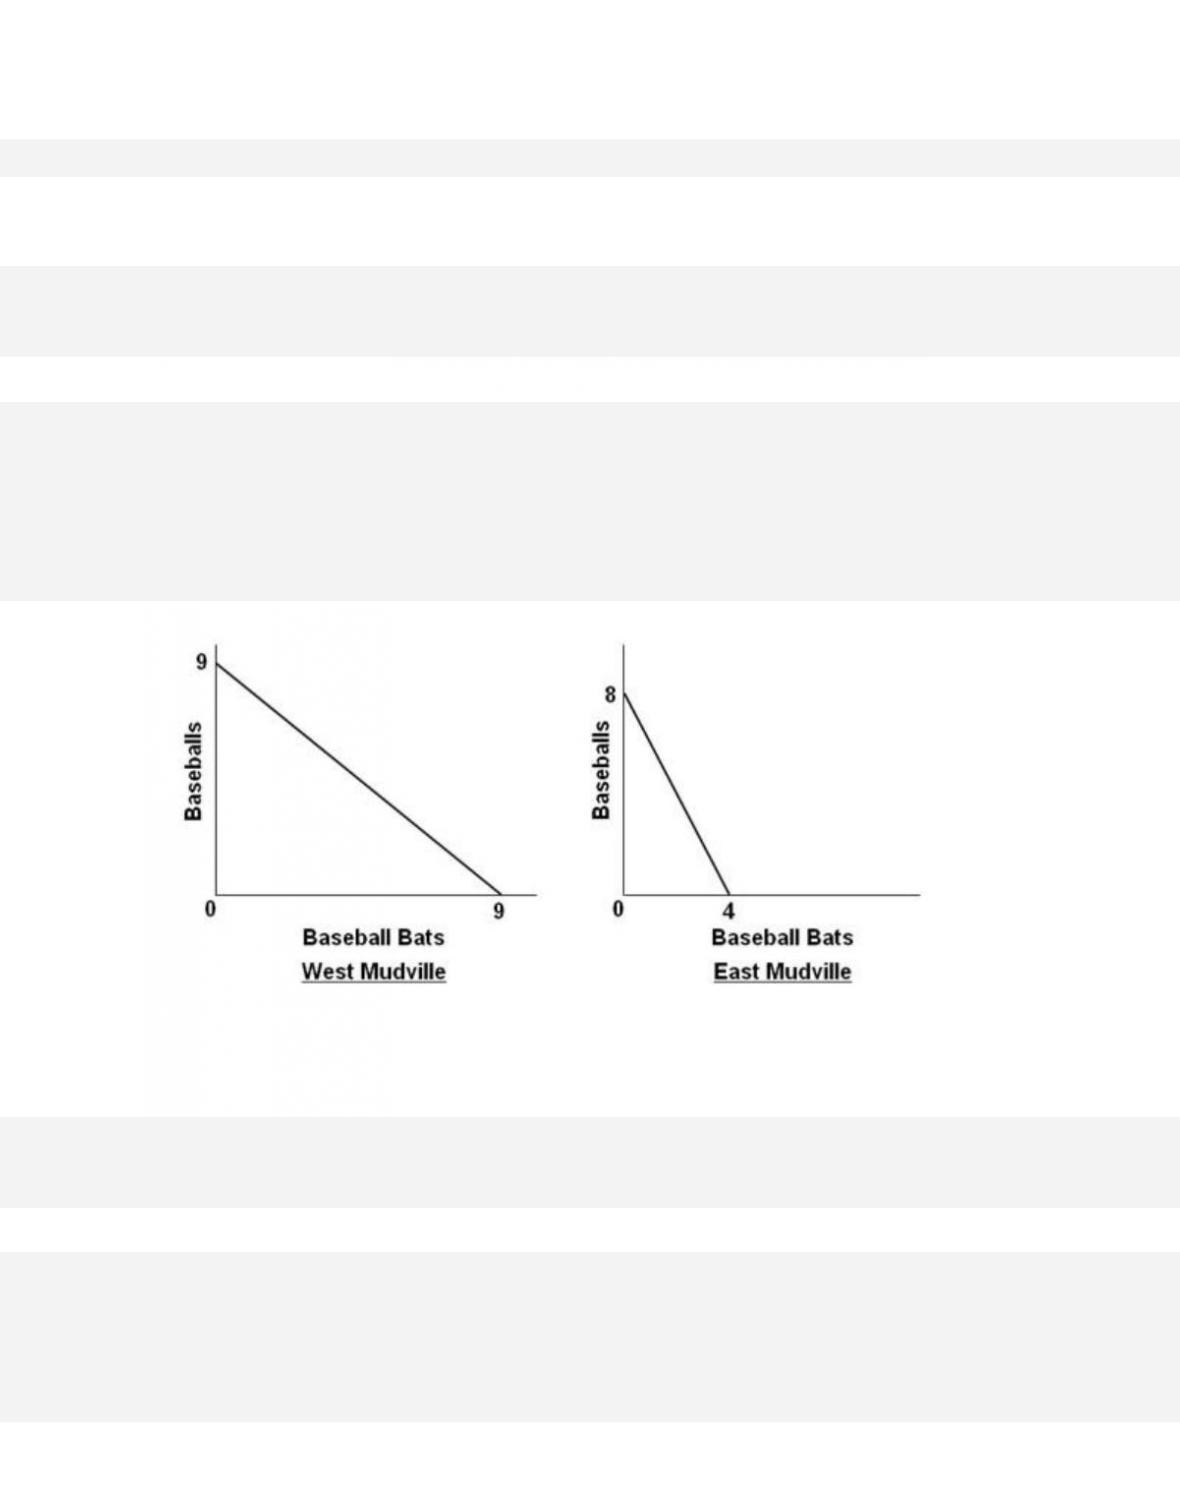
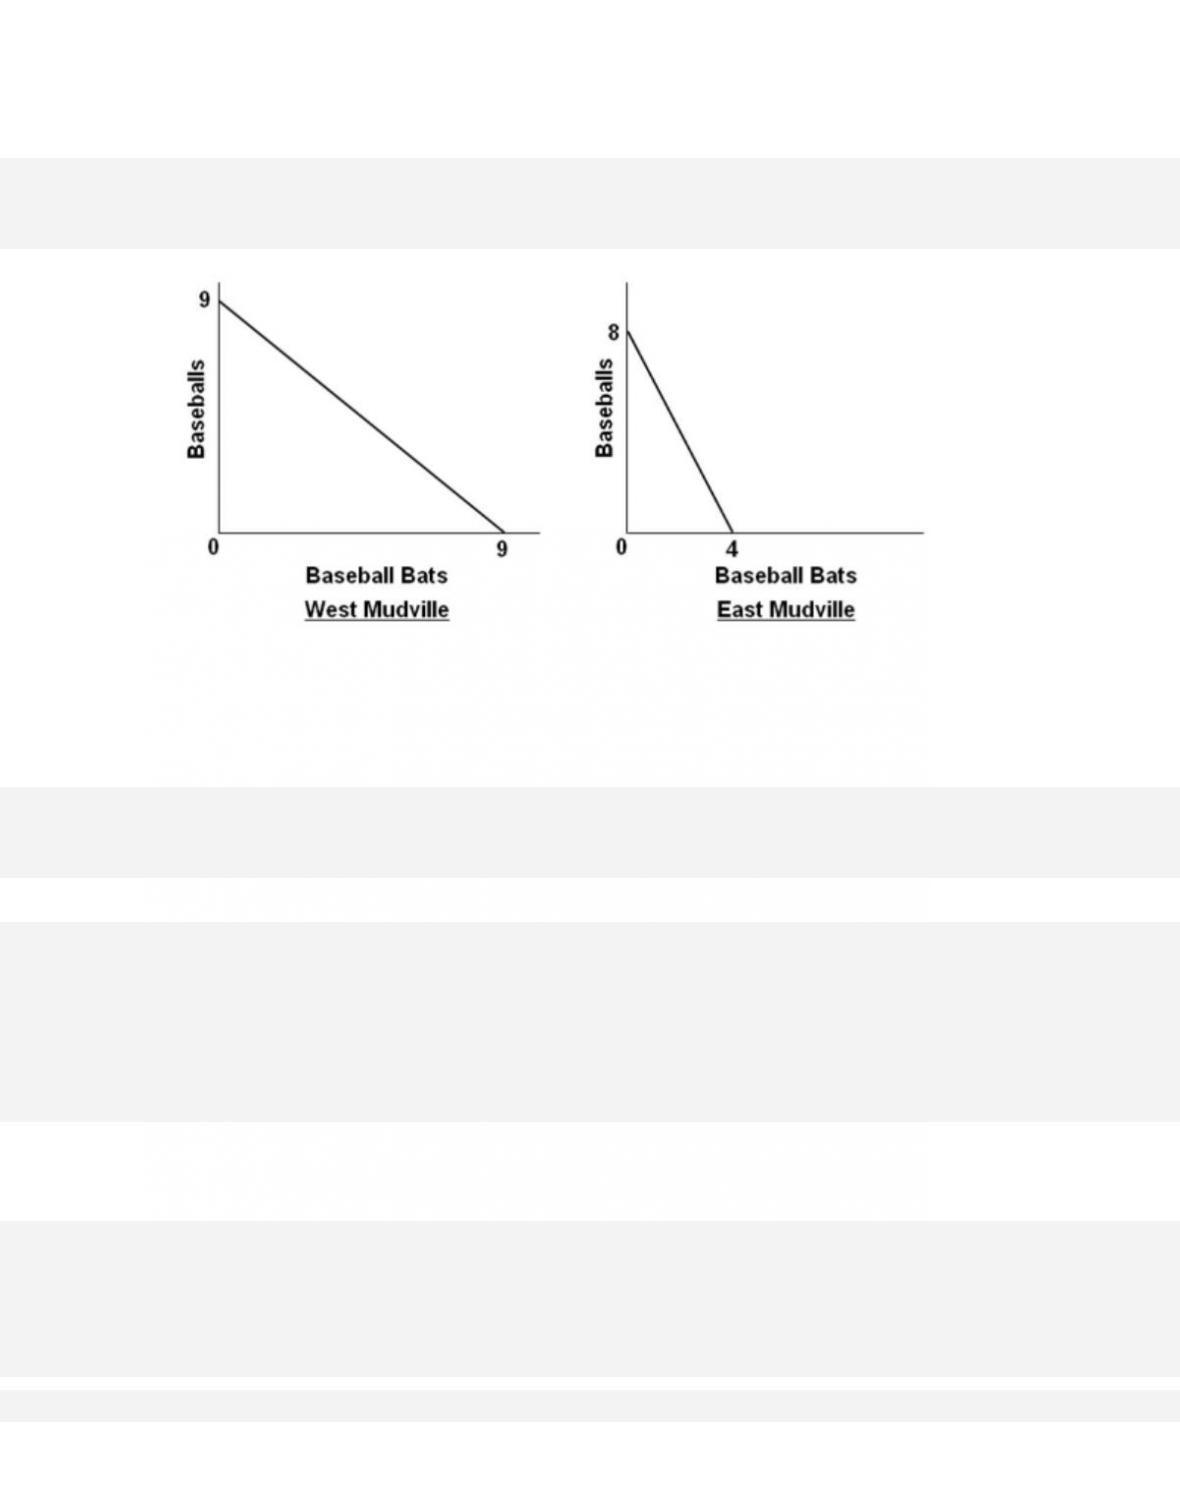
Assuming labor forces of equal size, the production possibilities curves suggest that
workers in West Mudville will have
40. If a nation has a comparative advantage in the production of X, this means the nation
40–23
Copyright © 2018 McGraw-Hill Education. All rights reserved. No reproduction or distribution without the prior
written consent of McGraw-Hill Education.
AACSB: Knowledge Application
A c c e s s i bi l i t y:
Keyboard Navigation
Blooms: Remember
Diffic u l t y : 01 Easy
Learning Objective: 40-02 Define comparative advantage, and demonstrate how specialization
and trade add to a nations output.
Test Bank: I
T o pi c : The Economic Basis for Trade
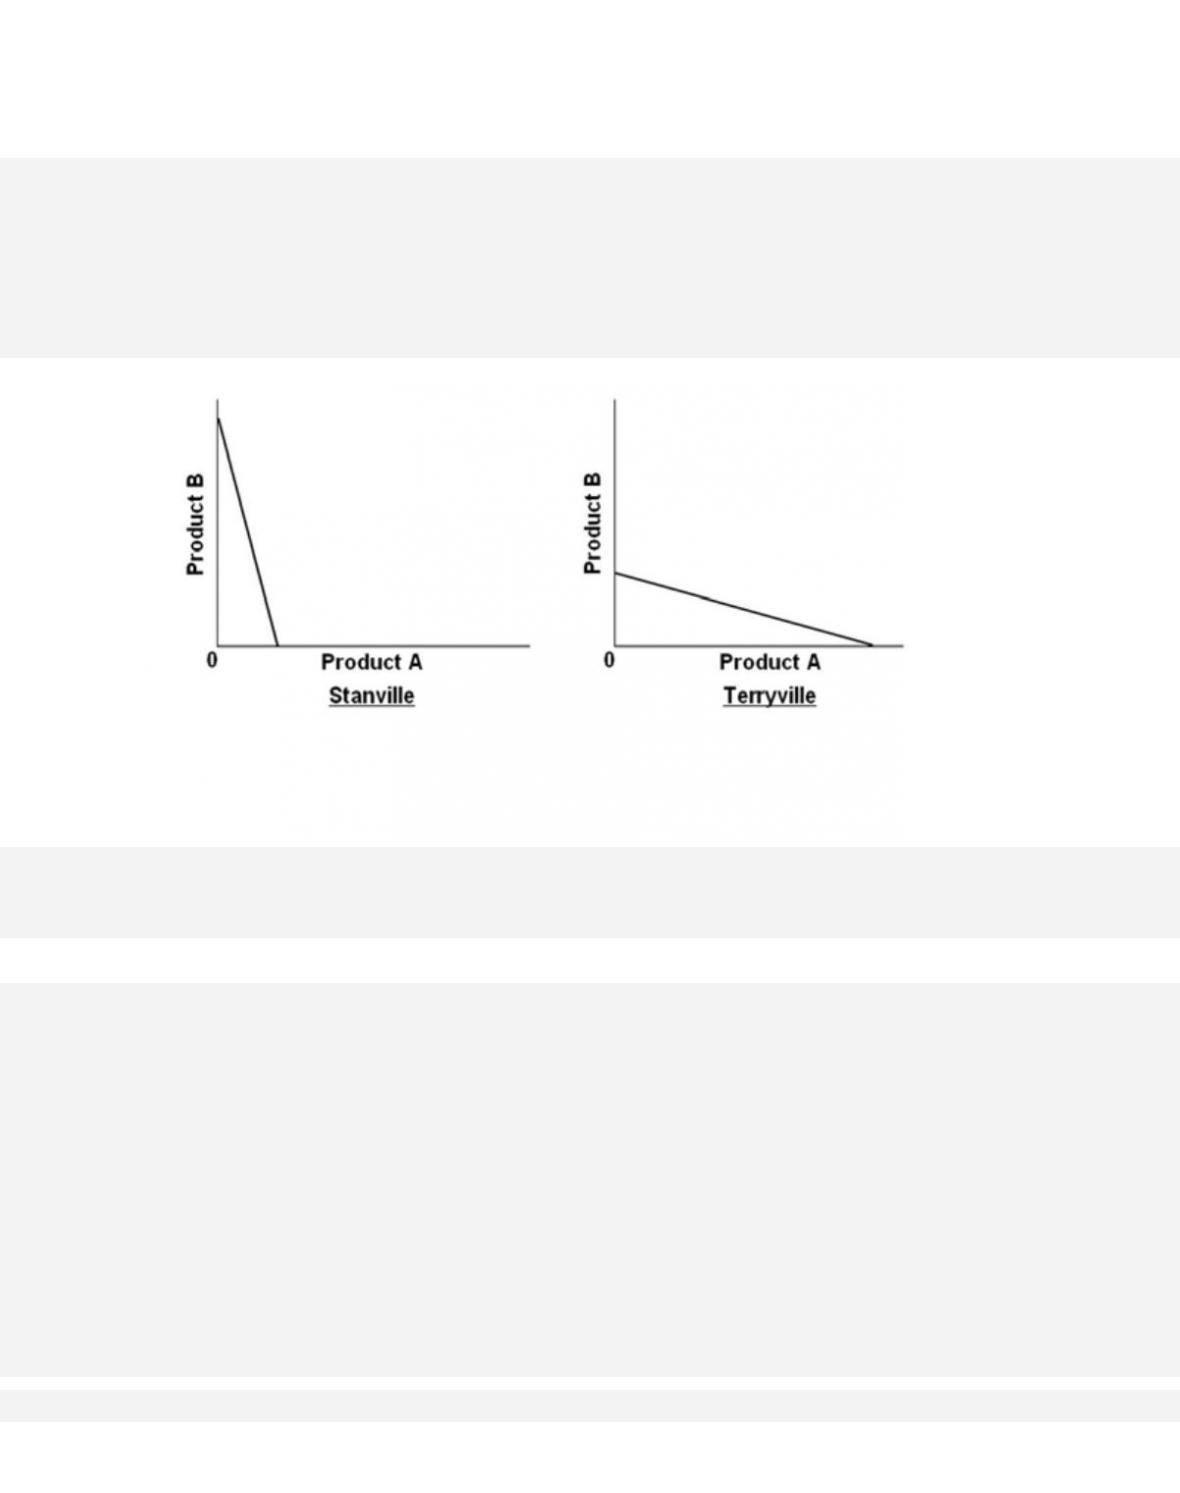
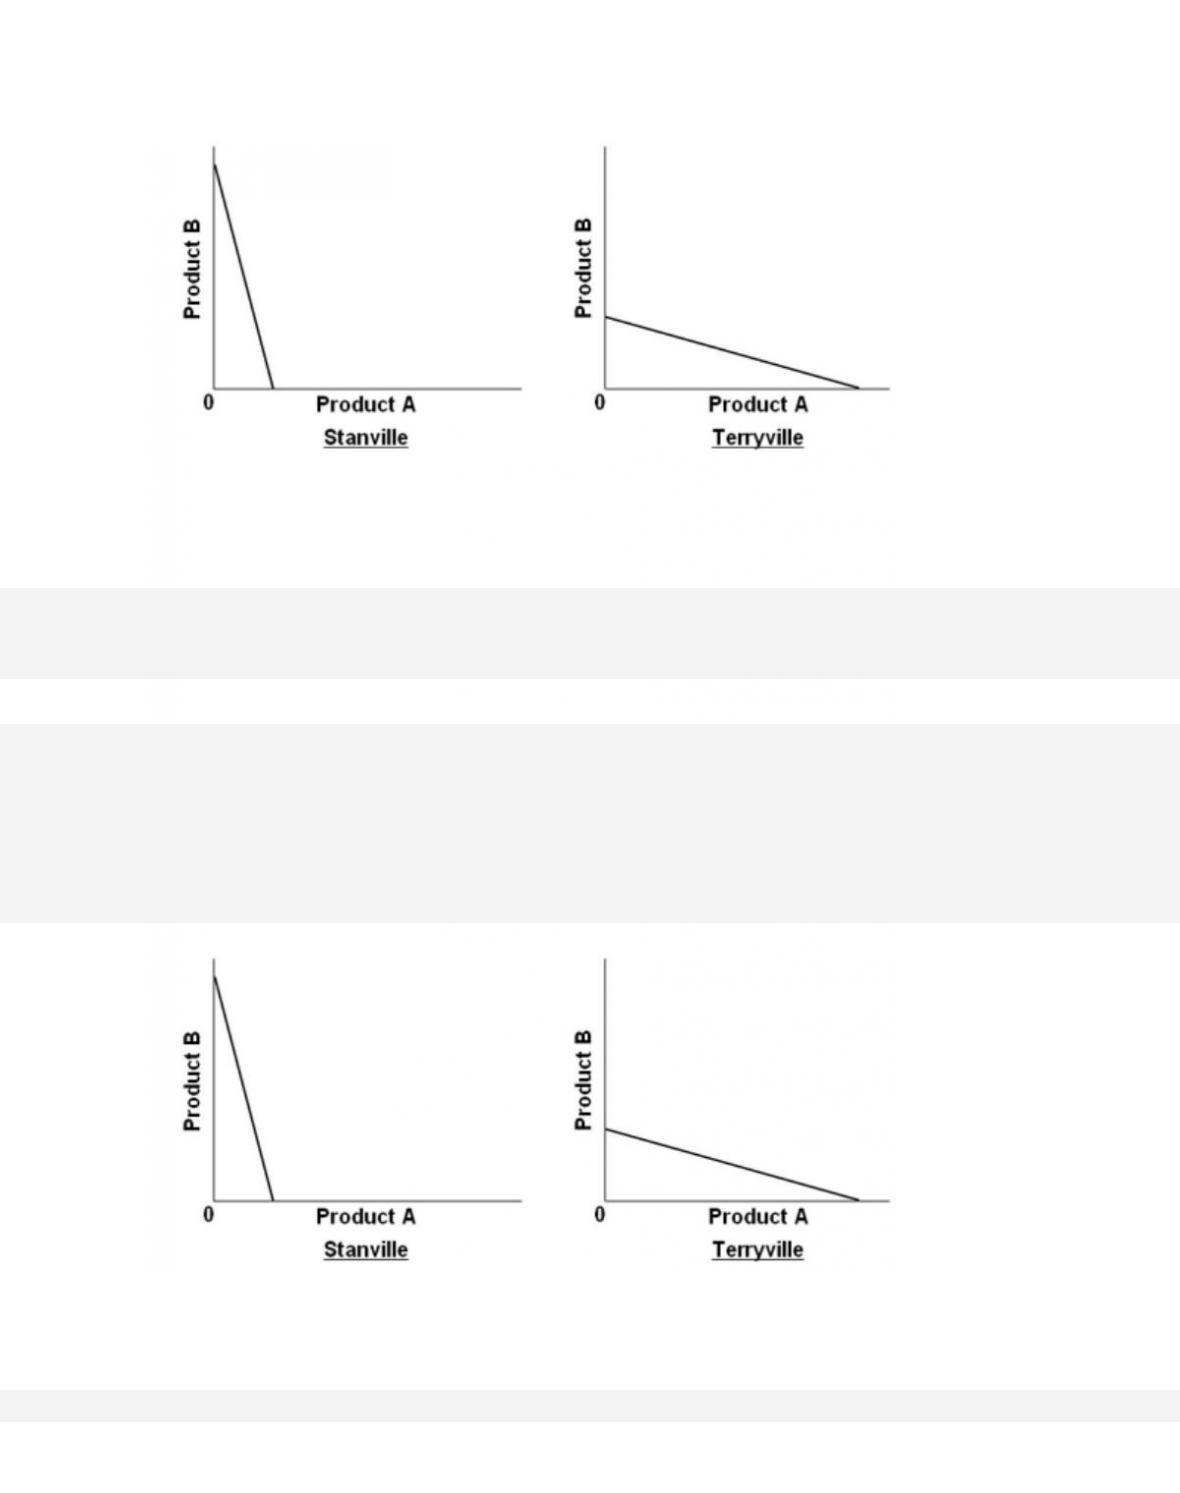
41.
Refer to the graphs. Stanville has a comparative advantage in producing
40–24
42.
Refer to the graphs. Terryville has a comparative advantage in producing
43.

Refer to the graphs. These production possibilities curves
44. The tables give production possibilities data for two countries, Alpha and Beta, which
have populations of equal size.
Alpha‘s production possibilities
A
B
C
D
E
Fish (Tons)
80
60
40
20
0
Chips (Tons)
0
5
10
15
20
Beta’s production possibilities
A
B
C
D
E
Fish (Tons)
240
180
120
60
0
Chips (Tons)
0
10
20
30
40
The given data show that

40–26
Copyright © 2018 McGraw-Hill Education. All rights reserved. No reproduction or distribution without the prior
written consent of McGraw-Hill Education.
and trade add to a nations output.
Test Bank: I
Topic:
The Economic Basis for Trade
Type: Table
45. The tables give production possibilities data for two countries, Alpha and Beta, which
have populations of equal size.
Alpha‘s production possibilities
A
B
C
D
E
Fish (Tons)
80
60
40
20
0
Chips (Tons)
0
5
10
15
20
Beta’s production possibilities
A
B
C
D
E
Fish (Tons)
240
180
120
60
0
Chips (Tons)
0
10
20
30
40
The domestic opportunity cost of
46.
Alpha’s production possibilities
A
B
C
D
E
Fish (Tons)
80
60
40
20
0
Chips (Tons)
0
5
10
15
20

40–27
Beta’s production possibilities
A
B
C
D
E
Fish (Tons)
240
180
120
60
0
Chips
(Tons)
0
10
20
30
40
The tables give production possibilities data for two countries, Alpha and Beta, which have
populations of equal size. Beta
47. The tables give production possibilities data for two countries, Alpha and Beta, which
have populations of equal size.
Alpha‘s production possibilities
A
B
C
D
E
Fish (Tons)
80
60
40
20
0
Chips (Tons)
0
5
10
15
20
Beta’s production possibilities
A
B
C
D
E
Fish (Tons)
240
180
120
60
0
Chips (Tons)
0
10
20
30
40
Suppose that before specialization and trade, Alpha chose production alternative C and
Beta chose production alternative B. After specialization and trade, the gains will be

48. The tables give production possibilities data for two countries, Alpha and Beta, which
have populations of equal size.
Alpha‘s production possibilities
A
B
C
D
E
Fish (Tons)
80
60
40
20
0
Chips (Tons)
0
5
10
15
20
Beta’s production possibilities
A
B
C
D
E
Fish (Tons)
240
180
120
60
0
Chips (Tons)
0
10
20
30
40
Assume the production possibilities in Beta double at alternatives A through E, while
40–29
Copyright © 2018 McGraw-Hill Education. All rights reserved. No reproduction or distribution without the prior
written consent of McGraw-Hill Education.
Test Bank: I
Topic:
The Economic Basis for Trade
Type: Table
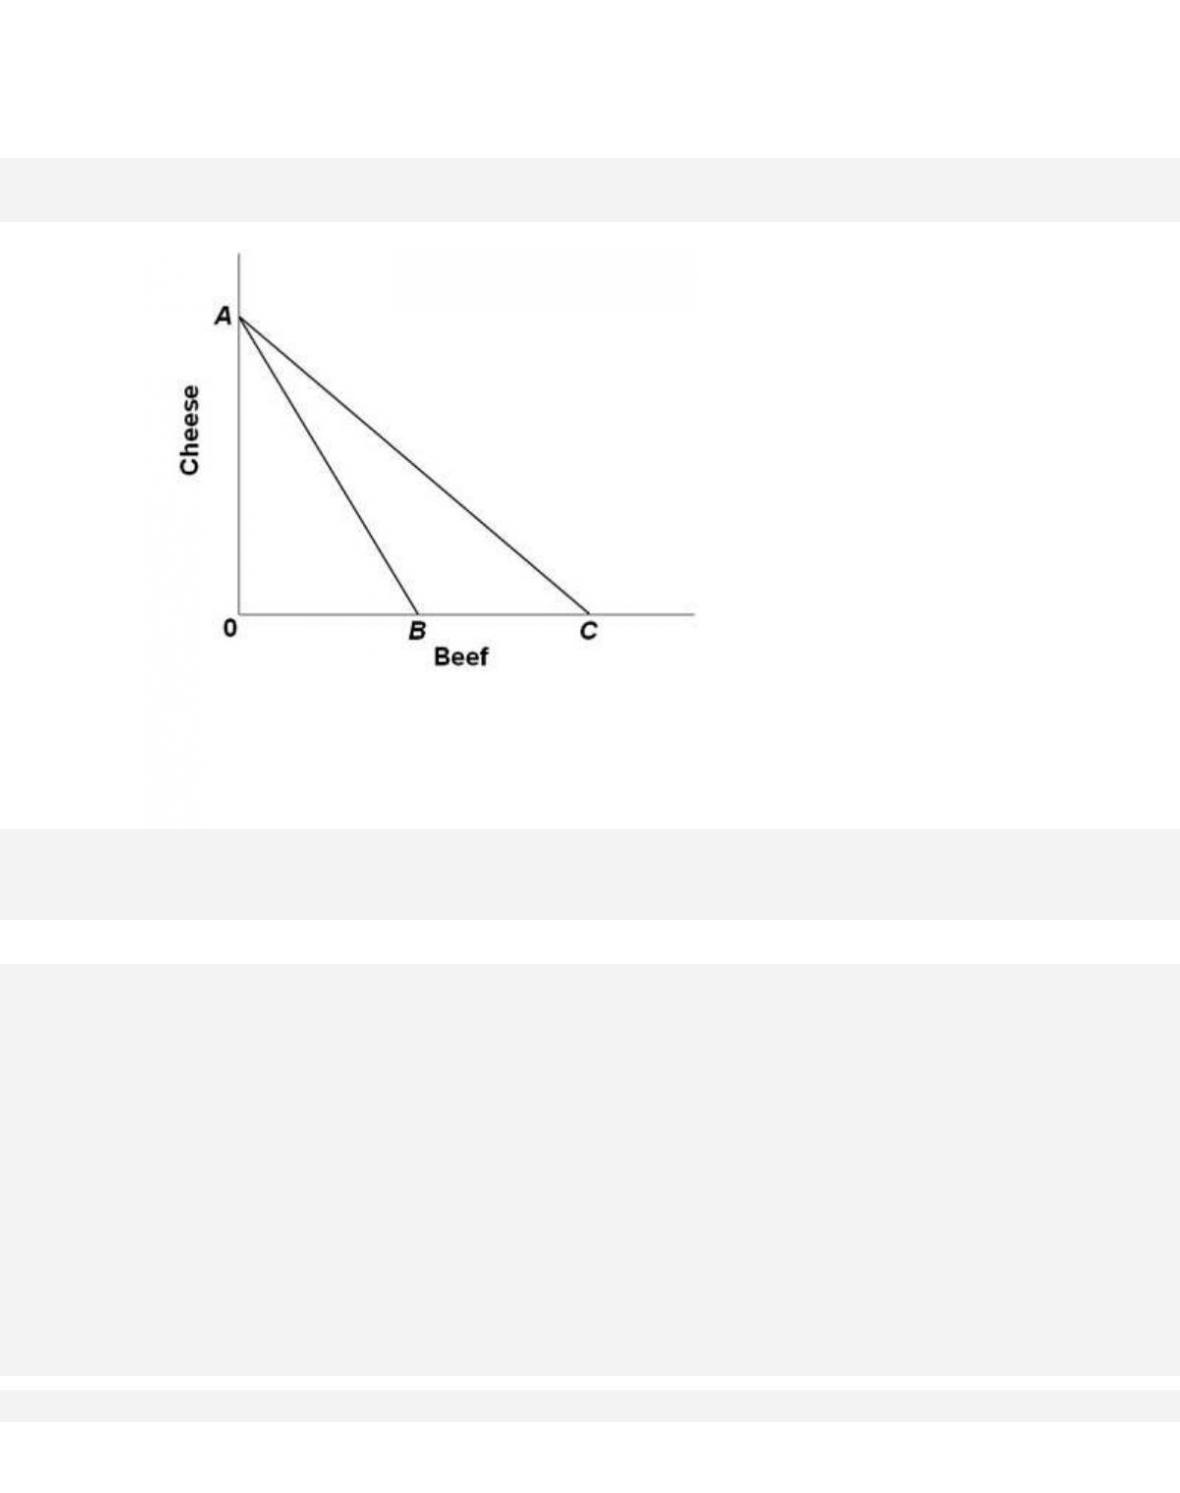
49.
Refer to the given diagram, in which line AB is the U.S. production possibilities curve and
AC is its trading possibilities curve. We can conclude that the United States
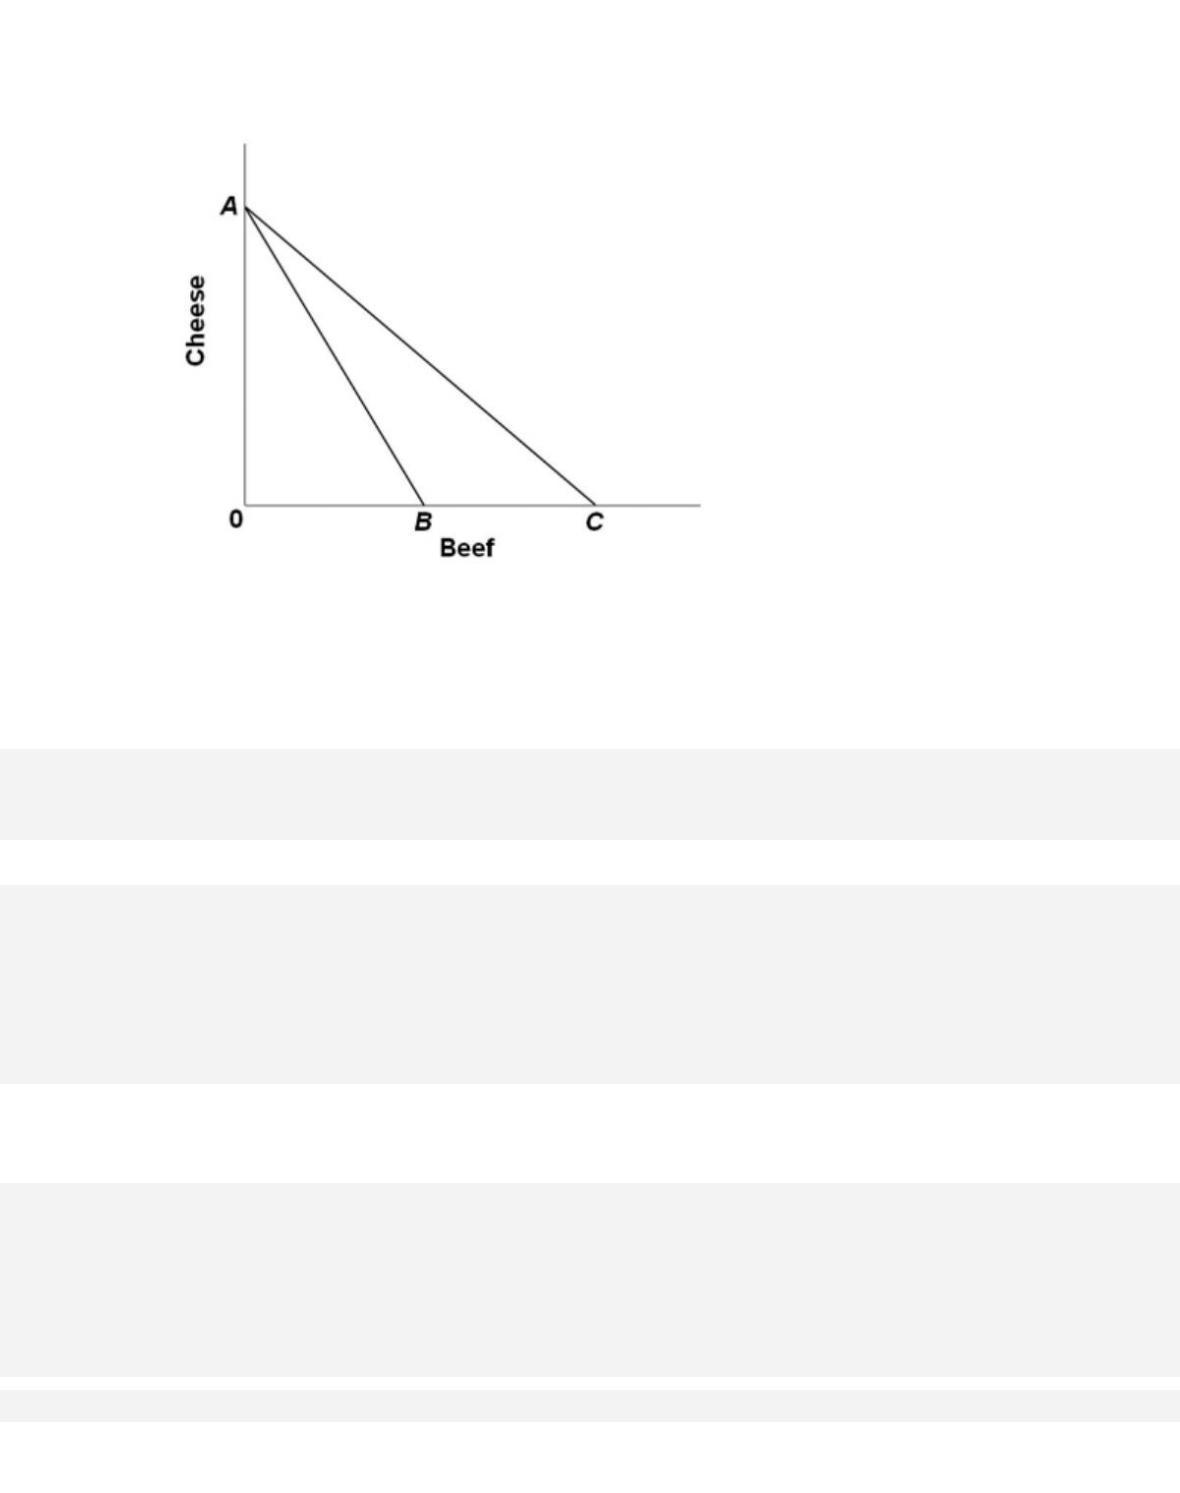
50.
Refer to the given diagram, in which line AB is the U.S. production possibilities curve and
AC is its trading possibilities curve. The international exchange ratio between beef and
cheese (terms of trade)
51. The impact of increasing, as opposed to constant, costs is to

40–31
Copyright © 2018 McGraw-Hill Education. All rights reserved. No reproduction or distribution without the prior
written consent of McGraw-Hill Education.
AACSB: Knowledge Application
A c c e s s i b i l i t y : Keyboard Navigation
Blooms: Remember
Difficulty:
01 Easy
Learning Objective: 40-02 Define comparative advantage, and demonstrate how specialization
and trade add to a nations output.
Test Bank: I
Topic:
The Economic Basis for Trade
52. In the real world, specialization is rarely complete because
53. The law of increasing opportunity costs

54. Suppose the domestic price (no-international-trade price) of copper is $1.20 a pound in
the United States while the world price is $1.00 a pound. Assuming no transportation costs,
the United States will
55. Suppose the domestic price (no-international-trade price) of wheat is $3.50 a bushel in
the United States while the world price is $4.00 a bushel. Assuming no transportation
costs, the United States will
56. A nation’s import demand curve for a specific product

40–33
Copyright © 2018 McGraw-Hill Education. All rights reserved. No reproduction or distribution without the prior
written consent of McGraw-Hill Education.
AACSB: Knowledge Application
A c c e s s i bi l i t y:
Keyboard Navigation
Blooms: Understand
Difficulty: 02 Medium
Learning Objective: 40-03 Describe how differences between world prices and domestic prices
prompt exports and imports.
Test Bank: I
T o pi c : Supply and Demand Analysis of Exports and Imports
57. A nation’s export supply curve for a specific product
58. A nation will neither export nor import a specific product when its
59. Export supply curves are ; import demand curves are .
40–34
Copyright © 2018 McGraw-Hill Education. All rights reserved. No reproduction or distribution without the prior
written consent of McGraw-Hill Education.
B. vertical; horizontal
C. downsloping; upsloping
D.
upsloping; downsloping
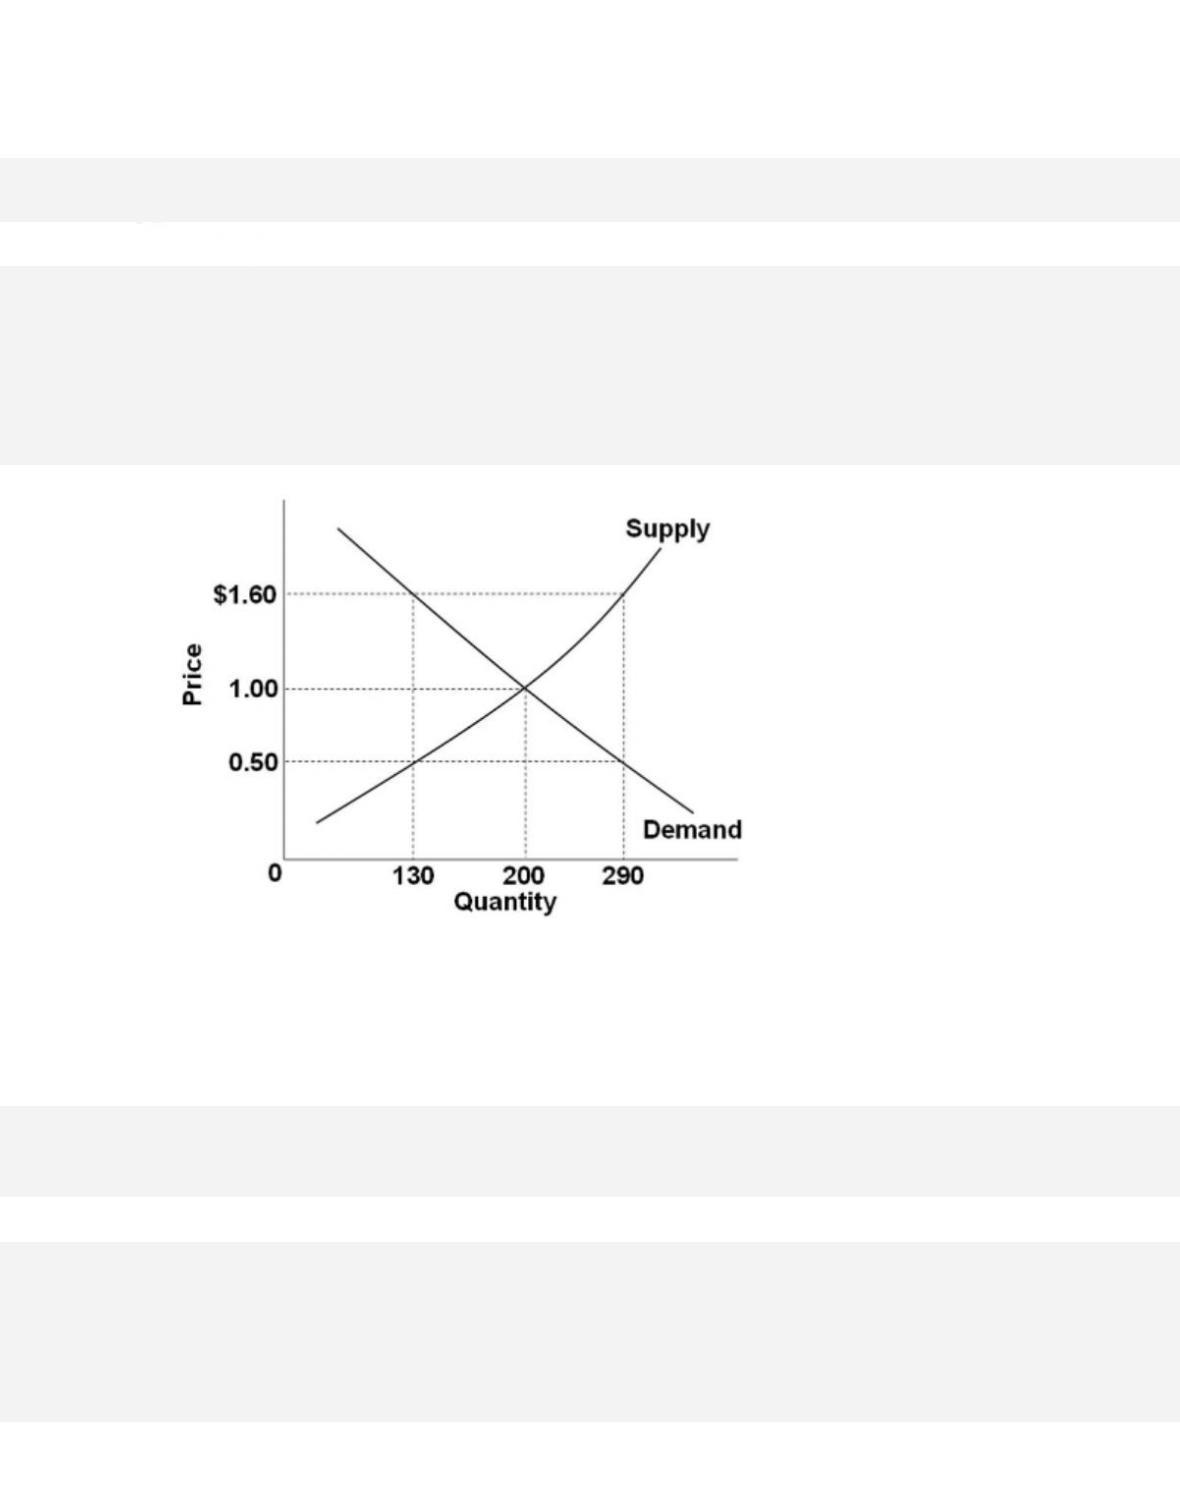
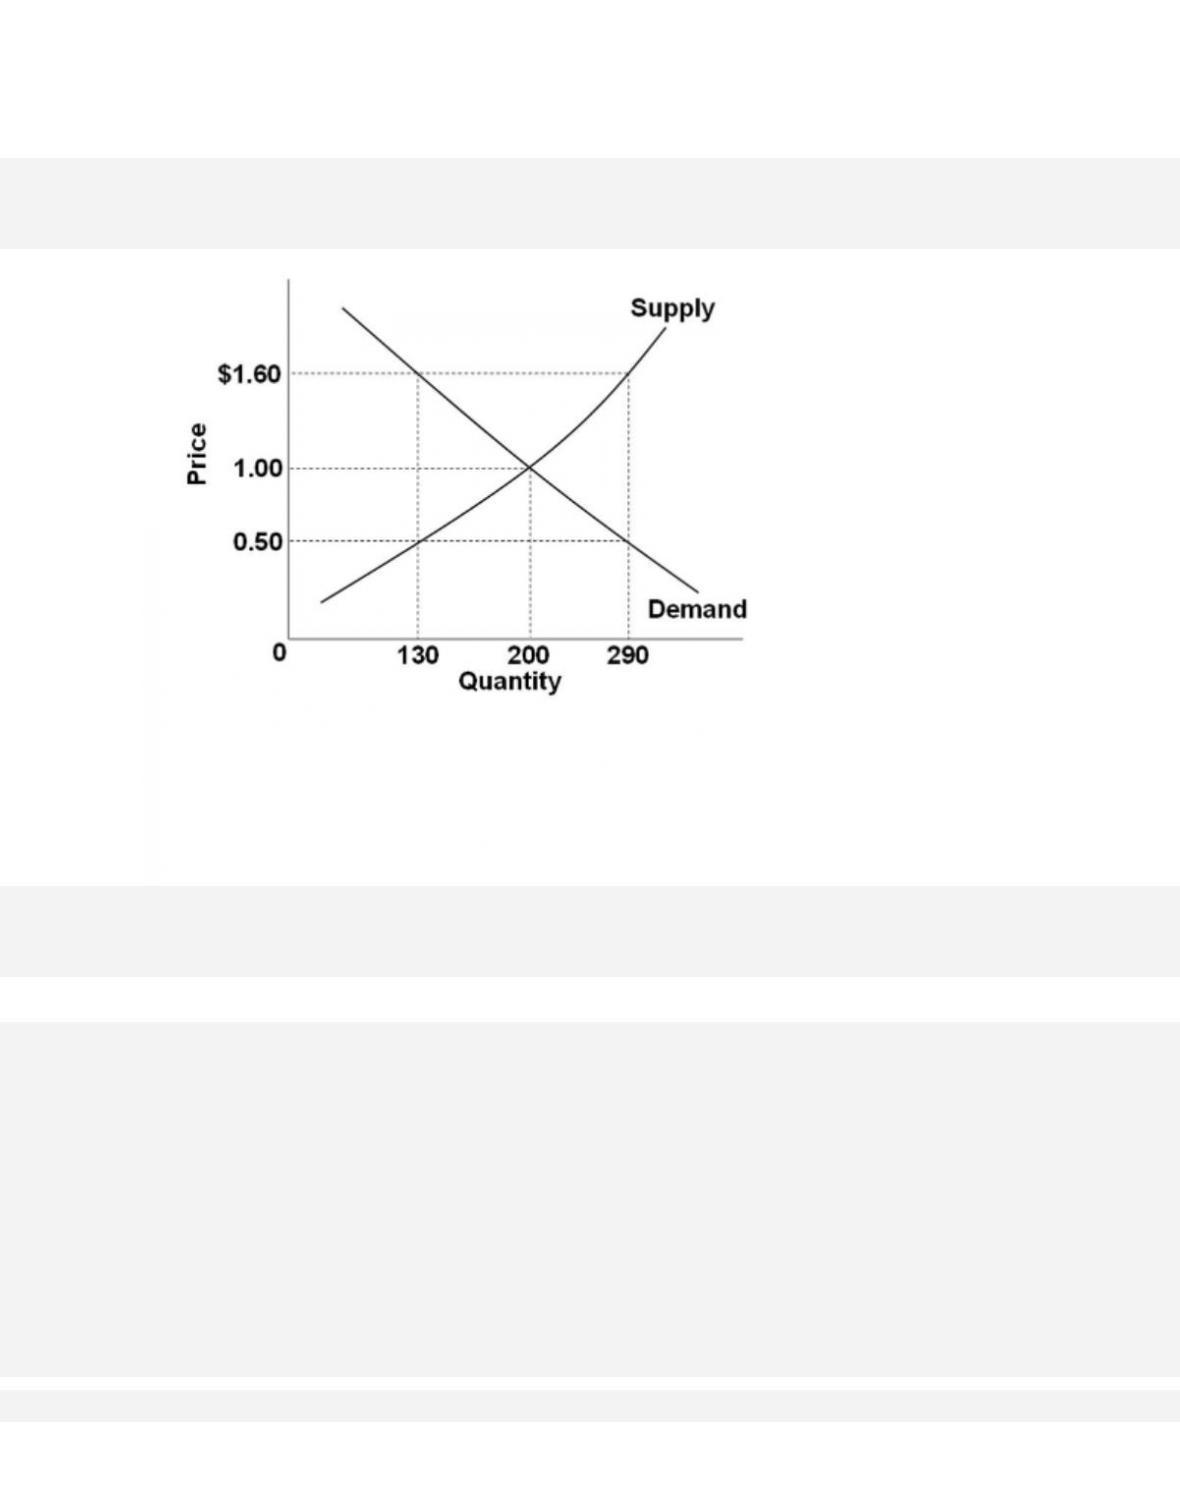
60.
Refer to the diagram, which shows the domestic demand and supply curves for a specific
standardized product in a particular nation. If the world price for this product is $1.60, this
nation will experience a domestic
40–35
Copyright © 2018 McGraw-Hill Education. All rights reserved. No reproduction or distribution without the prior
written consent of McGraw-Hill Education.
prompt exports and imports.
Test Bank: I
Topi c:
Supply and Demand Analysis of Exports and Imports
Type: Graph
61.
Refer to the diagram, which shows the domestic demand and supply curves for a specific
standardized product in a particular nation. If the world price for this product is $0.50, this
nation will experience a domestic
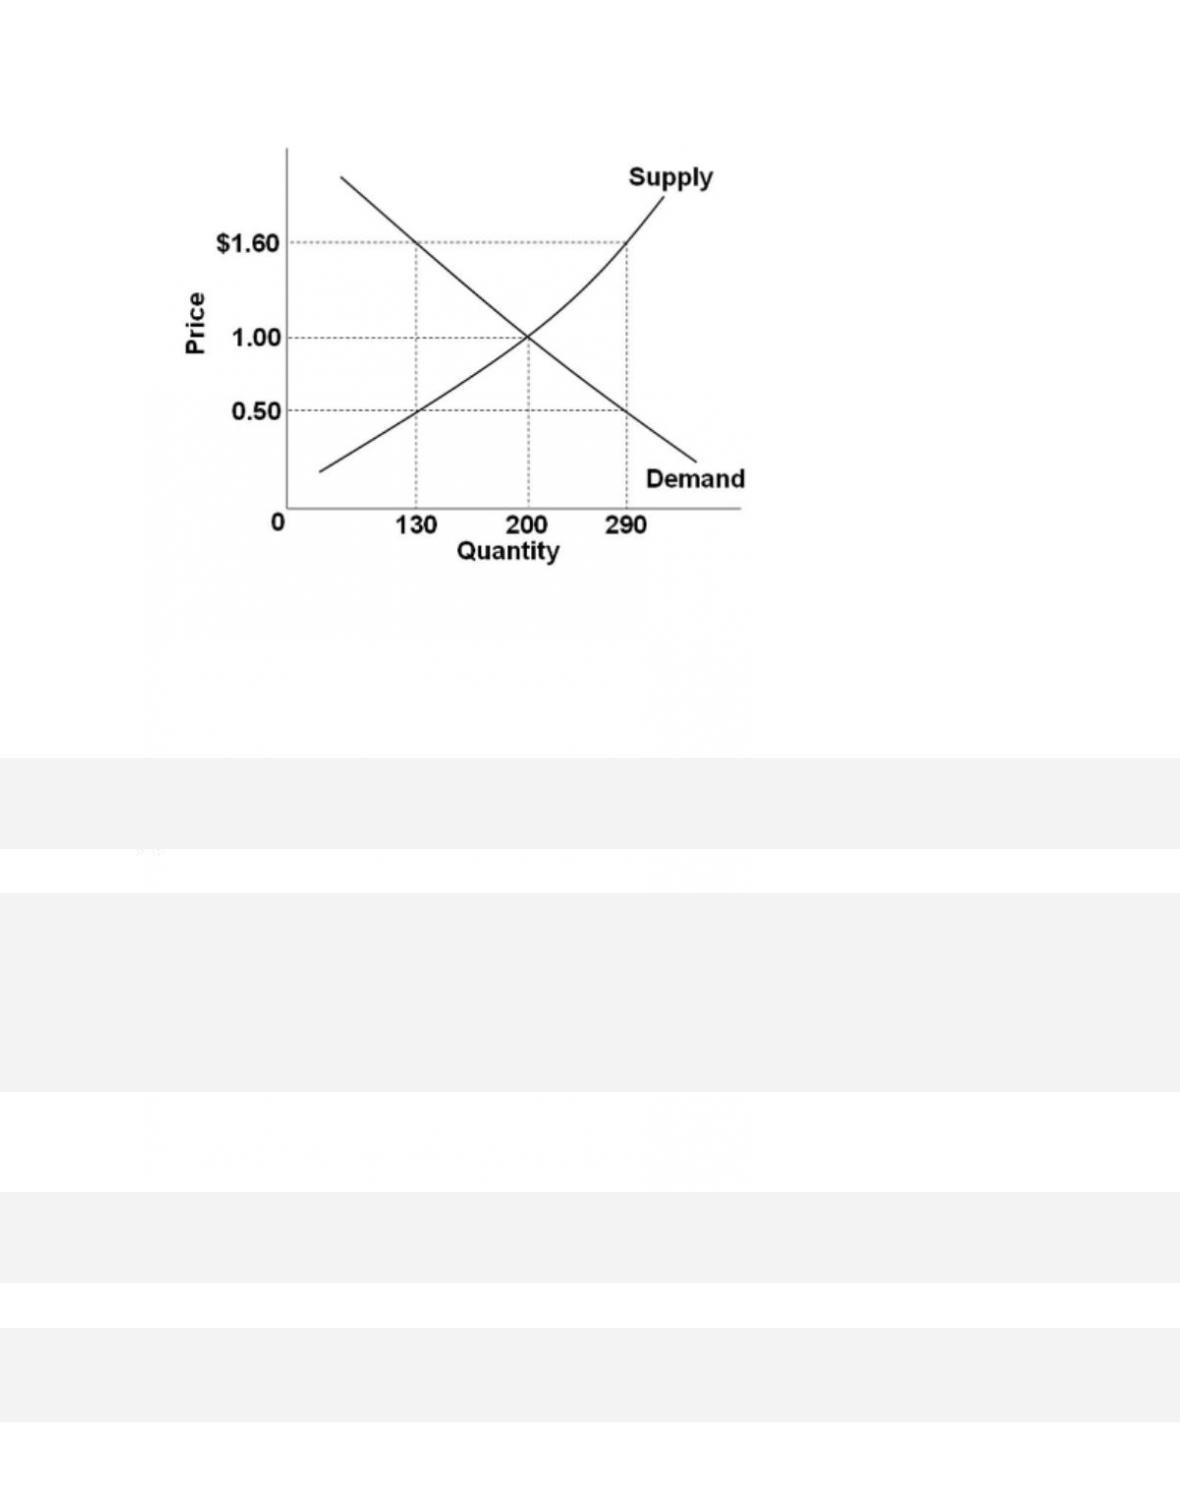
62.
Refer to the diagram, which shows the domestic demand and supply curves for a specific
standardized product in a particular nation. If the world price of this product is $1, this
nation will
63. In a two-nation model, the equilibrium world price will occur where
40–37
Copyright © 2018 McGraw-Hill Education. All rights reserved. No reproduction or distribution without the prior
written consent of McGraw-Hill Education.
A c c e s s i bi l i t y:
Keyboard Navigation
Blooms: Understand
Difficulty:
02 Medium
Learning Objective: 40-03 Describe how differences between world prices and domestic prices
prompt exports and imports.
Test Bank: I
Topi c:
Supply and Demand Analysis of Exports and Imports
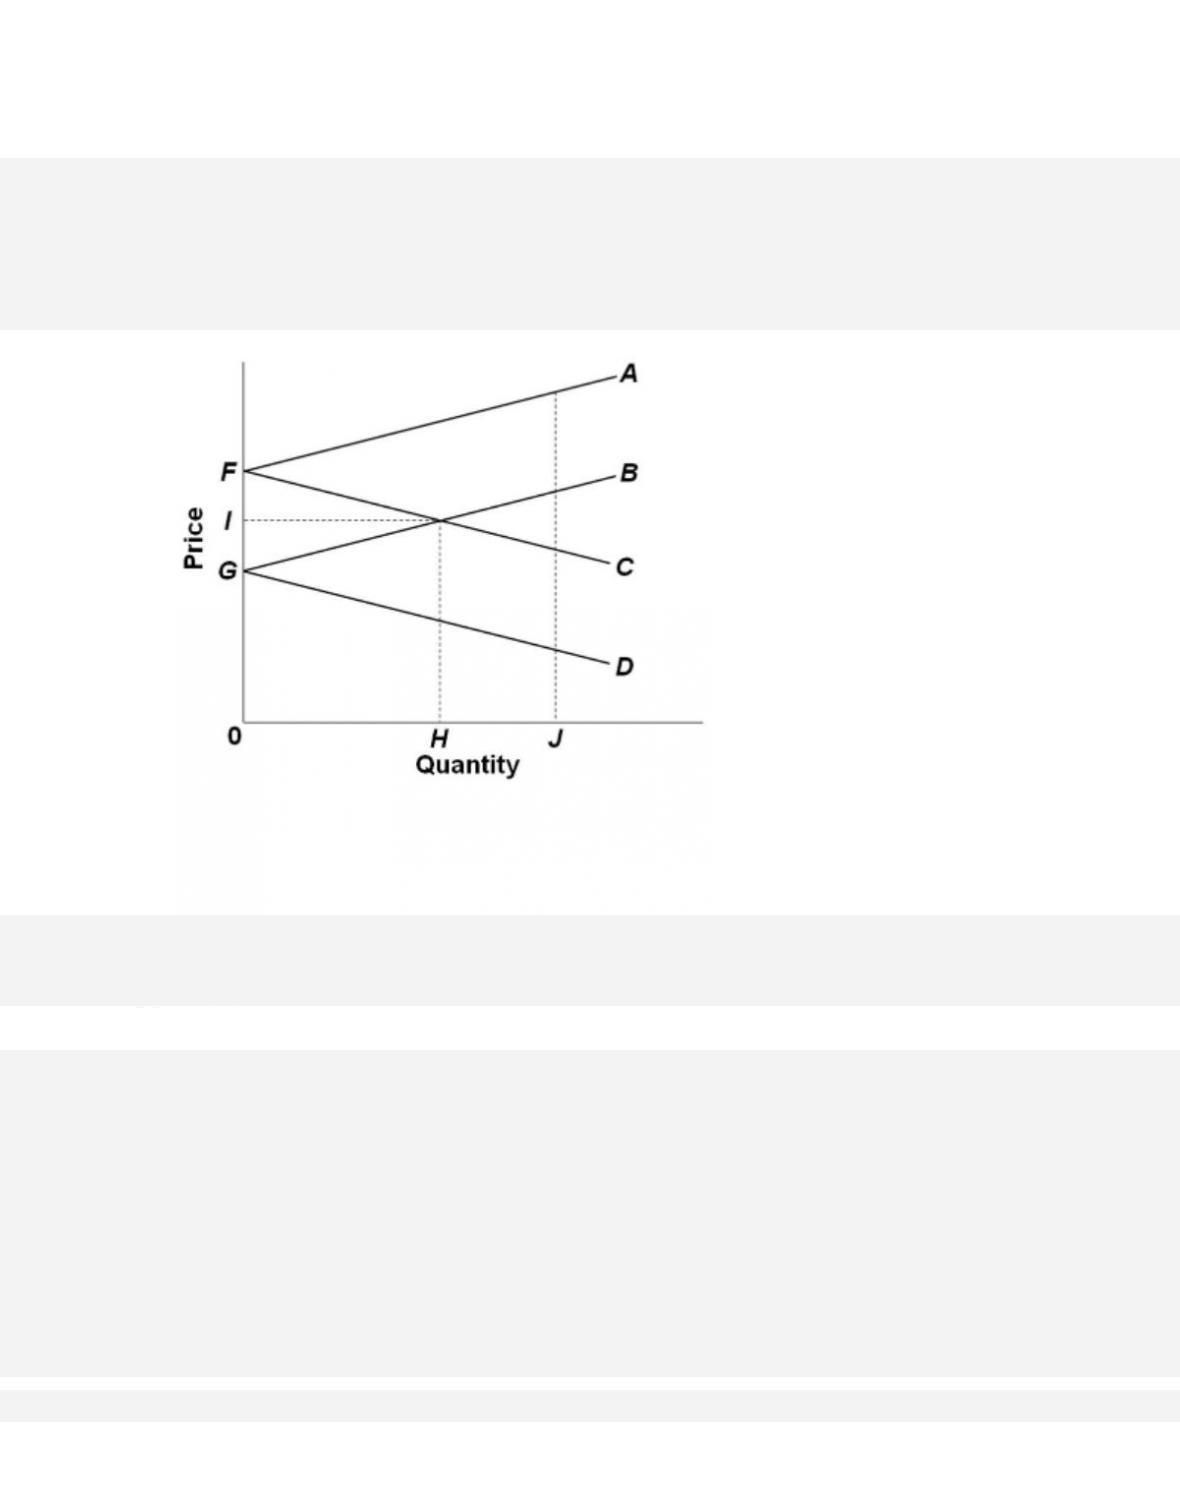
64.
Refer to the diagram pertaining to two nations and a specific product. Lines FA and GB are

65.
Refer to the diagram, which pertains to two nations and a specific product. Lines FC and
GD are
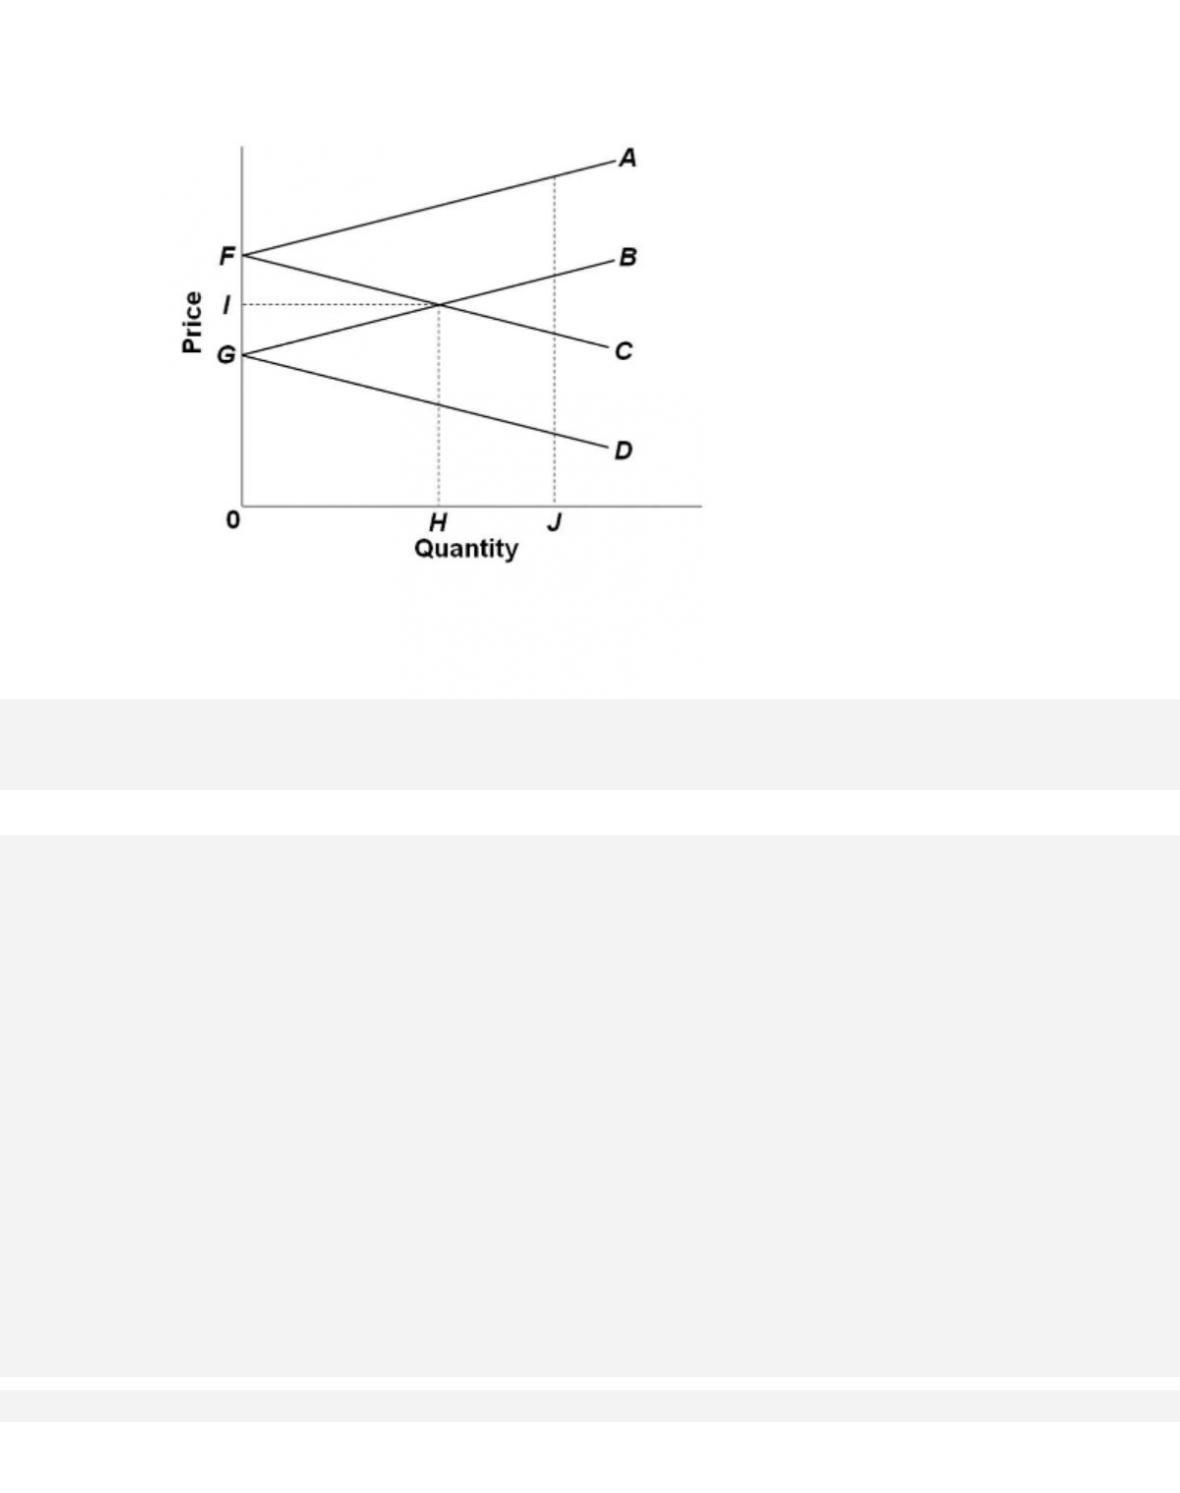
66.
Refer to the diagram, which pertains to two nations and a specific product. Point G is the
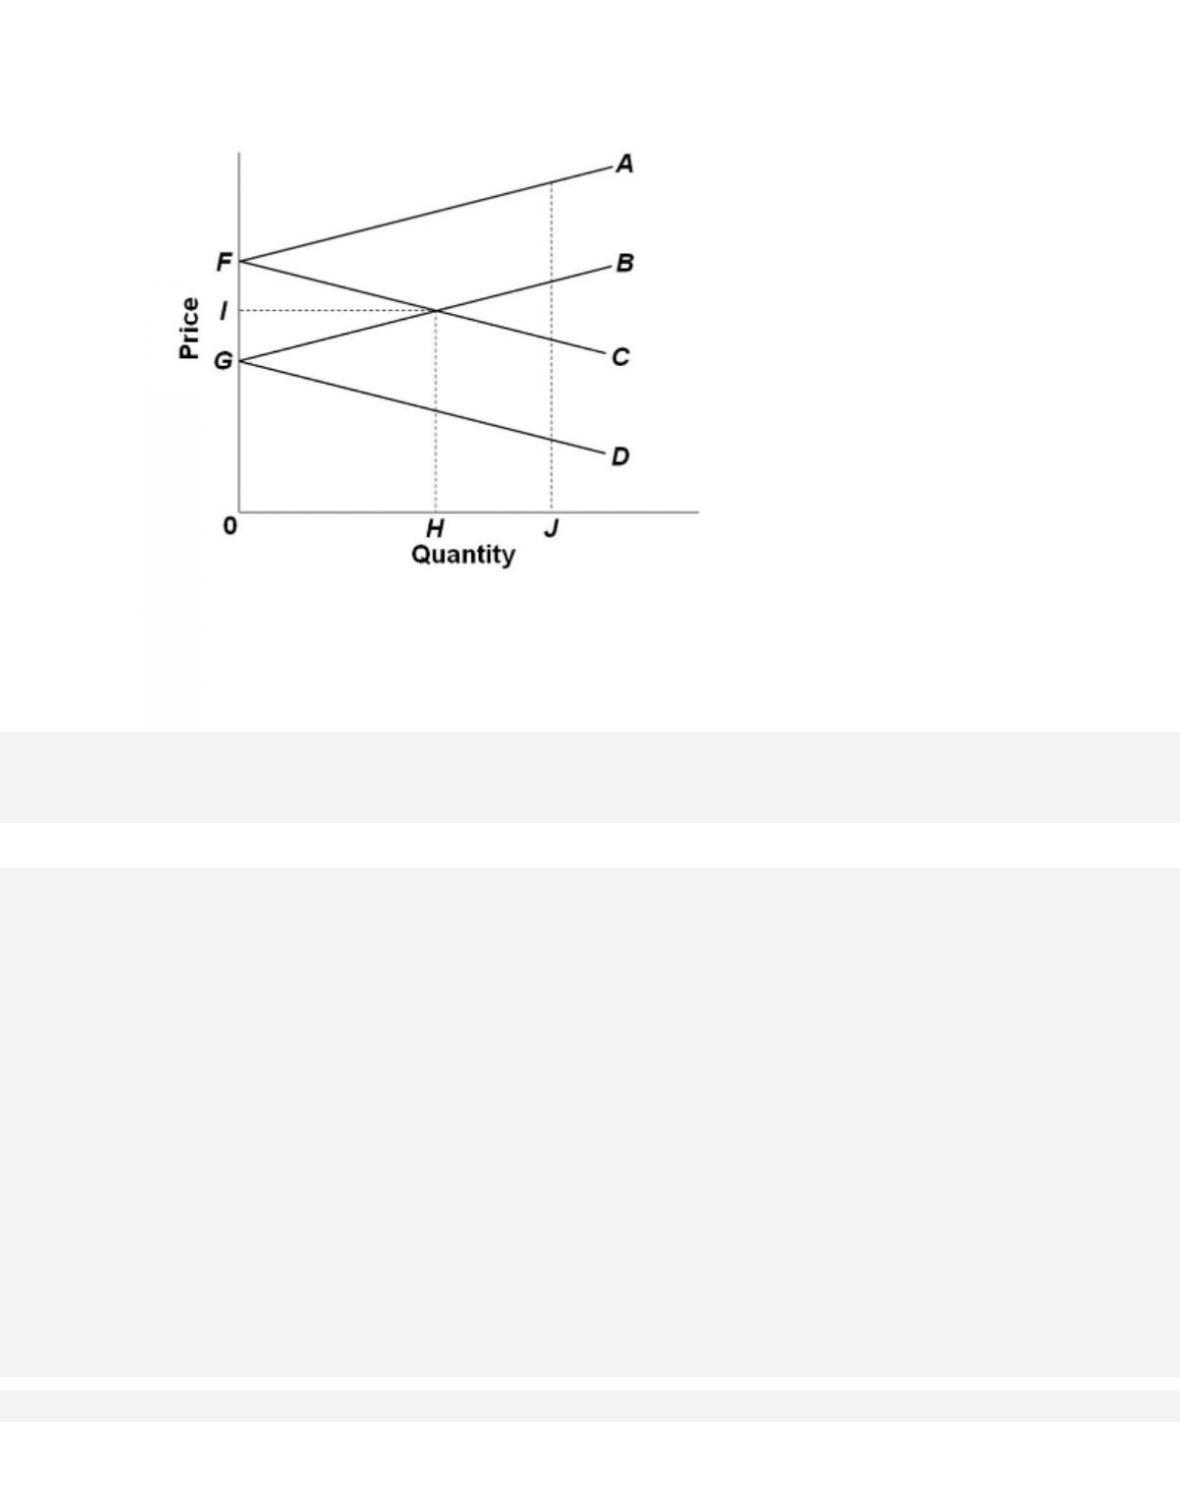
67.
Refer to the diagram, which pertains to two nations and a specific product. In equilibrium,
the nation represented by lines FA and FC will