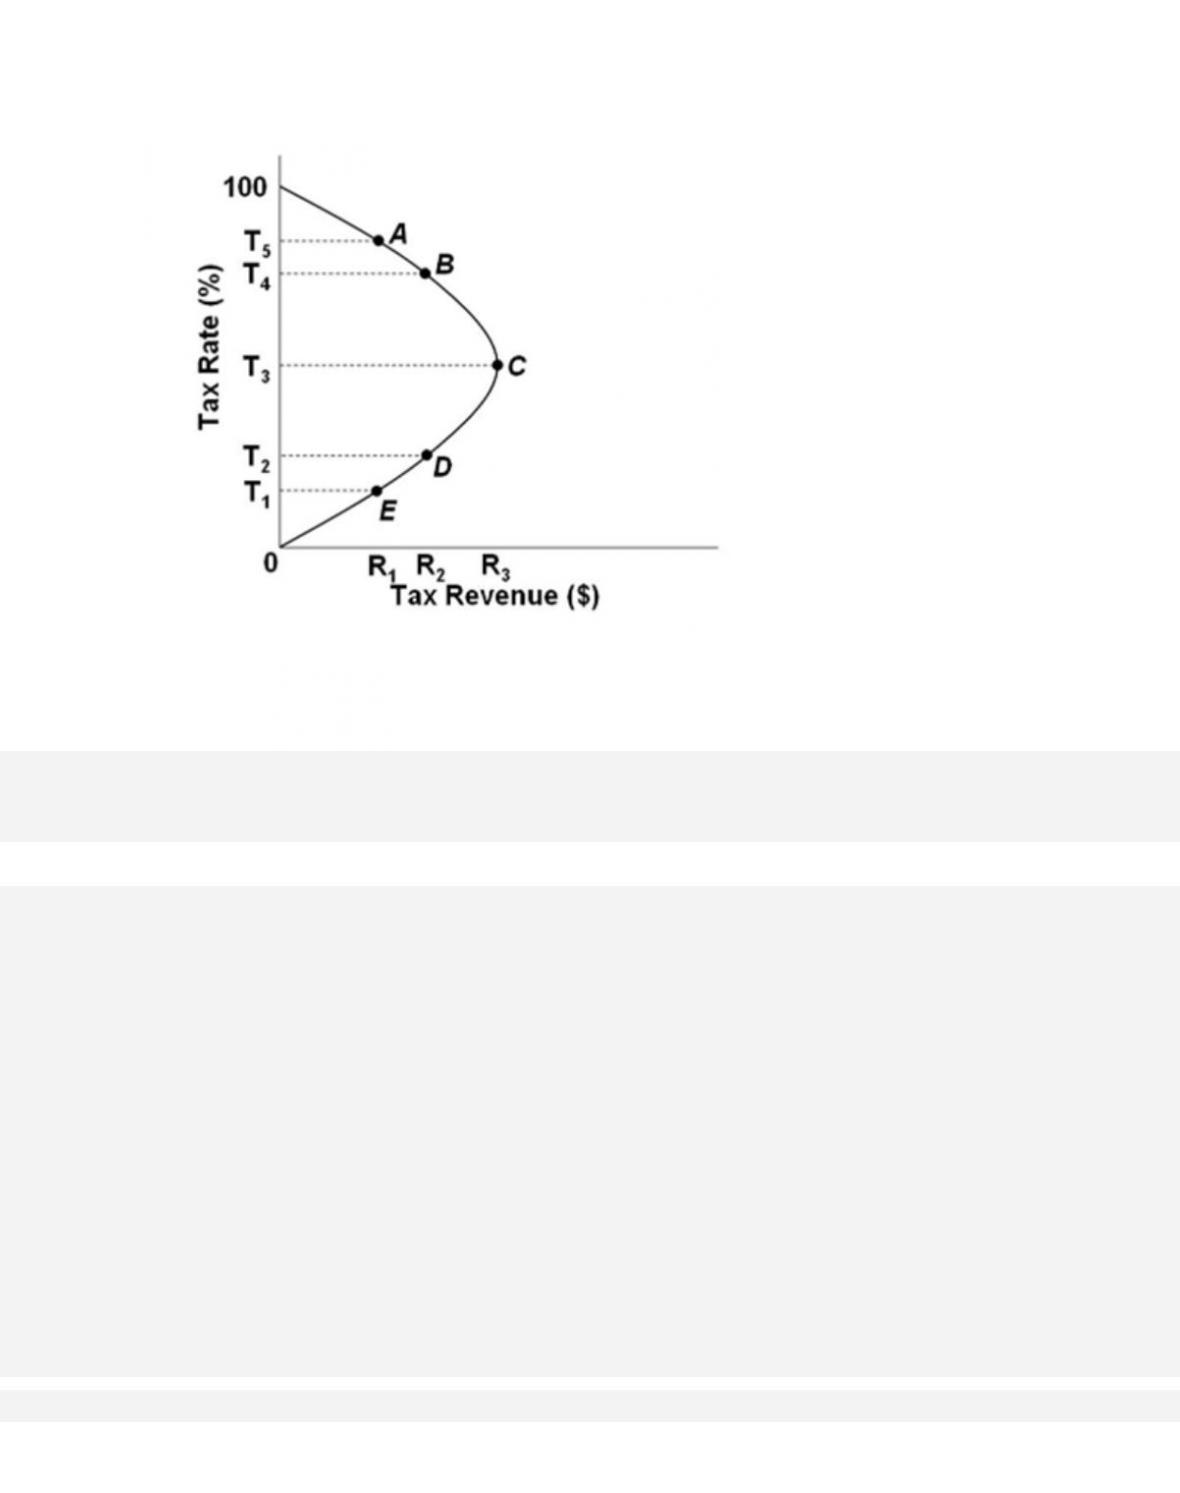
227.
Refer to the Laffer Curve. An increase in the tax rate from T3 to T4 would
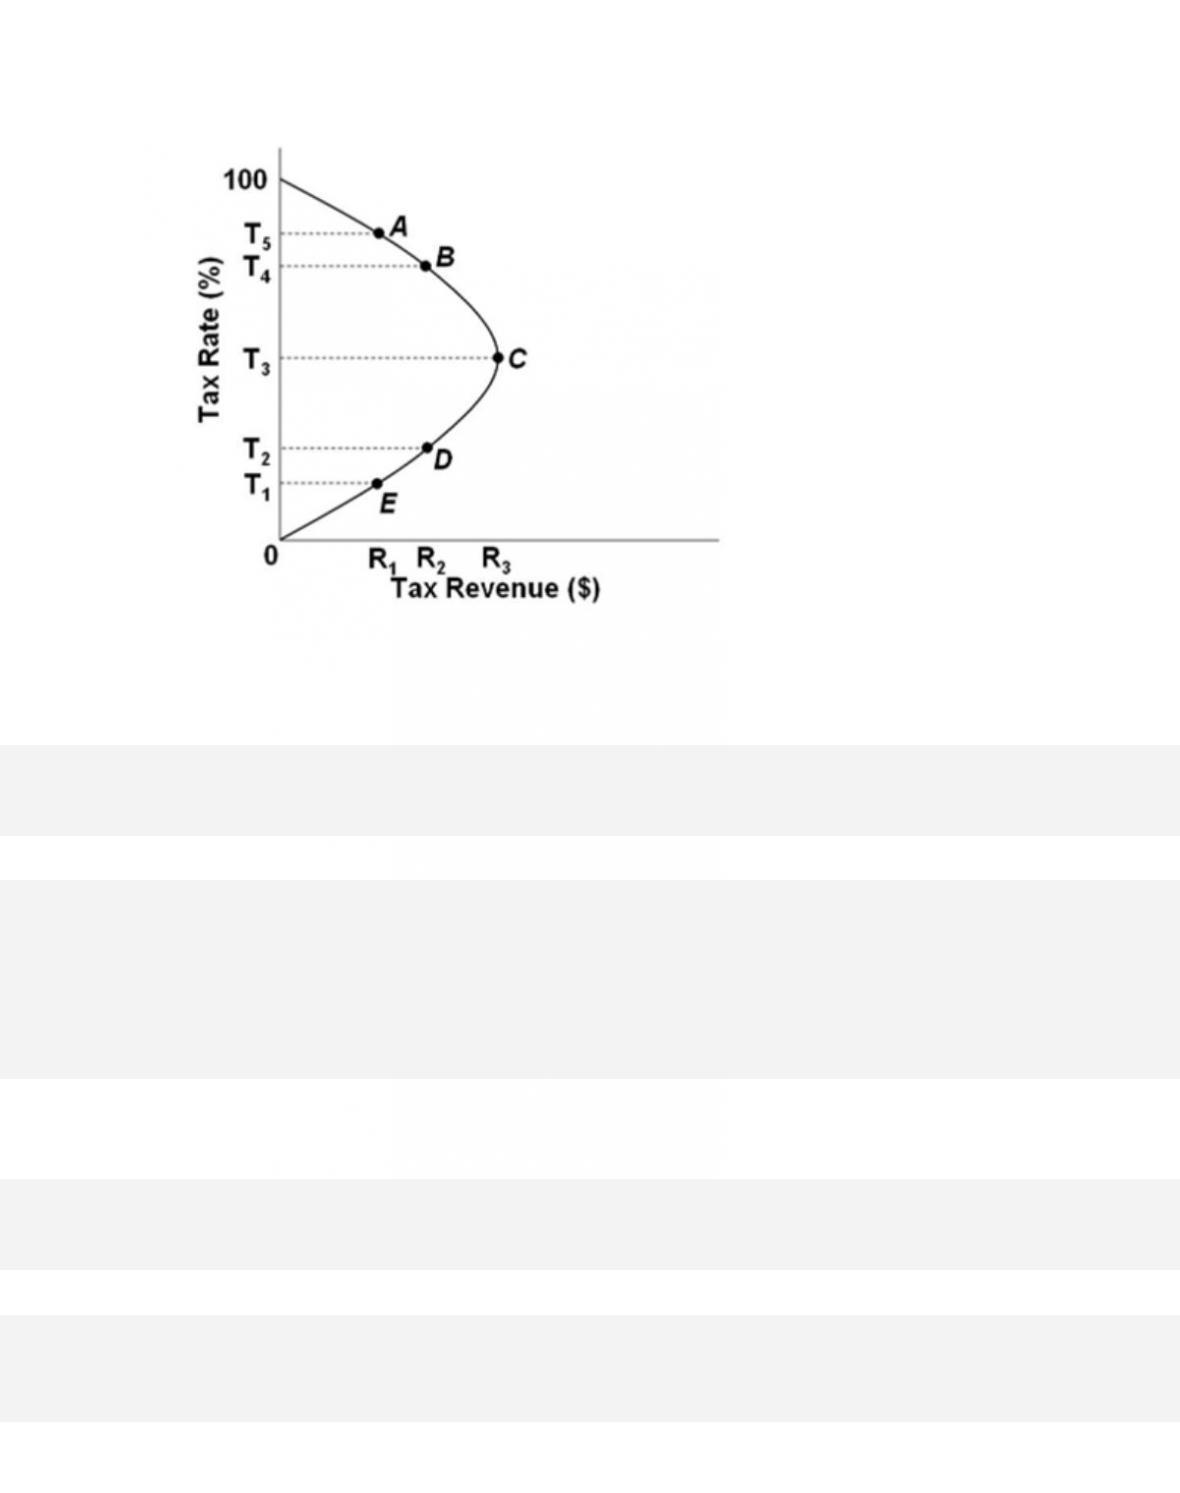
228.
Refer to the Laffer Curve. An increase in the tax rate from T2 to T3 would
229.
Most economists think that

38-142
Copyright © 2018 McGraw-Hill Education. All rights reserved. No reproduction or distribution without the prior
written consent of McGraw-Hill Education.
Access i b i lity: Keyboard Navigation
Blooms: Understand
Difficu l t y : 02 Medium
Learning Objective: 38-05 Explain the relationship between tax rates, tax revenues, and
aggregate supply.
Test Bank: II
Topic: Taxation and Aggregate Supply
230.
A senator states, “We need to cut taxes in order to increase incentives to work and
produce, so that we can pull the nation out of this
economic slump.” A mainstream
economist who is a critic of this policy would likely reply that
231.
From the perspective of supply-side economists, a cut in tax rates will
38-143
232.
One significant criticism of the major proposition of supply-side economics during the
period 1980–1988 was that
233.
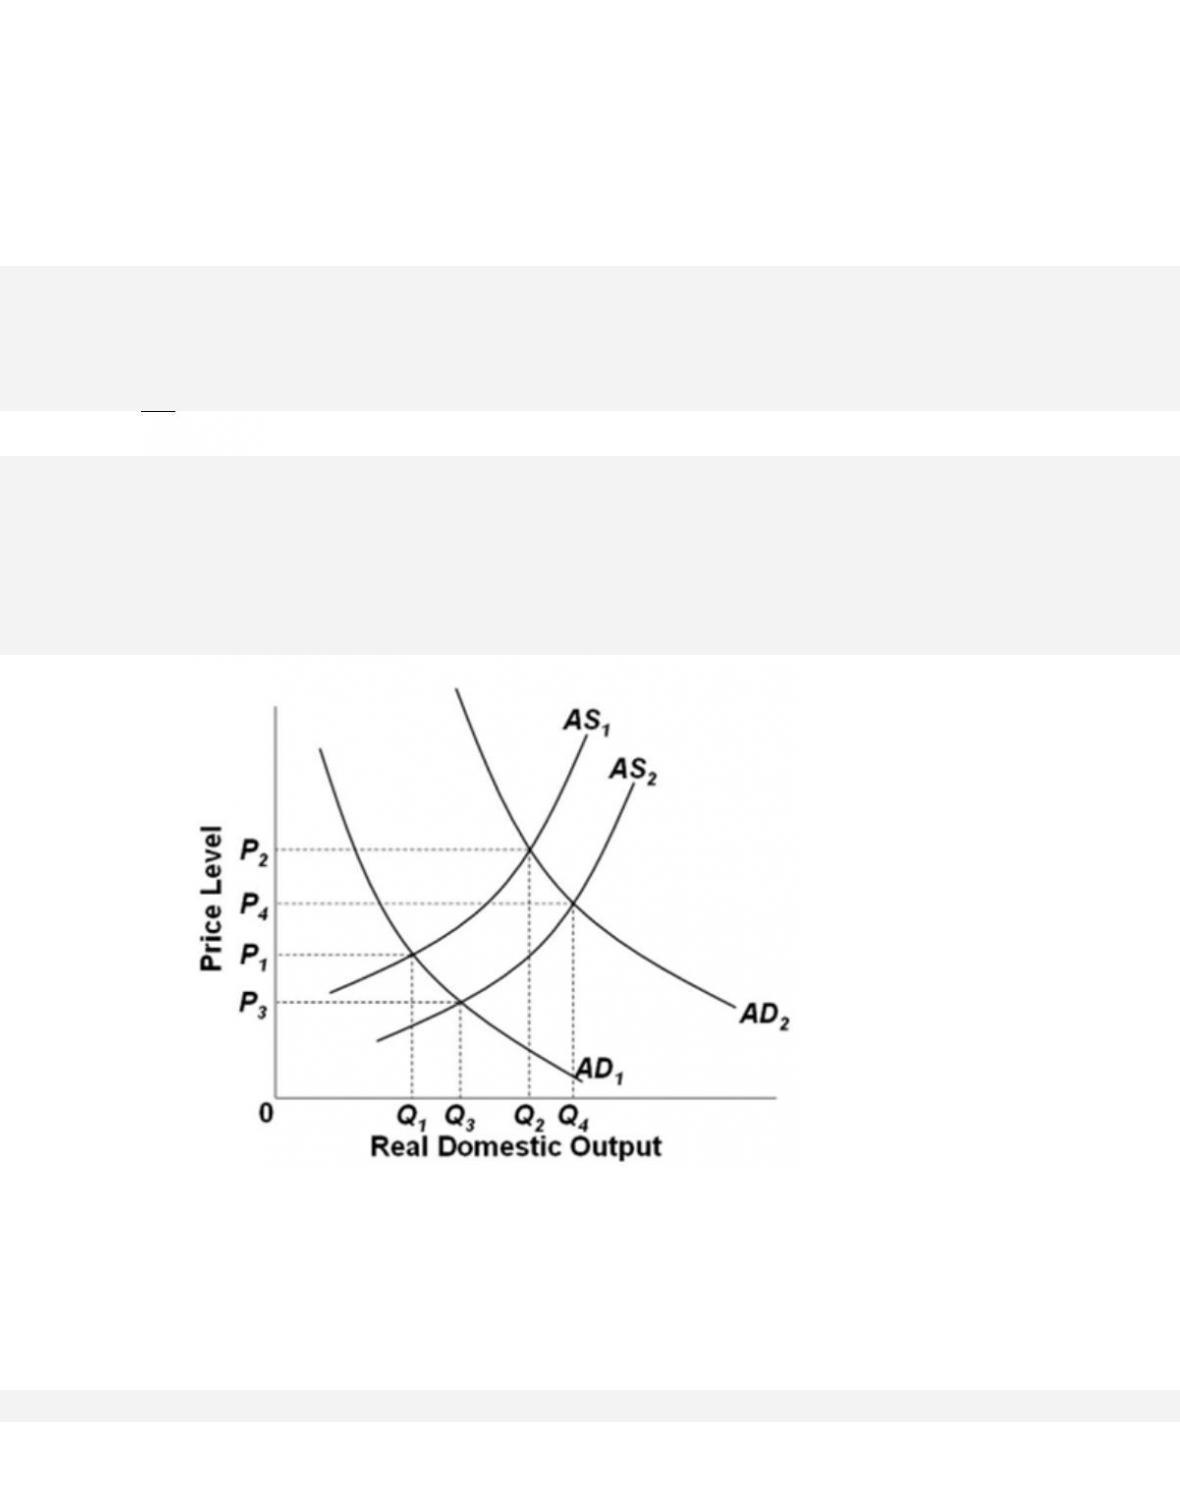
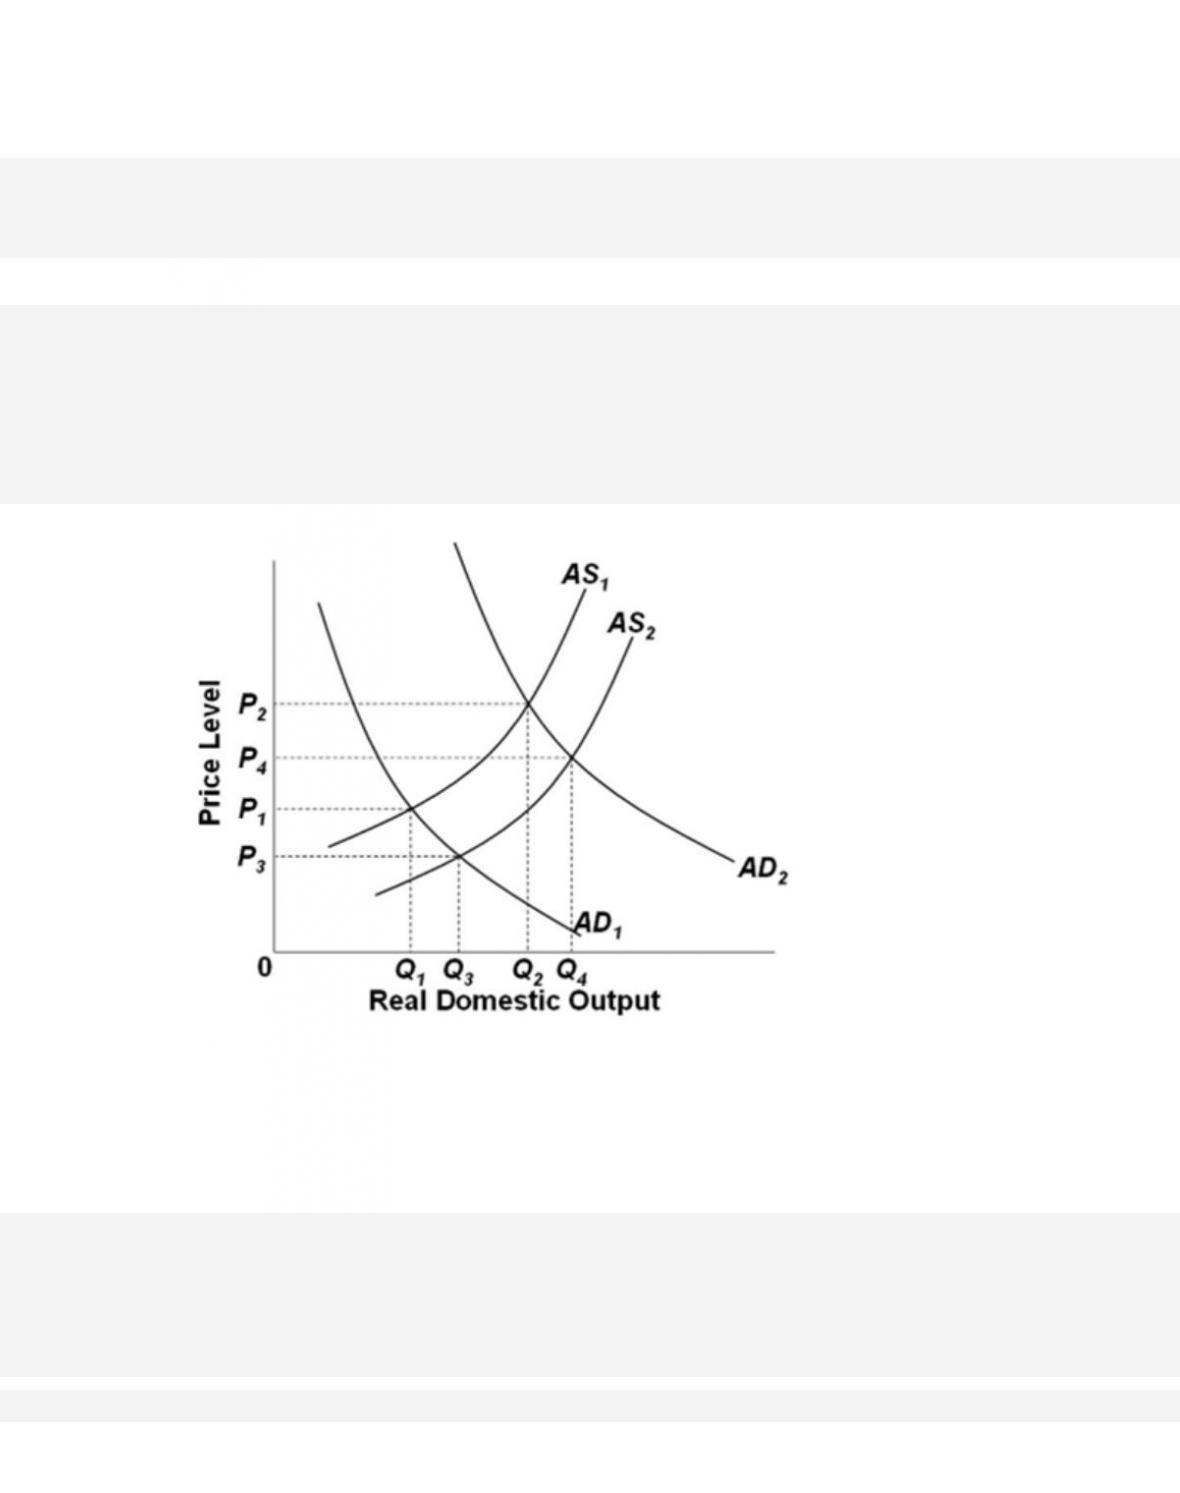
Refer to the graph. If the economy is in initial equilibrium at AD1 and AS1, then, from a
strict supply-side perspective, a cut in taxes or
tax rates would produce an equilibrium
price and quantity of
38-144
Copyright © 2018 McGraw-Hill Education. All rights reserved. No reproduction or distribution without the prior
written consent of McGraw-Hill Education.
A.
P1 and Q1.
B.
P2 and Q2.
C.
P3 and Q3.
D. P4 and Q4.
234.
Refer to the graph. If the economy is initially at equilibrium at the intersection of AD1 and
AS1 and there is a tax cut, then, from a
skeptical mainstream perspective, the immediate
impact is that aggregate

38-145
Copyright © 2018 McGraw-Hill Education. All rights reserved. No reproduction or distribution without the prior
written consent of McGraw-Hill Education.
AACSB: Knowledge Application
Blooms: Understand
Difficu l t y : 02 Medium
Learning Objective: 38-05 Explain the relationship between tax rates, tax revenues, and
aggregate supply.
Test Bank: II
Topic: Taxation and Aggregate Supply
Type: Graph
235.
One criticism against supply-side cuts in marginal tax rates is that they fail to
236.
Which presidential administration is most closely associated with the economic
policies of supply-side economics?
237.
The idea that reductions in tax rates will increase tax revenue is illustrated by the

38-146
Copyright © 2018 McGraw-Hill Education. All rights reserved. No reproduction or distribution without the prior
written consent of McGraw-Hill Education.
A.
Laffer Curve.
B.
short-run Phillips Curve.
C.
long-run Phillips Curve.
D.
aggregate supply curve.
238.
To convey the point about supply-side economics, economist Arthur Laffer likened
taxpayers to
239.
Economist Arthur Laffer argued that Robin Hood and his men would

38-147
Copyright © 2018 McGraw-Hill Education. All rights reserved. No reproduction or distribution without the prior
written consent of McGraw-Hill Education.
Blooms: Understand
Difficu l t y : 02 Medium
Learning Objective: 38-05 Explain the relationship between tax rates, tax revenues, and
aggregate supply.
Test Bank: II
Topic: Taxation and Aggregate Supply
240.
The Romer and Romer 2010 paper in the American Economic Review identified the
major motivations for most significant legislated tax
changes to be the following, except
241.
The Romer and Romer 2010 paper in the American Economic Review found that tax
changes that are made to promote long–run growth or
to reduce an inherited budget deficit
tend to result in

38-148
Copyright © 2018 McGraw-Hill Education. All rights reserved. No reproduction or distribution without the prior
written consent of McGraw-Hill Education.
True / False Questions
242.
The short run in macroeconomics is a period in which nominal wages remain fixed
even as the general price level changes.
243.
In the short run, output increases in response to a rising price level, but not in the long
run.
244.
The long run aggregate supply curve is upward-sloping because real wages eventually
change by the same amount as changes in the price
level.
245.
In the long run, the economy will always move toward full employment.

246.
In the short run, demand-pull inflation will drive up the price level and increase real
output, but in the long run, only the price level will
rise.
247.
Demand-pull inflation and cost-push inflation have similar effects on real output in the
short run.
248.
According to the simple extended AD–AS model, cost-push inflation does not last in the
long run if the government leaves the economy
alone.

249.
According to the simple extended AD–AS model, demand-pull inflation and cost-push
inflation have the same effect on output in the long
run.
250.
When the economy is experiencing cost-push inflation, an inflationary spiral is likely to
result when the government adopts a hands-off
policy.
251.
If the government adopts a hands–off policy toward inflation, then the long run effects
of cost-push inflation and demand-pull inflation are
identical.

38-151
Copyright © 2018 McGraw-Hill Education. All rights reserved. No reproduction or distribution without the prior
written consent of McGraw-Hill Education.
Access i b i lity: Keyboard Navigation
Blooms: Understand
Difficu l t y : 02 Medium
Learning Objective: 38-02 Discuss how to apply the “extended” (short-run/long-run) AD–AS
model to inflation, recessions, and economic growth.
Test Bank: II
Topic: Applying the Extended AD–AS Model
252.
If wages and other input prices are inflexible, then the economy will not automatically
adjust to full employment in the long run.
253.
According to the simple extended AD–AS model, if the economy is in a recession,
prices and nominal wages will eventually fall and the
short-run aggregate supply curve will
increase, so that real output returns to its full-employment level in the long run.
254.
According to the simple extended AD–AS model, aggregate demand is a major
determinant of the level of output in the long run.

38-152
Copyright © 2018 McGraw-Hill Education. All rights reserved. No reproduction or distribution without the prior
written consent of McGraw-Hill Education.
Blooms: Understand
Difficu l t y : 02 Medium
Learning Objective: 38-02 Discuss how to apply the “extended” (short-run/long-run) AD–AS
model to inflation, recessions, and economic growth.
Test Bank: II
Topic: Applying the Extended AD–AS Model
255.
The long-run aggregate supply curve stays in a fixed position over time.
256.
The Phillips Curve shows a positive relationship between the rate of inflation and the
unemployment rate.
257.
A rightward shift of the Phillips Curve suggests that a lower rate of unemployment is
associated with each inflation rate.

38-153
Copyright © 2018 McGraw-Hill Education. All rights reserved. No reproduction or distribution without the prior
written consent of McGraw-Hill Education.
(the Phillips Curve).
Test Bank: II
Topic: The Inflation-Unemployment Relationship
258.
In the context of the Phillips curve, stagflation can only be understood as a rightward
shift of the curve.
259.
A stable Phillips curve does not allow for the possibility of stagflation.
260.
The implication of the long-run Phillips Curve is that there is no trade-off between
inflation and unemployment in the long–run.

38-154
261.
The long-run Phillips Curve is essentially a horizontal line at the economy‘s natural rate
of inflation.
262.
The policy implication of the long-run Phillips Curve is that, while stimulative policies
may work to reduce unemployment in the short
run, the only effect of such policies in the
long run is to raise inflation.
263.
Based on the long-run Phillips Curve, any rate of inflation is compatible in the long run
with the natural rate of unemployment.
264.
The adjustment mechanism that brings the economy to its long-run aggregate supply has

38-155
to do with inflation expectations, whereas the
adjustment to the long-run Phillips curve has
to do with wage flexibility.
265.
Supply-side economists contend that aggregate supply is the relevant policy factor in
influencing the price level and real output in an
economy.
266.
Supply-side economists recommend higher marginal tax rates to increase aggregate
supply and real output.
267.
The Laffer Curve indicates that lower tax rates will increase output.

38-156
Copyright © 2018 McGraw-Hill Education. All rights reserved. No reproduction or distribution without the prior
written consent of McGraw-Hill Education.
FALSE
268.
The Laffer Curve suggests that within a certain range, lower tax rates will increase tax
revenues.
269.
One implication of the Laffer Curve in supply-side arguments is that cutting taxes may
actually reduce the budget deficit, contrary to what
traditional economics teaches.
270.
The experience of the United States with supply-side policies is that tax cuts affect the
economy more on the demand side rather than the
supply side.

38-157
Copyright © 2018 McGraw-Hill Education. All rights reserved. No reproduction or distribution without the prior
written consent of McGraw-Hill Education.
AACSB: Knowledge Application
Access i b i lity: Keyboard Navigation
Blooms: Understand
Difficu l t y : 02 Medium
Learning Objective: 38-05 Explain the relationship between tax rates, tax revenues, and
aggregate supply.
Test Bank: II
Topic: Taxation and Aggregate Supply